Agilon Health (Revised) | AGL | Long at $0.76This is a revised analysis of Agilon Health NYSE:AGL as seen here:
-------
Full disclosure: I am a holder of shares at $2.36, $0.76, and $0.79. Last entry planned near $0.50 if it reaches that level. Current cost average is near $1.11.
Let me be clear: This is a ***highly risky*** trade given the recent news regarding the CEO, securities fraud investigation, suspension of FY guidance. Do your own due diligence.
-------
The link above/previous writeup details some of the basic fundamentals of Agilon Health NYSE:AGL . As predicted, the price fell below $1 after the most recent earnings call. This was due to:
Revenue down 6% to $1.4B, Medicare Advantage membership at 498,000.
CEO Steve Sell resigning, Ron Williams appointed Executive Chairman.
2025 guidance suspended due to market challenges.
New securities fraud investigations.
I think the challenges NYSE:AGL is going through will extend through 2025 in into early 2026. If you look at the healthcare sector, it has taken a beating mostly due to Medicare and Medicaid cuts / rising healthcare costs. NYSE:AGL is not profitable and wasn't expected to become profitable until 2028 - but that may get revised....
However, the company focuses on senior patients, primarily through Medicare Advantage and ACO REACH programs, targeting value-based care for older adults across 31+ communities in 12 states. The need for services targeting the Baby Boom population is going to rapidly increase in the next few years. NYSE:AGL may become a leader in this area, but the company needs to regroup and focus on a model that returns money to investors - a dirty game. So, while the near-term is doom and gloom, the future could be very, very bright with NYSE:AGL if they are able to turn things around with this new leadership shakeup. Time will tell. It's a gamble. One I am, personally, willing to take.
Revised Targets into 2028:
$1.60 (+110.5%)
$3.00 (+294.7%)
Moving Averages

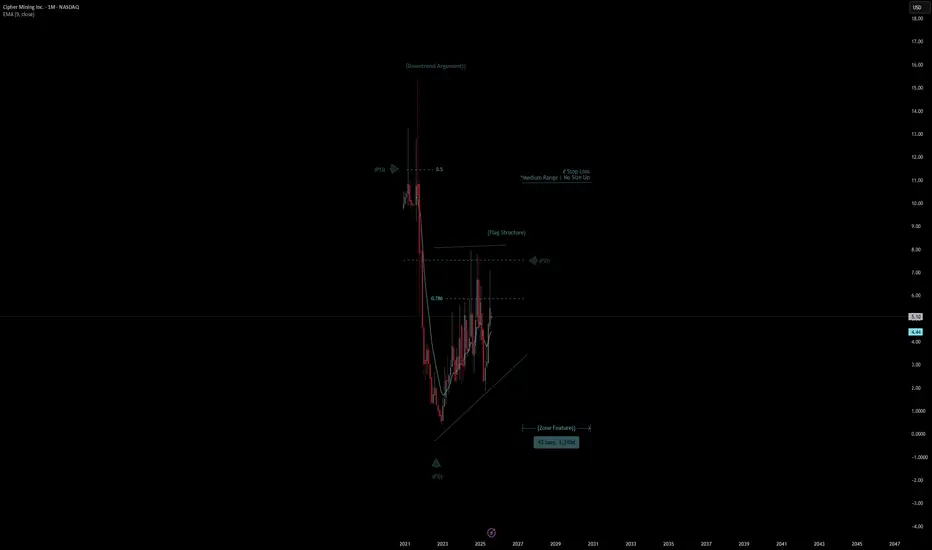
Cipher Mining Inc. Quote | Chart & Forecast SummaryKey Indicators On Trade Set Up In General
1. Push Set Up
2. Range Set Up
3. Break & Retest Set Up
Notes On Session
# Cipher Mining Inc. Quote
- Double Formation
* (Flag Structure) - *8.00 USD | Subdivision 1
* (Zone Feature)) | Completed Survey
* 43 bars, 1.310d | Date Range Method - *(Downtrend Argument))
- Triple Formation
* (P1)) / (P2)) & (P3)) | Subdivision 2
* Monthly Time Frame | Trend Settings Condition | Subdivision 3
- (Hypothesis On Entry Bias)) | Regular Settings
* Stop Loss Feature Varies Regarding To Main Entry And Can Occur Unevenly
- Position On A 1.5RR
* Stop Loss At 10.00 USD
* Entry At 7.00 USD
* Take Profit At 2.00 USD
* (Downtrend Argument)) & No Pattern Confirmation
- Continuation Pattern | Not Valid
- Reversal Pattern | Not Valid
* Ongoing Entry & (Neutral Area))
Active Sessions On Relevant Range & Elemented Probabilities;
European-Session(Upwards) - East Coast-Session(Downwards) - Asian-Session(Ranging)
Conclusion | Trade Plan Execution & Risk Management On Demand;
Overall Consensus | Sell
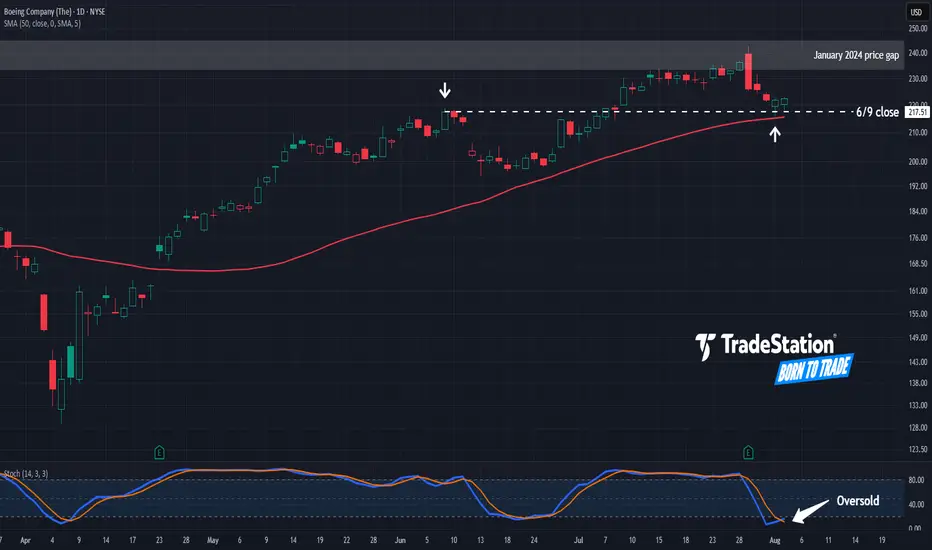
Boeing Has Pulled BackBoeing hit a 19-month high last week, and now it’s pulled back.
The first pattern on today’s chart is a price gap from January 2024. BA briefly entered that resistance area after earnings and revenue beat estimates on July 29.
Second is the June 9 close of $217.51. Sellers drove the aerospace giant to this old peak, where it’s now stabilizing. Has old resistance become new support?
Third, stochastics are turning up from an oversold condition.
Next, the 50-day simple moving average is rising from below. That may reflect a bullish intermediate-term trend.
Finally, BA is an active underlier in the options market. (Its average daily volume of 149,000 contracts ranks about 20th in the S&P 500, according to TradeStation data.) That may help traders take positions with calls and puts.
TradeStation has, for decades, advanced the trading industry, providing access to stocks, options and futures. If you're born to trade, we could be for you. See our Overview for more.
Past performance, whether actual or indicated by historical tests of strategies, is no guarantee of future performance or success. There is a possibility that you may sustain a loss equal to or greater than your entire investment regardless of which asset class you trade (equities, options or futures); therefore, you should not invest or risk money that you cannot afford to lose. Online trading is not suitable for all investors. View the document titled Characteristics and Risks of Standardized Options at www.TradeStation.com . Before trading any asset class, customers must read the relevant risk disclosure statements on www.TradeStation.com . System access and trade placement and execution may be delayed or fail due to market volatility and volume, quote delays, system and software errors, Internet traffic, outages and other factors.
Securities and futures trading is offered to self-directed customers by TradeStation Securities, Inc., a broker-dealer registered with the Securities and Exchange Commission and a futures commission merchant licensed with the Commodity Futures Trading Commission). TradeStation Securities is a member of the Financial Industry Regulatory Authority, the National Futures Association, and a number of exchanges.
Options trading is not suitable for all investors. Your TradeStation Securities’ account application to trade options will be considered and approved or disapproved based on all relevant factors, including your trading experience. See www.TradeStation.com . Visit www.TradeStation.com for full details on the costs and fees associated with options.
Margin trading involves risks, and it is important that you fully understand those risks before trading on margin. The Margin Disclosure Statement outlines many of those risks, including that you can lose more funds than you deposit in your margin account; your brokerage firm can force the sale of securities in your account; your brokerage firm can sell your securities without contacting you; and you are not entitled to an extension of time on a margin call. Review the Margin Disclosure Statement at www.TradeStation.com .
TradeStation Securities, Inc. and TradeStation Technologies, Inc. are each wholly owned subsidiaries of TradeStation Group, Inc., both operating, and providing products and services, under the TradeStation brand and trademark. When applying for, or purchasing, accounts, subscriptions, products and services, it is important that you know which company you will be dealing with. Visit www.TradeStation.com for further important information explaining what this means.
USDCHF 5 MIN TIMEFRAME BUY POTENTIALImpulse correction impulse trading. 4hr 10 and 20 EMA on uptrend, 30 min timeframe hitting off the emas. Currently on correction on 5 minute timeframe waiting for price to fill imbalance before breaking up. 1:4RR trade!

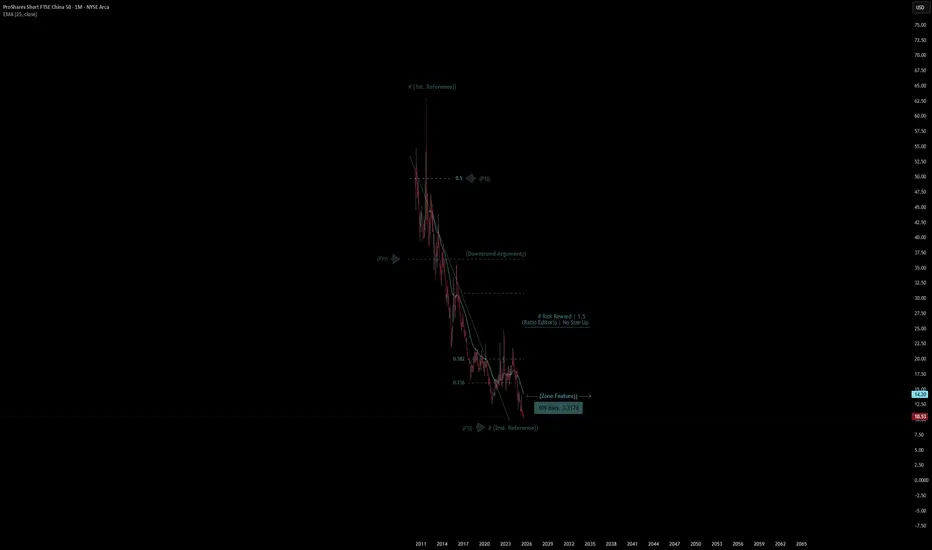
ProShares Short FTSE Quote | Chart & Forecast SummaryKey Indicators On Trade Set Up In General
1. Push Set Up
2. Range Set Up
3. Break & Retest Set Up
Notes On Session
# ProShares Short FTSE - Quote
- Double Formation
* (Downtrend Argument)) At 35.00 USD | Subdivision 1
* # Risk Reward | 1.5 - *(Ratio Editor)) | No Size Up | Completed Survey
* 98 bars, 2.980d | Date Range Method - *(Uptrend Argument))
- Triple Formation
* (P1)) / (P2)) & (P3)) | Subdivision 2
* Weekly Time Frame | Trend Settings Condition | Subdivision 3
- (Hypothesis On Entry Bias)) | Regular Settings
* Stop Loss Feature Varies Regarding To Main Entry And Can Occur Unevenly
- Position On A 1.5RR
* Stop Loss At 28.00 USD
* Entry At 20.00 USD
* Take Profit At 7.00 USD
* (Downtrend Argument)) & No Pattern Confirmation
- Continuation Pattern | Not Valid
- Reversal Pattern | Not Valid
* Ongoing Entry & (Neutral Area))
Active Sessions On Relevant Range & Elemented Probabilities;
European-Session(Upwards) - East Coast-Session(Downwards) - Asian-Session(Ranging)
Conclusion | Trade Plan Execution & Risk Management On Demand;
Overall Consensus | Sell
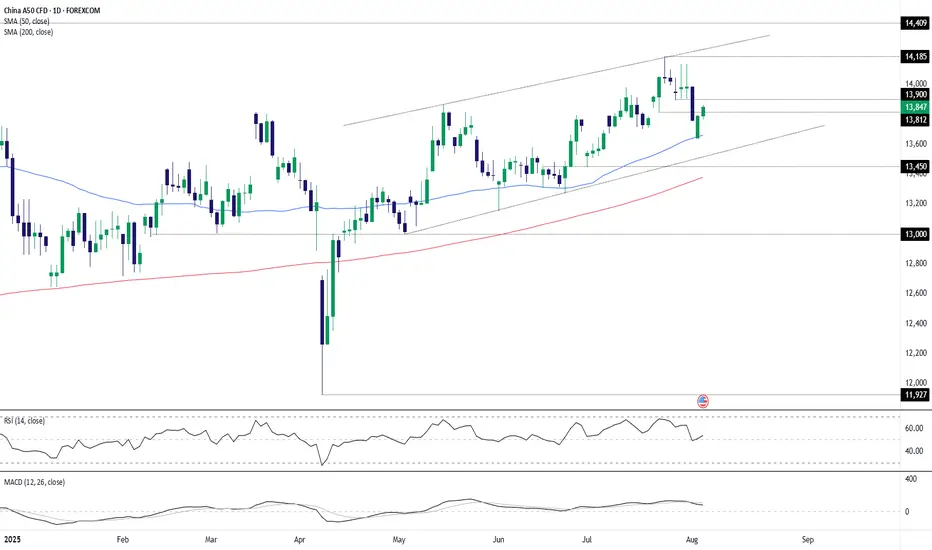
China A50 bullish setupChina A50 remains in an uptrend, marked by higher lows since April and repeated bounces from the 50-day moving average. With both 50 and 200-day averages pointing higher, the bias favours playing from the long side.
A break and hold above 13812 would generate a bullish setup, opening the door for longs with stop beneath for protection. 13900 is the first hurdle, followed by 14000, with 14185 as a potential target. A clean break there would put 14409 in play. If the index can’t hold 13812, the focus flips back to the 50-day moving average as near-term support.
Good luck!
DS
Another formation of head and shoulderSolano possibly forming a head and shoulder weekly pattern. Watching the support is critical which confirms the head and shoulder pattern and a reversal opportunity to a lower target such as the trendline support or even lower. An invalidation of the left shoulder open opportunity to break out the ATH and target higher. The weekly moving average holding a support at the moment and price didn't dip lower. Keeping major economics in mind the higher highs and expectation of cutting interest rate could invalidate the head and shoulder pattern.

Precision Instruments - Quote | Chart & Forecast SummaryKey Indicators On Trade Set Up In General
1. Push Set Up
2. Range Set Up
3. Break & Retest Set Up
Notes On Session
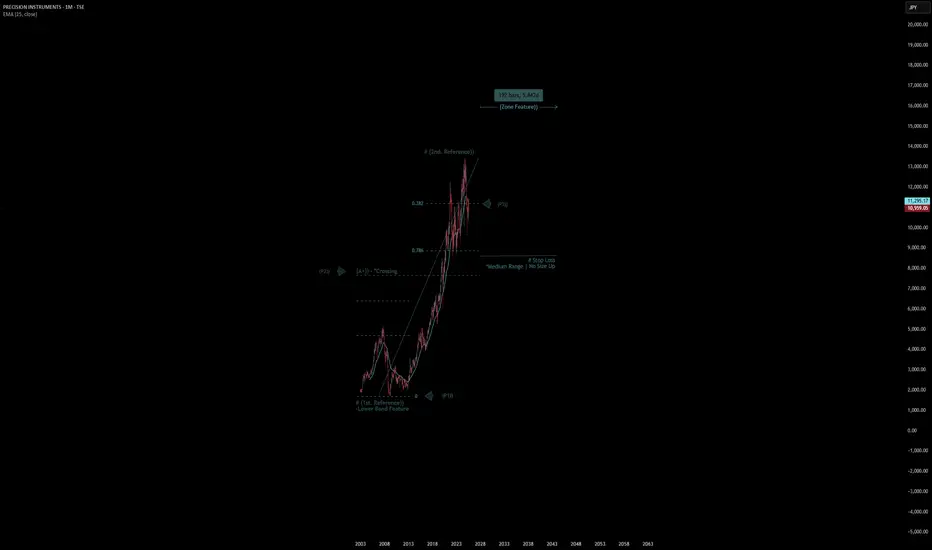
# Precision Instruments - Quote
- Double Formation
* # (1st. Reference)) - *Lower Band Feature | Subdivision 1
* (A+)) - *Crossing | Completed Survey
* 192 bars, 5.842d | Date Range Method - *(Uptrend Argument))
- Triple Formation
* (P1)) / (P2)) & (P3)) | Subdivision 2
* Weekly Time Frame | Trend Settings Condition | Subdivision 3
- (Hypothesis On Entry Bias)) | Indexed To 100
* Stop Loss Feature Varies Regarding To Main Entry And Can Occur Unevenly
- Position On A 1.5RR
* Stop Loss At 425.00 JPY
* Entry At 540.00 JPY
* Take Profit At 700.00 JPY
* (Uptrend Argument)) & No Pattern Confirmation
- Continuation Pattern | Not Valid
- Reversal Pattern | Not Valid
* Ongoing Entry & (Neutral Area))
Active Sessions On Relevant Range & Elemented Probabilities;
European-Session(Upwards) - East Coast-Session(Downwards) - Asian-Session(Ranging)
Conclusion | Trade Plan Execution & Risk Management On Demand;
Overall Consensus | Buy
Crypto consolidating ahead of rally towards All Time HighsWith US equity markets closed for Juneteenth, I'm checking in on an equal weight basket of cryptos. Recently I said crypto looked to be heating up for a run at new highs.
As I look today, prices appear range bound on the daily chart. There's a bearish double-top formation, beside declining momentum. The bottom of the range resting at the 200 Day Moving Average, and a test of it seems likely.
Should there be a bounce off the 200 Day SMA, and a break through the top end of the range we might get a shot at those new All Time Highs.

OPKO Health | OPK | Long at $1.12OPKO Health finally closed the price gap on the daily chart between $1.11 and $1.12. There are no more price gaps below the current price (bullish). In the past year, insiders (primarily the CEO), have purchased over $4.7 million of shares at an average price of $1.55. Historically, this stock is very cyclical, and I believe we are near the bottom before the next cycle up. I have no idea when this will occur (may trade sideways for a while or dip below $1 in the near-term), but the insider purchases tell me they are preparing for a move. Average analyst price targets are between $2.75 and $3.99 right now, depending on the source. Book value = $1.66. As with any biopharmaceutical and diagnostics company, NASDAQ:OPK is purely speculative at this stage - yet raking in over $600 million in annual revenue.
My personal buy for NASDAQ:OPK was triggered at $1.12 and I hope to see more insider buying at this level.
Targets into 2028:
$1.40 (+22.8%)
$1.66 (+45.6%)
Squeeze for any reason = $5.00 (+338.6%)

Bitcoin & strong supportBitcoin is holding above 50MA and 61% of Fibonacci, it also has bullish divergence on RSI with bullish engulfing candle. upside movement is coming soon
Energy stocks poised for fresh ATHEnergy stocks (XLE) have been in a clear ascending triangle for some months now on the weekly chart. There was a false breakout not too long back, but the pattern held up after breaking down and price is again pushing up against resistance at the top of the triangle.
Having recently posted a massive green candle with the angst in the Middle East, coming weeks and months could bear witness to fresh all time highs.

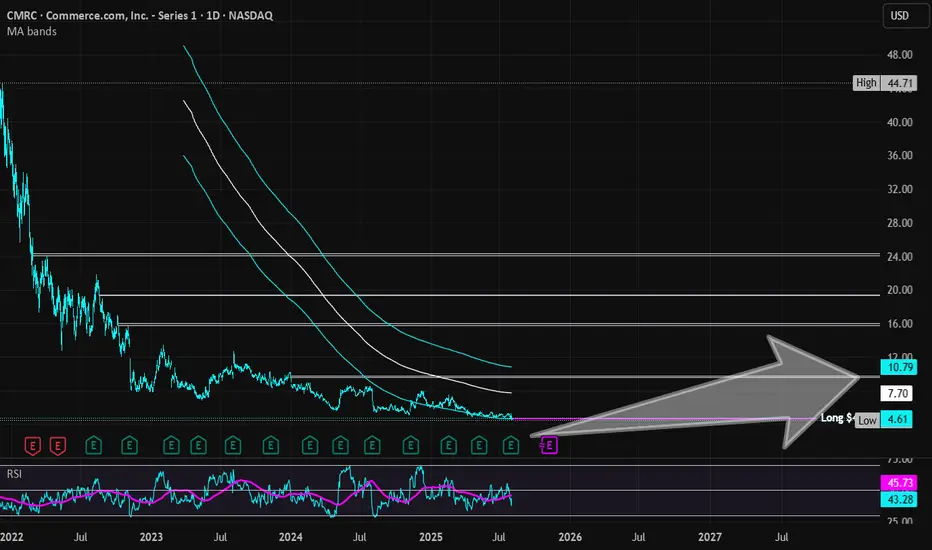
Commerce.com | CMRC | Long at $4.68BigCommerce recently rebranded to Commerce.com NASDAQ:CMRC . Full disclosure: I am an initial stockholder at $7.15, but grabbing more shares below $5 - average current holding is $5.68.
During the most recent earnings call for NASDAQ:CMRC , the company announced AI-driven partnerships with Google Cloud (Gemini) and PROS Holdings to enhance product discovery and pricing. They are now focused on "agentic commerce" (a new paradigm in online shopping where AI-powered agents autonomously handle the entire shopping process, from product discovery to purchase, on behalf of users) and B2B growth (Quick Start Accelerator program). The shift of this company focusing away from standard shopping experiences to new AI-powered ones is a major catalyst for me believing this company can grow significantly. Companies like NASDAQ:URBN , NYSE:TPR , NYSE:DELL , NYSE:VFC use NASDAQ:CMRC and others will surely hop on board if the AI shopping enhances consumer experiences.
However, the economy is VERY shaky right now and consumers are spending less. There is a chance the growth outlook for NASDAQ:CMRC (4.6% annual revenue growth through 2028) may not occur. Thus, this is a **highly speculative** investment. I would not be surprised if the economy flips and this tanks to near or below $1 in the near-term. With that in-mind, this is a long-term position build for me until targets are hit. If I have to hold for years, I am okay with that as long as the major fundamentals do not change. Those without thick skin should stay away...
From a technical analysis perspective, the price has entered and is riding my historical simple moving average area. This usually signifies the accumulation phase of a stock cycle and is what I will be doing - which is why I am adding shares at $4.68.
Targets into 2028:
$7.00 (+49.6%)
$9.50 (+103.0%)
Market Cap SOL, $ - Quote | Chart & Forecast SummaryKey Indicators On Trade Set Up In General
1. Push Set Up
2. Range Set Up
3. Break & Retest Set Up
Notes On Session
# Market Cap SOL, $ - Quote
- Double Formation
* (A+)) - *Crossing | Subdivision 1
* (EMA Settings)) - *100
- Lower Band Feature | Completed Survey
* 201 bars, 1,407d | Date Range Method - *(Uptrend Argument))
- Triple Formation
* (P1)) / (P2)) & (P3)) | Subdivision 2
* Weekly Time Frame | Trend Settings Condition | Subdivision 3
- (Hypothesis On Entry Bias)) | Logarithmic Settings
* Stop Loss Feature Varies Regarding To Main Entry And Can Occur Unevenly
- Position On A 1.5RR
* Stop Loss At 60B | USD
* Entry At 90B | USD
* Take Profit At 132B | USD
* (Uptrend Argument)) & No Pattern Confirmation
- Continuation Pattern | Not Valid
- Reversal Pattern | Not Valid
* Ongoing Entry & (Neutral Area))
Active Sessions On Relevant Range & Elemented Probabilities;
European-Session(Upwards) - East Coast-Session(Downwards) - Asian-Session(Ranging)
Conclusion | Trade Plan Execution & Risk Management On Demand;
Overall Consensus | Buy

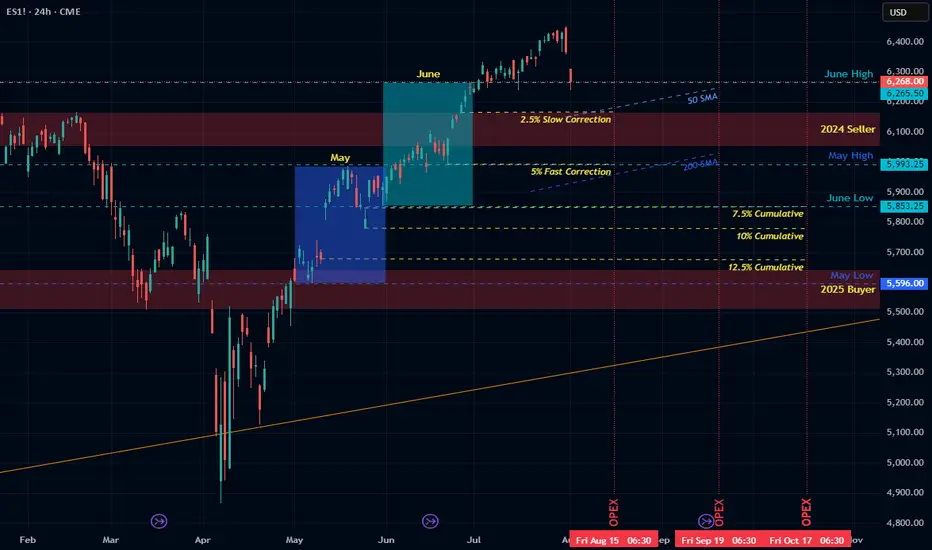
Path into Q3Outlook for the Next Few Months
• Now–August OpEx: -2.5% to -5% slow correction
• August–September OpEx: potential 5–7.5% additional decline
• By late Q3: cumulative 10–12.5% drawdown (target S&P ~5700).
• October: possible bounce — or acceleration if data worsens
• End of Year: risk of deep drop à la Oct–Dec 2018 if trends continue
Macro Backdrop
• Watch for margin compression, CPI surprise, and unemployment uptick
• Private data shows more fragility than government numbers
• QRA-driven liquidity tightening may amplify downside risk
Political Timing and Fed Policy
• Administration may welcome controlled decline to enable early 2026 rate cuts
• If market doesn’t decline soon, blow-off top/melt-up into midterms possible
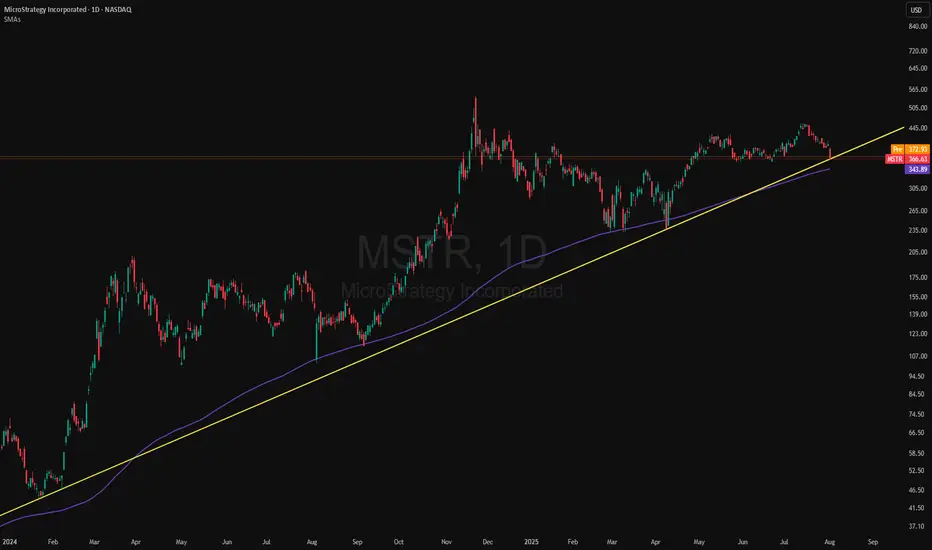
MSTR: Dual Support Test - 200 SMA & Trendline Hold… for NowMSTR (MicroStrategy) is now testing a key technical zone that combines dynamic trendline support and the widely-followed 200-day simple moving average (SMA). These two indicators have provided critical inflection points for the stock over the past year - and we’re back there again.
The current pullback may offer a pivotal bounce opportunity if buyers step in at this technical confluence.
Technical Highlights:
Long-term trendline (from early 2024) continues to hold as support.
200-day SMA has triggered rebounds multiple times, aligning closely with the trendline.
Price action is compressing into a narrowing zone - watch for resolution.
A clean break below may signal deeper correction; holding here keeps the bull case alive.
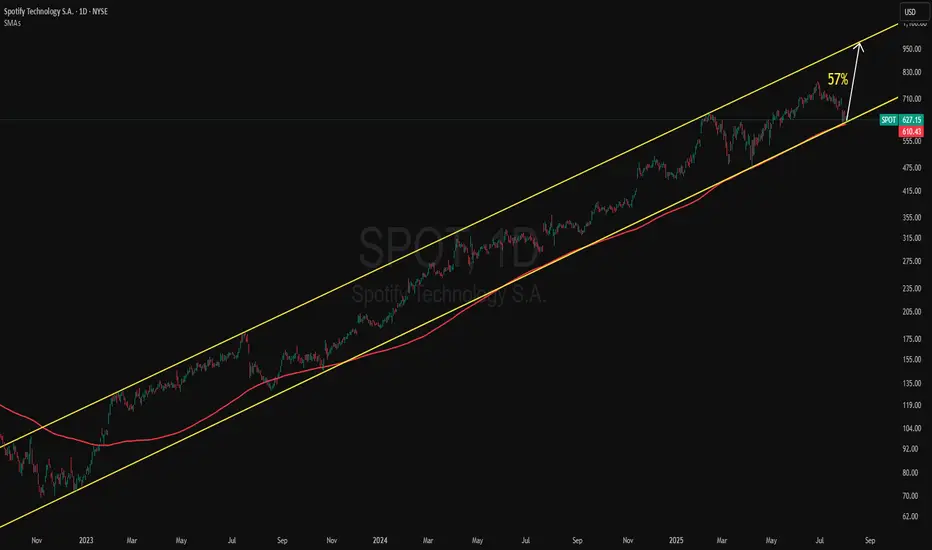
SPOT: Rebounding Off the 150 SMA -- Upper Channel Next?SPOT (Spotify) has been trading within a well-defined ascending parallel channel since late 2022. The recent dip brought price action close to the lower boundary of the channel, right at the 150-day moving average, which acted as support several times in the past.
This confluence between trendline and moving average support suggests potential for a bounce — possibly back toward the upper range of the channel.
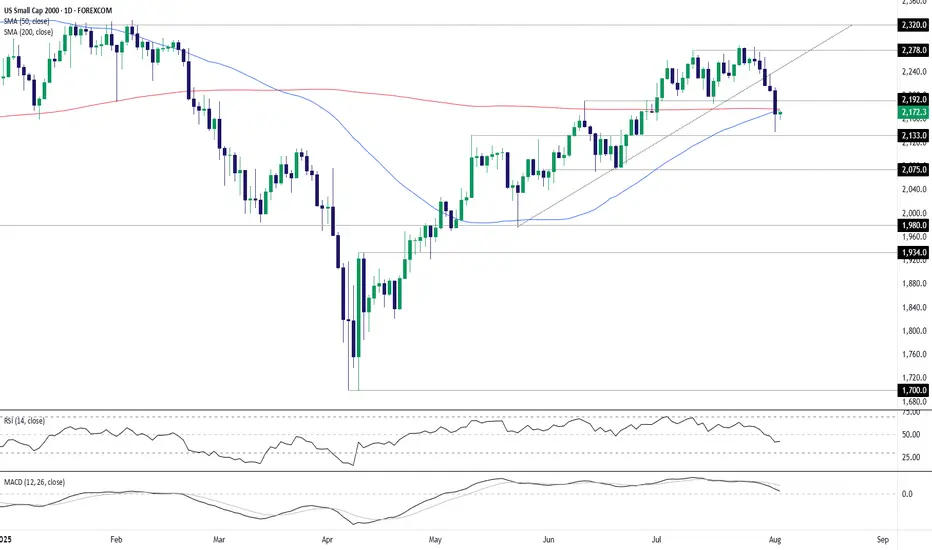
Small Caps: Rebound or rollover at 200DMA?Near-term price action in U.S. small-cap stocks may be instructive for assessing longer-term directional risks, with the contract trading near the key 200-day simple moving average.
Despite breaking uptrend support and extending the bearish move late last week, buying dips remains the preferred strategy unless there’s clear evidence the U.S. economy is sliding into recession—an outcome unlikely to be resolved near-term with only second-tier economic data on the calendar this week. That also means market pricing for just under 100 basis points of Fed rate cuts by mid-2026 is unlikely to shift dramatically, helping to support risk appetite.
If the contract can reclaim the 200DMA and hold there, longs could be initiated with a stop beneath the level for protection against reversal. 2192 is an early hurdle for bulls with a break of that level opening the door for a run towards 2240 or even 2278.
Alternatively, if the contract remains capped beneath the 200DMA, the setup could be flipped with shorts established below the level and a stop above. Friday’s low and 2133 are obvious near-term targets, with support at 2075 the next downside level after that.
Momentum indicators remain mixed despite rolling over in late July, placing more weight on price action rather than any firm directional bias.
Good luck!
DS
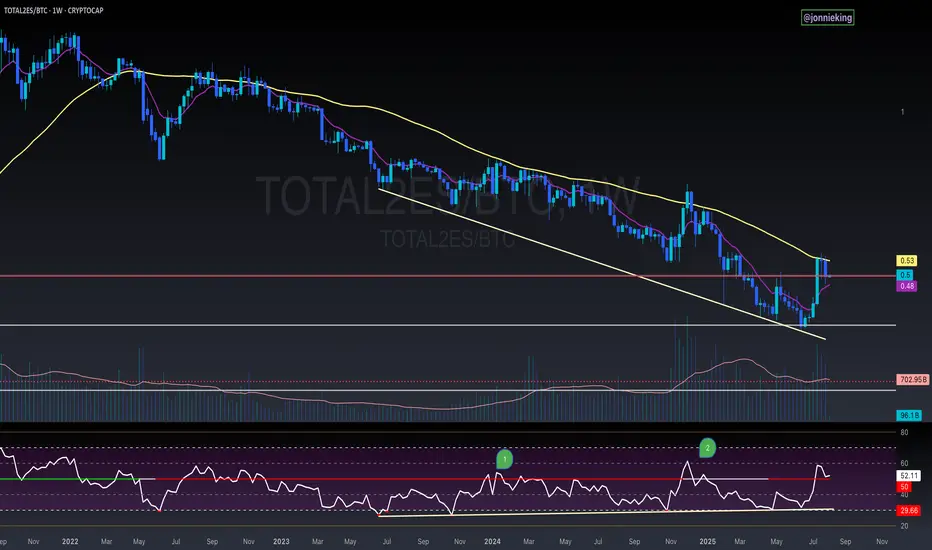
$TOTAL2ES/BTC Weekly Close AlertA bit concerning seeing CRYPTOCAP:TOTAL2 get rejected at the 50WMA and close below it for the 3rd consecutive week against CRYPTOCAP:BTC
Also flirting below the neckline breakout.
PA is still above the EMA9, which needs to hold to keep momentum.
Saving grace is the bullish divergence on the RSI.
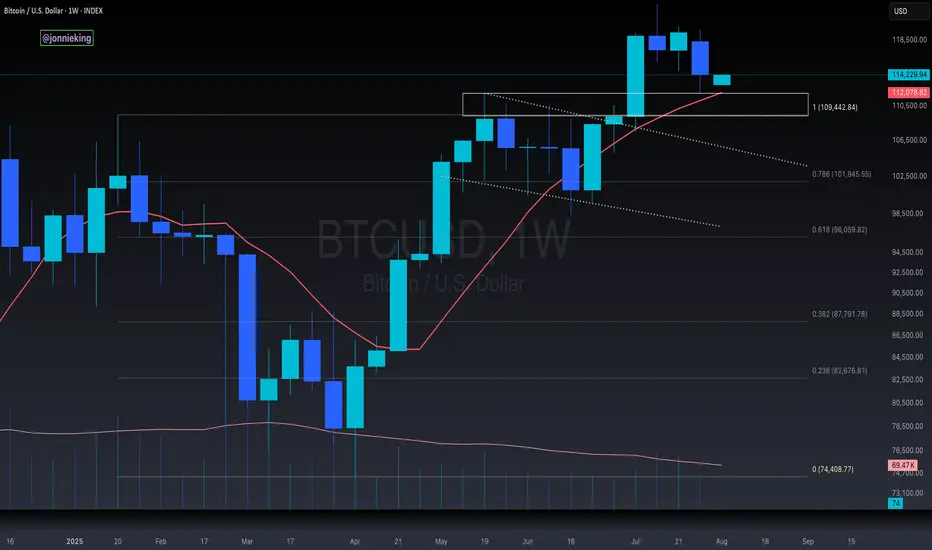
$BTC Weekly Close Keeps Bullish StructureCRYPTOCAP:BTC looking hopeful closing the Week just above previous ATH POI and above the SMA9.
PA needs to stay above this to keep bullish momentum.
the CME Gap was filled, which was the main objective on this correction.
Let’s see how the market reacts on judgement day tomorrow 🤓
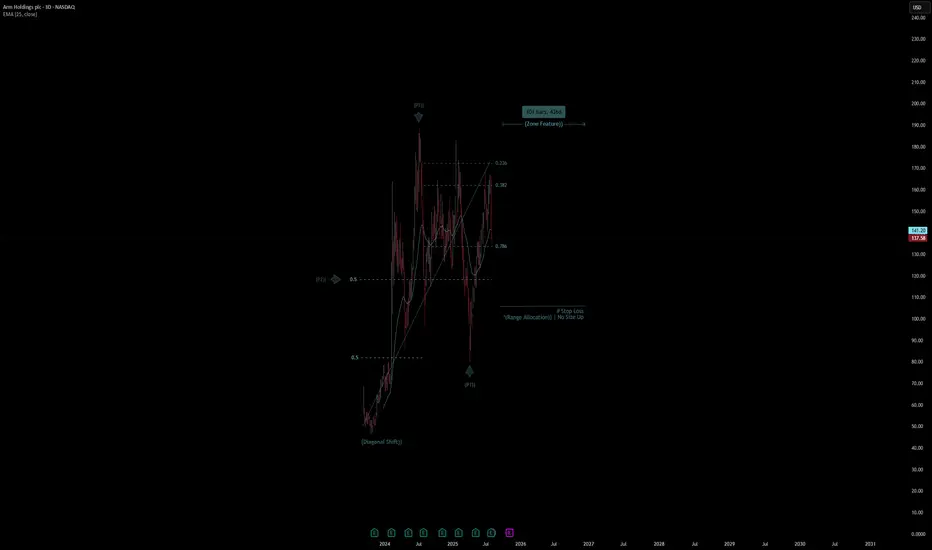
Arm Holdings plc Quote | Chart & Forecast SummaryKey Indicators On Trade Set Up In General
1. Push Set Up
2. Range Set Up
3. Break & Retest Set Up
Notes On Session
# Arm Holdings plc Quote
- Double Formation
* (Diagonal Shift)) At 50.00 USD| Subdivision 1
* (Zone Feature)) | Completed Survey
* 118 bars, 509d | Date Range Method - *(Downtrend Argument))
- Triple Formation
* (P1)) / (P2)) & (P3)) | Subdivision 2
* 3D Time Frame | Trend Settings Condition | Subdivision 3
- (Hypothesis On Entry Bias)) | Regular Settings
* Stop Loss Feature Varies Regarding To Main Entry And Can Occur Unevenly
- Position On A 1.5RR
* Stop Loss At 110.00 USD
* Entry At 138.00 USD
* Take Profit At 180.00 USD
* (Uptrend Argument)) & No Pattern Confirmation
- Continuation Pattern | Not Valid
- Reversal Pattern | Not Valid
* Ongoing Entry & (Neutral Area))
Active Sessions On Relevant Range & Elemented Probabilities;
European-Session(Upwards) - East Coast-Session(Downwards) - Asian-Session(Ranging)
Conclusion | Trade Plan Execution & Risk Management On Demand;
Overall Consensus | Buy
3H to New HighsEverything seems to be painting a picture from the 3 HR time frame, in the next 9 hours we can be seeing some potential moves to the upsides. The play from my weekly outlook is still in play, and this 3HR TF is solidifying it. Happy Holding Zebecs!

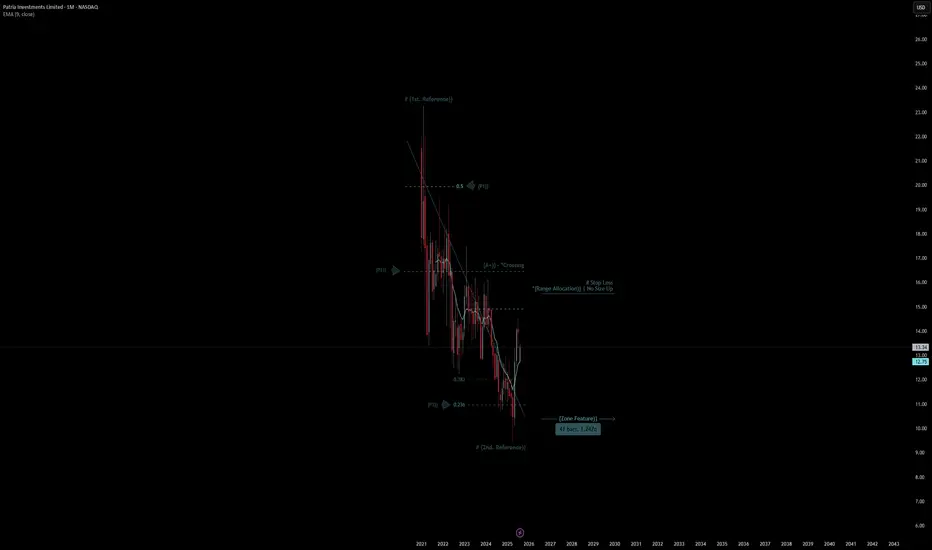
Patria Investments Limited Quote | Chart & Forecast SummaryKey Indicators On Trade Set Up In General
1. Push Set Up
2. Range Set Up
3. Break & Retest Set Up
Notes On Session
# Patria Investments Limited Quote
- Double Formation
* # (1st. Reference)) At 23.00 USD| Subdivision 1
* (A+)) - *Crossing | Completed Survey
* 41 bars, 1.247d | Date Range Method - *(Downtrend Argument))
- Triple Formation
* (P1)) / (P2)) & (P3)) | Subdivision 2
* Monthly Time Frame | Trend Settings Condition | Subdivision 3
- (Hypothesis On Entry Bias)) | Regular Settings
* Stop Loss Feature Varies Regarding To Main Entry And Can Occur Unevenly
- Position On A 1.5RR
* Stop Loss At 15.00 USD
* Entry At 13.00 USD
* Take Profit At 10.00 USD
* (Downtrend Argument)) & No Pattern Confirmation
- Continuation Pattern | Not Valid
- Reversal Pattern | Not Valid
* Ongoing Entry & (Neutral Area))
Active Sessions On Relevant Range & Elemented Probabilities;
European-Session(Upwards) - East Coast-Session(Downwards) - Asian-Session(Ranging)
Conclusion | Trade Plan Execution & Risk Management On Demand;
Overall Consensus | Sell