AXISBANK – Classic Cup & Handle Breakout | Targeting 1280 & 1320🧠 Technical Analysis:
AXISBANK has formed a textbook Cup and Handle pattern over the past few months. The breakout above the resistance zone around ₹1199 marks a potential start of a new bullish rally.
🔹 Cup Formation: Rounded bottom between Dec 2024 - Apr 2025
🔹 Handle Formation: Consolidation range in Oct - Dec 2024
🔹 Breakout Candle: Strong bullish candle with increasing volume
🔹 200 EMA: Price is now well above the 200 EMA, adding to the bullish bias
🎯 Targets:
Target 1: ₹1280
Target 2: ₹1320
These levels are based on the measured move technique and previous swing highs.
🛡️ Support:
Immediate support lies around the breakout zone near ₹1199
Next strong support is near ₹1090 (200 EMA)
📊 Volume:
Breakout accompanied by a surge in volume confirms buyer interest and validates the pattern.
📌 Conclusion:
AXISBANK is showing strong bullish momentum with a confirmed breakout from a well-defined Cup and Handle formation. As long as it sustains above ₹1199, the stock could potentially rally toward ₹1280 and ₹1320 in the coming sessions.
📅 Keep it on your radar for bullish continuation setups!
Disclaimer:
This analysis is shared purely for educational and informational purposes and should not be considered as financial advice or a recommendation to buy or sell any security. Always do your own research and consult with a qualified financial advisor before making any investment decisions. Trading and investing involve risk.
Moving Averages

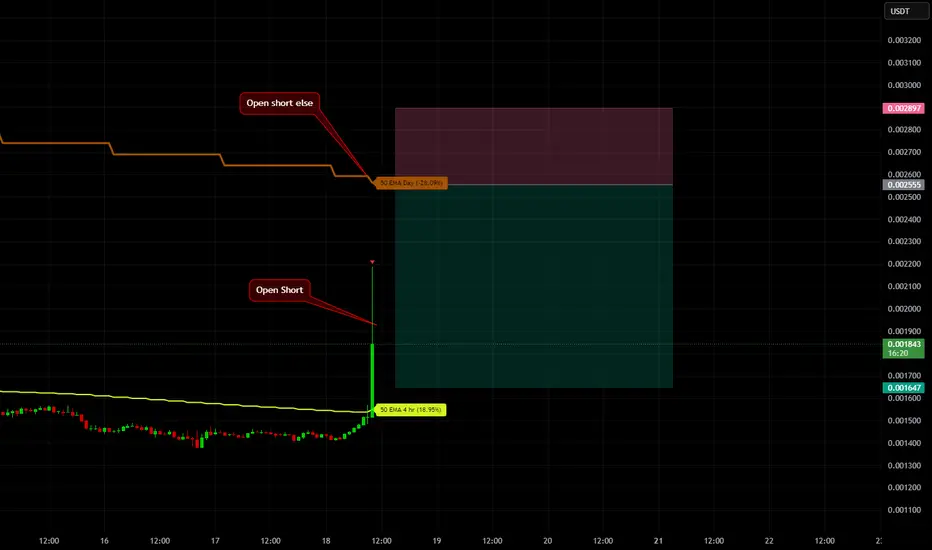
MEMEUSDT ShortMEMEUSDT had a strong breakout from the 4H EMA50 — up 23%! This setup is perfect for a short without a stop, using scaling in.
There’s a chance price might reach the daily EMA50 — if it does, I’ll add more to the short from there. The target will be adjusted based on how the 4H EMA50 moves.
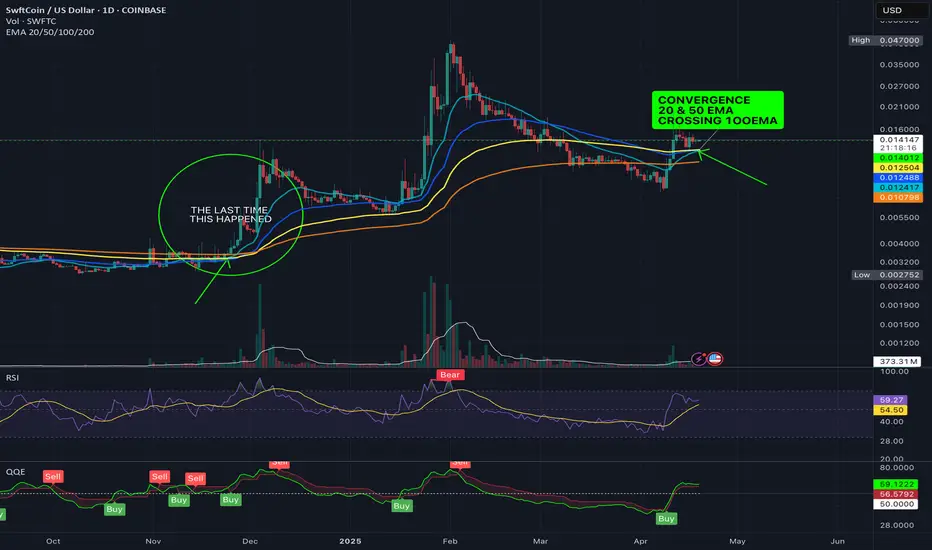
SWFT Convergence - 20/50 EMA Crossing 100 EMAIm not saying that its something, but it sure as hell isnt nothing. The last time this happened the price rose significantly. Thsi should happen over the next 24-48 hours so, we'll see.
Not financial advice
Celsius Holdings Outperforms Market with Strong YTD GainsCelsius Holdings Inc. (CELH) continues to attract significant investor attention, closing at $37.24 on April 17, up $0.58 (1.58%). The functional energy drink maker has delivered impressive year-to-date returns of 41.38%, substantially outpacing the S&P 500's 10.18% gain during the same period.
For the current quarter, analysts expect earnings of $0.20 per share, representing a 25.9% year-over-year decline. However, consensus estimates have improved dramatically with a 32.8% upward revision over the last 30 days. The full-year outlook appears more favorable, with projected earnings of $0.99 per share indicating a 41.4% annual increase, followed by 15.1% growth to $1.14 per share next fiscal year.
Current quarter sales are expected to decline slightly to $345.26 million (-2.9%), but full-year revenue estimates show robust growth of 55.3% to $2.1 billion, followed by 19.4% growth next fiscal year. Celsius has demonstrated strong execution recently, beating earnings estimates in three of the last four quarters.
Technical Analysis
Technically, the chart shows a strong recovery from its $21.10 low. Price has recently broken above the 50-day moving average but remains below the 200-day moving average, suggesting improving momentum within a longer-term downtrend. Key resistance appears around $47-49, marked by a horizontal level that previously acted as support.
Volume has increased during recent price advances, adding credibility to the current uptrend. The next major challenge will be overcoming the $49 resistance zone before potentially continuing toward higher targets as indicated in the chart projection. If price faces rejection, it is likely to drop back to support at around $25.

Keurig Dr Pepper Holds Steady Ahead of Quarterly EarningsKeurig Dr Pepper (KDP) shares have shown resilience in recent weeks, climbing 5.9% over the past month while the broader S&P 500 declined by 6.9%. The beverage giant currently trades at $35.40, up $0.29 (0.83%), with 13.96 million shares traded. Analysts maintain a consensus "Hold" rating as KDP approaches its upcoming earnings announcement.
Wall Street expects the company to report earnings of $0.38 per share, unchanged from the year-ago quarter, while revenue is projected to reach $3.56 billion, representing a 2.8% year-over-year increase.
The company has seen minor positive revisions to its earnings estimates, with consensus EPS projections increasing by 0.1% over the past 30 days. This modest upward adjustment could signal improving analyst sentiment about KDP's near-term performance.
Breaking down the revenue expectations by segment, analysts forecast U.S. Refreshment Beverages will lead growth at $2.23 billion, up 6.6% year-over-year. Meanwhile, U.S. Coffee is expected to contract slightly to $884.51 million (-2.9%), and International sales may decrease to $448.32 million (-3.4%).
Technical Analysis
From a technical perspective, KDP has established an ascending trend line since reaching a low of $30.12. The stock currently trades above both its 50-day, 100-day and 200-day moving averages, suggesting positive momentum. The chart shows resistance around the $36 level, with support at the trend line near $33.60. Trading volume has increased during recent uptrend, potentially indicating stronger buyer conviction.

BTC: Do not cross the green lineThe green line is the great frontier for Bitcoin. It was its support and now it's the impossible-to-cross resistance. Don't cross it! Wait patiently for the opportunity; it won't come soon. Be patient.

Jesus Coin (JESUS) Price Jumps Over 50% in a Week Jesus Coin (JESUS) has experienced notable price action this week, rising by 52.90% in the past seven days. At the time of writing, the token trades at $0.00000006999. Despite a -7.61% drop in the past 24 hours, the coin maintains momentum, supported by increased attention within its community.
The project holds a market capitalization of approximately $7.19 million, positioning it at rank #1101 in the crypto market. Daily trading volume has declined to $110.11K, showing a 61.50% drop, signaling reduced short-term interest despite recent price movements.
Jesus Coin was created as a decentralized, community-led initiative aimed at promoting generosity and faith-based values in crypto. It brands itself as an “anti-meme coin,” built to counter dishonest projects and scams that have plagued the space.
Unlike typical crypto ventures, Jesus Coin launched without a team allocation and functions entirely through community efforts. Its mission focuses on inspiring generosity and cultural transformation through blockchain.
From a technical perspective, Jesus Coin shows signs of renewed bullish activity after a prolonged consolidation phase. The 3-day candlestick chart highlights a recent push attempt. JESUS has also moved above the 50-day moving average (0.00000006201), suggesting short-term bullish momentum. However, it remains below the 200-day moving average, indicating that long-term sentiment has not yet flipped.
The token’s trading range remains tight, with historical support near 0.0000000513 and recent highs around 0.000000071. Trading volume remains modest, implying cautious interest from market participants.
With strong community involvement and recent technical signals, Jesus Coin may continue to draw attention. Watch for sustained volume and price movement above resistance for further confirmation of trend direction.

KASUSDT ShortLooks like KASUSDT is wrapping up an ABCDE reversal pattern right on the daily 50EMA — point E seems to be the final touch.
What stands out is how that 50EMA is acting like a brick wall — price got rejected at A, C, and now again at E.
My target’s the support zone marked on the chart.
I’m not setting a tight stop — too easy to get wicked out by some stop-hunting move.
I’ll only cut the trade if we get multiple candle bodies closing clean above the daily 50EMA.

APEUSDT LongAPEUSDT is pressing against the 50 EMA on the 4H chart. An ABCDE reversal pattern has formed based on Elliott Waves — the setup points to a potential long.
No stop-loss set — there’s a chance of a stop-hunt wick to the downside. I’ll exit the trade if multiple candles close below the zone with their bodies, which would invalidate the setup.
Target is marked on the chart.

Franklin Resources Inc Stock Quote | Chart & Forecast SummaryKey Indicators On Trade Set Up In General
1. Push Set Up
2. Range Set up
3. Break & Retest Set Up
Notes On Session
# Franklin Resources Inc Stock Quote
- Double Formation
* (A+ Set Up)) At 25.00 USD | Completed Survey
* Wave Feature + Ongoing Wave (3)) | Subdivision 1
- Triple Formation
* (EMA Settings)) Ending At 18.50 USD | Subdivision 2
* (TP1) | Subdivision 3
* Daily Time Frame | Trend Settings Condition
- (Hypothesis On Entry Bias)) | Logarithmic Settings
- Position On A 1.5RR
* Stop Loss At 18.00 USD
* Entry At 17.00 USD
* Take Profit At 16.00 USD
* (Downtrend Argument)) & No Pattern Confirmation
* Ongoing Entry & (Neutral Area))
Active Sessions On Relevant Range & Elemented Probabilities;
European-Session(Upwards) - East Coast-Session(Downwards) - Asian-Session(Ranging)
Conclusion | Trade Plan Execution & Risk Management On Demand;
Overall Consensus | Sell

Honeywell Stock Quote | Chart & Forecast SummaryKey Indicators On Trade Set Up In General
1. Push Set Up
2. Range Set up
3. Break & Retest Set Up
Notes On Session
# Honeywell Stock Quote
- Double Formation
* (Reversal Argument)) | Completed Survey
* ((No Trade)) At 175.00 USD | Subdivision 1
- Triple Formation
* (EMA Settings)) Ending At 205.00 USD | Subdivision 2
* (TP1) | Subdivision 3
* Daily Time Frame | Trend Settings Condition
- (Hypothesis On Entry Bias)) | Indexed To 100
- Position On A 1.5RR
* Stop Loss At 96.00 USD
* Entry At 93.00 USD
* Take Profit At 88.00 USD
* (Downtrend Argument)) & Pattern Confirmation (Flag Structure))
* Ongoing Entry & (Neutral Area))
Active Sessions On Relevant Range & Elemented Probabilities;
European-Session(Upwards) - East Coast-Session(Downwards) - Asian-Session(Ranging)
Conclusion | Trade Plan Execution & Risk Management On Demand;
Overall Consensus | Sell

ACHUSDT ShortThe ACHUSDT ticker has sharply deviated from both the 4-hour and daily EMA50 levels without undergoing a retest. I anticipate a price correction towards these EMAs within the next few days. Targets are marked on the chart.

ARKMUSDT ShortARKMUSDT has pressed up against the 50 EMA on the 4H chart. An ABCDE reversal pattern based on Elliott Waves has formed — all lining up for a short.
No stop-loss set — there’s a chance of a stop-hunt wick to the upside. I’ll exit the trade only if several candles close above the zone with their bodies — in that case, the setup is invalidated.
Short targets are marked on the chart.

Cigna Corporation Stock Quote | Chart & Forecast SummaryKey Indicators On Trade Set Up In General
1. Push Set Up
2. Range Set up
3. Break & Retest Set Up
Notes On Session
# Cigna Corporation Stock Quote
- Double Formation
* (Cup & Handle Structure)) | Completed Survey
* ((No Trade)) & Invalid Wave Structure | Subdivision 1
- Triple Formation
* (EMA Settings)) Ending At 315.00 USD | Subdivision 2
* (TP1) | Subdivision 3
* Daily Time Frame | Trend Settings Condition
- (Hypothesis On Entry Bias)) | Indexed To 100
- Position On A 1.5RR
* Stop Loss At 95.00 USD
* Entry At 93.00 USD
* Take Profit At 102.00 USD
* (Uptrend Argument)) & Pattern Confirmation
* Ongoing Entry & (Neutral Area))
Active Sessions On Relevant Range & Elemented Probabilities;
European-Session(Upwards) - East Coast-Session(Downwards) - Asian-Session(Ranging)
Conclusion | Trade Plan Execution & Risk Management On Demand;
Overall Consensus | Buy

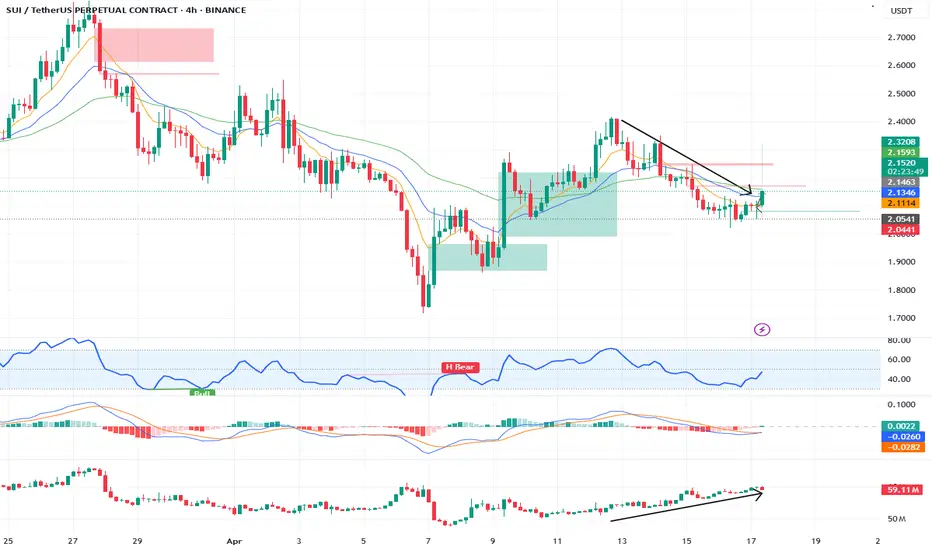
Long setup on SUISetting up long for SUI.
Using 4H time frame.
You can see OI increasing and Price decreasing which is divergence.
Nifty important FIbonacci levels from Previous year closeNIfty important FIbonacci levels from previous year close.
Todays closing was above previous year close.
Previously failed to break previous year close. Lets see what happens.

Is GBPAUD Finally Ready to Drop?Price is currently struggling to break through a key resistance area. That’s not a problem – I’m not looking to catch the entire move, I only need a clean 1:3 RR and potentially the completion of the Asia range.
🔻 Bias: Bearish
On the 4H chart, I’ve identified the 50 EMA as a possible point of rejection, and it lines up perfectly with a 15m POI (Orderblock).
Since the Asia session opened higher, this creates a solid intraday short opportunity targeting the unfilled Asian range.
✅ I’ve marked two potential zones where price could react. If I get clean bearish price action in either zone – such as a BOS on the 1m or strong rejection patterns – I’ll look to execute the short.
Patience until the setup aligns. Let's see how it plays out. 🔍💯

EURGBP Flashes Two Bearish Technical Signals Ahead of LagardeEURGBP is giving negative technical signals ahead of the Lagarde's press conferance. After Trump announced new tariffs, the euro surprisingly gained against the pound. The U.S. imposed tariffs twice as large on the EU compared to the UK, with a minimum of 10% on UK goods. Despite this, the pound weakened more than expected. However, this move might prove to be temporary.
The real focus of ECB will be on the outlook. Recent economic data, combined with the added pressure from tariffs, may push the ECB toward further rate cuts later this year.
President Lagarde has been cautious for some time, offering few forward-looking signals. Today, markets will be closely watching for any hint of future easing. If Lagarde sounds more dovish than expected, the euro could come under renewed bearish pressure.
EURGBP has been forming a head and shoulders-like pattern since the start of last week. It may currently be developing the second shoulder, depending on how the price moves today.
A combination of 8–13 hour moving average crosses and RMI sell signals on the 60-minute chart has successfully captured all local tops since April 7. These same signals have appeared again today. If they prove accurate once more, the 0.8525 support level will be key. This level represents the neckline of the potential head and shoulders pattern.
However, if EURGBP moves above 0.8620, the bearish setup would be invalidated.

Fluence Energy, Inc. Stock Quote | Chart & Forecast SummaryKey Indicators On Trade Set Up In General
1. Push Set Up
2. Range Set up
3. Break & Retest Set Up
Notes On Session
# Fluence Energy, Inc. Stock Quote
- Double Formation
* (A+ Set Up)) At 40.00 USD | Completed Survey
* Wave Feature & Ongoing Wave (3)) | Subdivision 1
- Triple Formation
* (EMA Settings)) + Gap Fill | Subdivision 2
* (TP1) | Subdivision 3
* Daily Time Frame | Trend Settings Condition
- (Hypothesis On Entry Bias)) | Logarithmic Settings
- Position On A 1.5RR
* Stop Loss At 5.00 USD
* Entry At 3.50 USD
* Take Profit At 1.00 USD
* (Downtrend Argument)) & Pattern Confirmation
* Ongoing Entry & (Neutral Area))
Active Sessions On Relevant Range & Elemented Probabilities;
European-Session(Upwards) - East Coast-Session(Downwards) - Asian-Session(Ranging)
Conclusion | Trade Plan Execution & Risk Management On Demand;
Overall Consensus | Sell

Worries about BTC Dominance for your Alts? Bitcoin Dominance Is Very Close to a Downtrend – Altcoin Season Is Near
Bitcoin dominance is likely to enter a downtrend soon—because no uptrend lasts forever. This shift may occur within just a few weeks. As you can see in our current Scenario1
, Bitcoin dominance might sweep its previous high and reverse from there. However, if a daily candle closes above the previous high, then we move into Scenario 2.
In Scenario 2 , we look toward the 0.786 Fibonacci level, which is known as a strong retracement zone. Whenever price reaches this level, it typically experiences a significant pullback or even starts a new downtrend. This gives us two strong confluences already.
The third major confluence is that on the weekly timeframe, the RSI (Relative Strength Index) is consistently showing bearish divergence—which is often a clear signal that a reversal is near.
Fourth confluence 21 EMA is getting close on 1W Time frame breaking 21 Ema can trigger a downtrend for BTC dominance.
Don't lose hope.
In short, Bitcoin dominance is close to reversing, and you just need to be a little more patient. The altcoin season you’ve been waiting for is coming soon.
If you’ve made it this far—after so much pain, so many difficulties, and countless moments of doubt—then hold on just a little longer. Success is near, and your patience will soon be rewarded.
Comment if you like my work and free premium updates like this and follow me to save yourself from losses and being on the wrong side.
Your comment motivates me

Can we hold?!Lowe's is currently sitting at a great support area, 200MA on the weekly chart. As noted on the chart, until the price breaks through that resistance, we continue to consolidate. I'd be surprised if price falls further, but anything is possible. The RSI on the weekly and Monthly are getting into oversold territory, so that can add some optimism. There aren't too many abnormal technicals that pop out overall.
I don't get too political, but obviously, the tariffs are playing into this sector. We'll have to keep an eye on that! I like to keep my analysis strictly from a charting perspective.

Do the Bears have it?So far, I'm sure no one is surprised where we are with SPY. From a charting perspective, we are still in a nice, long-term bullish trend. The short term is the issue. SPY is still trending downward, and until we can break through that upper resistance, I am bearish. We are also sitting right between the 100 & 200ma on the weekly chart, so there is still room for da bears. (I still want SPY @ $466, 200MA.) The good news is, price is making good swings, so you can still carve out wins! Stay optimistic!
C.

Chevron (CVX) / US Dollar Quote | Chart & Forecast SummaryKey Indicators On Trade Set Up In General
1. Push Set Up
2. Range Set up
3. Break & Retest Set Up
Notes On Session
# Chevron (CVX) / US Dollar Quote
- Double Formation
* (A+ Set Up)) At 90.00 USD | Completed Survey
* (Flag Structure) | Subdivision 1
- Triple Formation
* ((No Trade)) & Area Of Value | Subdivision 2
* (TP1) | Subdivision 3
* Daily Time Frame | Trend Settings Condition
- (Hypothesis On Entry Bias)) | Logarithmic Settings
- Position On A 1.5RR
* Stop Loss At 125.00 USD
* Entry At 135.00 USD
* Take Profit At 148.00 USD
* (Uptrend Argument)) & Pattern Confirmation
* Ongoing Entry & (Neutral Area))
Active Sessions On Relevant Range & Elemented Probabilities;
European-Session(Upwards) - East Coast-Session(Downwards) - Asian-Session(Ranging)
Conclusion | Trade Plan Execution & Risk Management On Demand;
Overall Consensus | Neutral
