Moving Averages
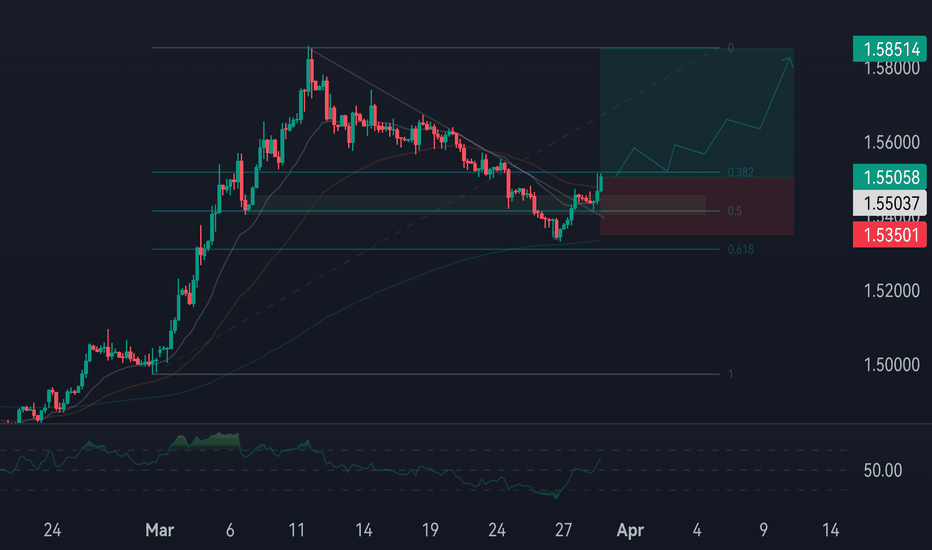
EURCAD Long Bias ! chart shows a potential buy setup after a pullback. Price found support around 1.5350, which lines up with key Fibonacci levels, making it a strong area for a possible bounce. Buyers have stepped in, pushing the price back above 1.5500. The idea here is to target 1.5850 while keeping a stop loss below 1.5350. As long as price stays above 1.5500, the bullish outlook makes sense. But if it drops below 1.5350, the setup could fail, leading to more downside. The overall momentum suggests a good chance of continuation upwards.
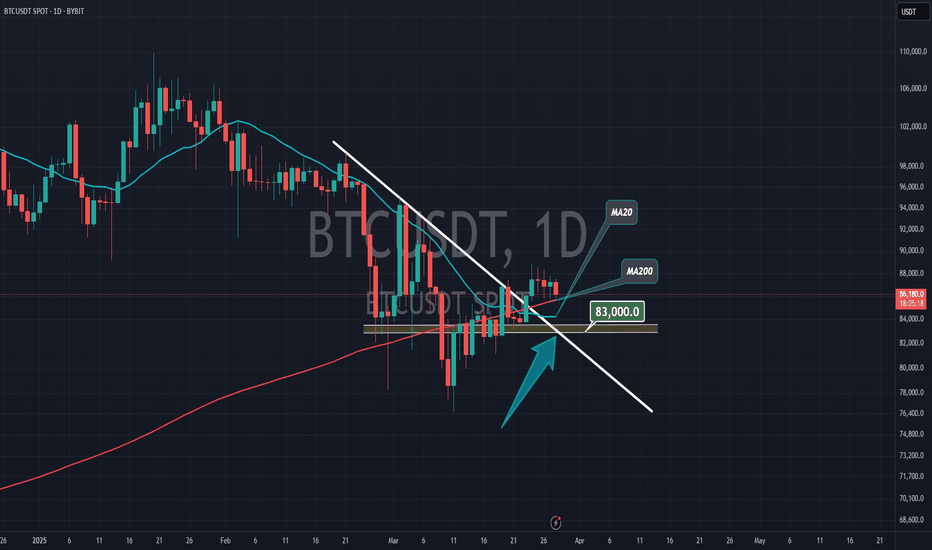
$BTC Death Cross Forming Inverse H & SAs expected, CRYPTOCAP:BTC is rolling over, hopefully to form that right shoulder for the inverse h & s patter to confirm the next leg up.
This dumped is fueled by the impending death cross, which historically marks big reversals, since the cross is already priced in.
ACH/USDT - Potential Bounce Incoming 30%+ Gains PossibleI'm analyzing the ACH/USDT 4-hour chart and spotting signs of a potential rebound. Here’s what I’m seeing:
✅ Support Zone: Price is testing a key support level around $0.02119, which has held strong in the past. The market appears to be accumulating in this area.
✅ EMA Crossovers: The chart shows a bearish crossover between the 12 EMA and 20 EMA, but watch for a bullish reversal as price approaches this support. Potential for a rebound if the EMAs cross back to the upside.
✅ Volume Delta Analysis: There's a notable increase in volume with a Delta Volume of 28.42%, indicating heightened interest at these levels.
✅ Reversal Probability: The chart shows an impressive 85.6% reversal probability, suggesting a strong chance of a bullish move soon.
✅ Targets: Looking for a potential 30%+ bounce towards key resistance levels at $0.02559, $0.02657, and $0.02845.
📉 Risk Management: Setting a stop loss slightly below the $0.02119 support level to minimize risk in case of further downside.
📈 If support holds and momentum shifts, a strong move upward could follow. Stay vigilant!
🚨 Not financial advice. Always do your own research.
American Electric Stock Quote | Chart & Forecast SummaryKey Indicators On Trade Set Up In General
1. Push Set Up
2. Range Set up
3. Break & Retest Set Up
Notes On Session
# American Electric Stock Quote
- Double Formation
* ABC Wave Feature | Completed Survey
* EMA Settings | Range & Retest Area | Subdivision 1
- Triple Formation
* 012345 Wave Set Up | Long Set Up | Subdivision 2
* (TP1) | Subdivision 3
* Daily Time Frame | Trend Settings Condition
- (Hypothesis On Entry Bias)) | Logarithmic Settings
- Position On A 1.5RR
* Stop Loss At 102.00 USD
* Entry At 107.00 USD
* Take Profit At 114.00 USD
* (Uptrend Argument)) & No Pattern Confirmation
* Ongoing Entry & (Neutral Area))
Active Sessions On Relevant Range & Elemented Probabilities;
European-Session(Upwards) - East Coast-Session(Downwards) - Asian-Session(Ranging)
Conclusion | Trade Plan Execution & Risk Management On Demand;
Overall Consensus | Buy
My market direction guide with extended-hour. Work best for >+1 day till expiration contract. (SWING)
Personal Interpretation of Indicator:
5MA=yellow(scalp trend)
20MA=orange(pullback of a larger timeframe’s 5MA trend)
I read how previous candles are behaving around 1hr 20MA and use pullback test rejection for direction signal. (Trade Planning, knowing the MA are align with larger timeframes like 4hr or day)
Then, I use 15min 20MA pullback test with wick rejection to find cheaper price entry.
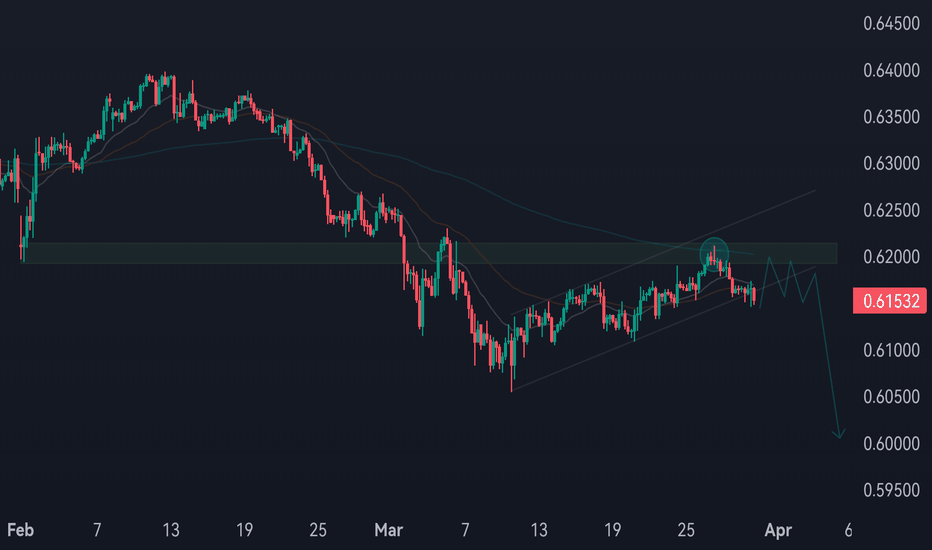
CADCHF Short Bias ! The pair attempted to break above the 0.6200 resistance zone but failed, forming a rejection. This suggests potential bearish momentum ahead.
Market Structure: Still bearish overall, despite a short-term ascending channel.
Bearish Scenario: If price respects the 0.6200 resistance and breaks below the ascending channel, it could head towards 0.6000 as the next major support.
Confirmation Factors:
Price rejection at resistance.
Moving averages acting as resistance.
Possible breakdown of the ascending channel.
USDCHF Short Bias ! The pair is in a clear downtrend, trading below the moving averages and facing strong resistance around 0.8859. The price attempted to break this level but failed, reinforcing the likelihood of continued downside movement.
Expected Scenario: Further bearish continuation after this rejection, targeting 0.8660 as a potential support zone.
Bearish Confirmation Factors:
Price staying below key resistance.
Moving averages acting as dynamic resistance.
Overall bearish market structure.
BTC/USDT: Strategic Entry Points for a Potential Bullish ReversaAnalysis of Key Positions in the BTC/USDT Chart
The chart provided shows a 30-minute timeframe for Bitcoin (BTC) against Tether (USDT) on Binance. The chart includes two labeled positions ("Position 1" and "Position 2") that highlight key areas of interest for traders. Below is a detailed breakdown of these positions:
---
1. Position 1
- Location: Near the horizontal green support line, around the $83,600 level.
- Significance:
- Support Zone: This area acts as a strong support level, where the price has previously bounced back after testing it. The horizontal green line indicates that this level has held firm multiple times, suggesting it is a critical zone for buyers.
- Potential Entry Point: Traders can consider entering long positions near this support level if they believe the price will reverse higher. This is a classic "buy the dip" strategy.
- Stop-Loss Placement: To manage risk, traders should place stop-loss orders slightly below this support level (e.g., $83,200–$83,400). If the price breaks below this level, it could signal a continuation of the downtrend.
2. Position 2
- Location: Near the descending blue trendline, around the $85,000–$86,000 range.
- Significance:
- Resistance Zone: The blue trendline acts as dynamic resistance, and the price has been bouncing off this level multiple times. A breakout above this trendline would be a strong bullish signal, indicating that buyers have overcome short-term selling pressure.
- Potential Entry Point: Traders can consider entering long positions after a confirmed breakout above the trendline. A breakout is typically confirmed when the price closes above the trendline on a candlestick.
- Stop-Loss Placement: For safety, traders should place stop-loss orders just below the trendline (e.g., $84,800–$85,000). This ensures that the trade is exited if the breakout fails and the price reverses lower.
---
Comparison Between Position 1 and Position 2
- Position 1 (Near Support):
- Risk Profile: Lower risk, as it is closer to a well-defined support level.
- Reward Potential: Moderate, as the upside target would likely be the next resistance level (e.g., the trendline or Fibonacci retracement levels).
- Strategy: Suitable for traders who want to enter at a cheaper price but are willing to take on some downside risk.
- Position 2 (Near Trendline Breakout):
- Risk Profile: Higher risk, as it requires waiting for a confirmed breakout.
- Reward Potential: Higher, as a successful breakout could lead to a stronger upward move.
- Strategy: Suitable for traders who prefer confirmation before entering long positions.
---
Actionable Insights
1. For Short-Term Traders:
- Entry Strategy: Look for pullbacks to the $83,600 support level to enter long positions. Use tight stop-loss orders below the support to manage risk.
- Exit Strategy: Set profit targets based on Fibonacci retracement levels or previous highs (e.g., $85,000–$86,000).
2. For Long-Term Traders:
- Entry Strategy: Wait for a confirmed breakout above the blue trendline ($85,000–$86,000) before entering long positions. This ensures that the bullish trend is sustainable.
- Exit Strategy: Use trailing stops or take profits at key resistance levels (e.g., $87,000–$88,000).
---
Risk Management
- Always use stop-loss orders to protect against unexpected price movements.
- Consider using position sizing to limit exposure to market volatility.
- Monitor volume and momentum indicators to confirm the strength of any breakout or reversal.
---
Conclusion
The two positions highlighted in the chart provide distinct trading opportunities:
1. Position 1 (Near Support): A potential entry point for aggressive traders looking to buy the dip near $83,600.
2. Position 2 (Near Trendline Breakout): A safer entry point for traders who prefer confirmation before entering long positions near $85,000–$86,000.
By combining these positions with proper risk management and technical analysis, traders can increase their chances of success in the BTC/USDT market.
---
Final Answer: The two positions indicate key trading opportunities:
- Position 1: Near the $83,600 support level, suitable for traders willing to buy the dip.
- Position 2: Near the $85,000–$86,000 trendline breakout, ideal for traders seeking confirmation before entering long positions.
APEUSDT: Will This Major Resistance Trigger a Sharp Rejection?Yello Paradisers, have you spotted what’s brewing on APEUSDT? We’re sitting at a critical zone—one that could either trigger a steep drop or trap late shorts before a breakout. Here's why this level demands your full attention.
💎APEUSDT is showing strong bearish potential, currently trading inside a rising wedge pattern accompanied by bearish divergence. What's even more crucial is that this price action is unfolding right at a key resistance zone, reinforced by both the 0.618 Fibonacci level and the 200 EMA. This confluence of technical factors significantly increases the probability of a bearish rejection from here.
💎If APEUSDT consolidates around this level and begins forming clear bearish structures—such as an M-pattern, a bearish CHoCH (Change of Character), a Head & Shoulders, or even an Inverse Cup & Handle—the bearish case strengthens further. This would also allow for a tighter risk setup, improving the risk-to-reward ratio for traders who are patient and precise.
💎On the flip side, if the price breaks and closes decisively above the invalidation level, this will invalidate the bearish setup entirely. In that scenario, the smart move would be to wait for a new structure or a clean retest before making any trading decisions.
🎖This is the only way you will make it far in your crypto trading journey. Be a professional—stick to your plan, reduce your risk, and never chase the market. Timing and discipline are what separate consistent traders from the rest. Stay sharp, Paradisers.
MyCryptoParadise
iFeel the success🌴
Free Report #2:The SImple Guide To Trading Stock OptionsThis is the 3 Step Strategy
Am going to show you in this video
to help you with trading stock options.
Watch it to learn more.
#1-Wait for Momentum/Rate Of Change/ Bull Power indicator
#2-Wait for a candlestick chart pattern confirmation
#3-Use the Rocket Booster Strategy
If you want to learn more check out the resources and rocket boost this content
Disclaimer: Trading is risky please learn
risk management and profit taking strategies.
Also feel free to use a simulation trading account.
Bitcoin’s Next Move – Another Attack to Heavy Resistance Zone!!!Bitcoin ( BINANCE:BTCUSDT ) was successful in three moves , as I expected in my previous post . I still think Bitcoin will NOT stop trying to break the Heavy Resistance zone($93,300_$89,200) .
Bitcoin is moving near the Support zone($87,100_$85,800) and Cumulative Long Liquidation Leverage($86,376_$85,411) .
Regarding the Elliott Wave theory , Bitcoin appears to be completing microwave C of the main wave 4 . The structure of the main wave 4 is a Zigzag Correction(ABC/5-3-5) .
If we look at the USDT.D% ( CRYPTOCAP:USDT.D ) chart on the 4-hour time frame , USDT.D% is pulling back to the Uptrend line and is currently in the Resistance zone(5.30%-5.15%) . There is a possibility of completing the Bearish Flag Pattern .👇
I expect Bitcoin to rise again in the coming hours and attack the Heavy Resistance zone($93,300_$89,200) , Potential Reversal Zone(PRZ) , Resistance lines , Monthly Pivot Point , and 50_SMA(Daily) .
Note: If Bitcoin falls below $85,400, we can expect more dumps.
Market Developments:
GameStop announced BTC adoption as a treasury asset, signaling growing corporate interest.
Trump Media partnered with Crypto to launch crypto ETFs, adding institutional momentum.
Please respect each other's ideas and express them politely if you agree or disagree.
Bitcoin Analyze (BTCUSDT), 1-hour time frame.
Be sure to follow the updated ideas.
Do not forget to put a Stop loss for your positions (For every position you want to open).
Please follow your strategy and updates; this is just my Idea, and I will gladly see your ideas in this post.
Please do not forget the ✅' like '✅ button 🙏😊 & Share it with your friends; thanks, and Trade safe.
Super Micro Trade IdeaA risky trade, but with great risk comes great reward. We are at the trendline touching for the third time, and we have pivot off it in the pre market. A company who has demonstrated strong growth potential and the AI bubble starting to come together this will be a stock I will hold onto for sometime.
GBPAUD what's next ! GBPAUD is trading inside an ascending parallel channel, the price action shows a neutral short term trend, but the major trend is bullish, price is clearly trading above the 200 EMA, my setup is wait for price to touch resistance line of the channel to catch the next correction, let me know in the comments bellow what do you think for this pair, your thoughts is important, if you like my idea don't forget to boost it.
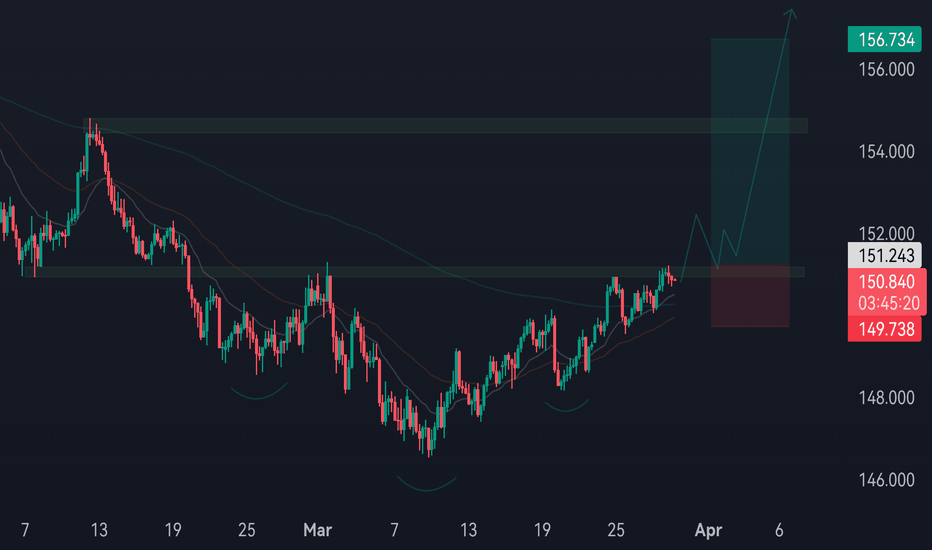
USDJPY Long BiasThe USDJPY pair on the 4H timeframe is forming a bullish structure, showing signs of continuation to the upside. The price is currently trading above key moving averages and consolidating near a resistance-turned-support zone, indicating potential bullish momentum.
Additionally, the formation resembles an inverse head and shoulders pattern, a strong bullish reversal signal. A successful break and retest of the 151.200 zone could confirm further upside movement, with the next key target around 156.700. However, failure to hold above the support zone may lead to a deeper retracement before resuming the uptrend.


