Moving Averages

FART/USDTSEED_WANDERIN_JIMZIP900:FART Cup and Handle on 1D chart! 🔥
✅ The cup is nicely rounded - a sign of bullish accumulation.
✅ Neckline around 0.5561-0.6119 (V-WVWAP) - price is hitting resistance here.
✅ Volume is increasing during the breakout attempt - which is a positive signal.
✅ Possible "eye" - price may correct back to support before further growth.
Targets:
🔹 Cup height measurement: Bottom around 0.3194, neckline 0.5561, gap ~0.2367.
🔹 Target level: 0.5561 + 0.2367 = ~0.7928 (possible bull target on patterning confirmation).
🔹 Fib levels may help - I see first resistance around 0.6176.
How to play it?
📌 Ideal entry: after a pullback to neckline (retest) or during a confirmed breakout with volume.
📌 Stop-loss: Below the last low of the neckline or below the neckline if it becomes support.
📌 Confirmation.
Overall, the pattern looks very bullish, but the reaction to 0.5561-0.6119 will be important. If it fails there, the ears may go lower.

Surgery Partners Inc Stock Quote | Chart & Forecast SummaryKey Indicators On Trade Set Up In General
1. Push Set Up
2. Range Set up
3. Break & Retest Set Up
Notes On Session
# Surgery Partners Inc Stock Quote
- Double Formation
* ((Triangle Structure)) | Completed Survey
* (Uptrend Argument)) | Entry Area | Subdivision 1
- Triple Formation
* 100 EMA & Long Support Or Neutral Area | Subdivision 2
* (TP1) | Subdivision 3
* Daily Time Frame | Trend Settings Condition
- (Hypothesis On Entry Bias)) | Logarithmic
- Position On A 1.5RR
* Stop Loss At 23.00 USD
* Entry At 24.00 USD
* Take Profit At 26.00 USD
* (Uptrend Argument)) & Pattern Confirmation
* Ongoing Entry & (Neutral Area))
Active Sessions On Relevant Range & Elemented Probabilities;
European-Session(Upwards) - East Coast-Session(Downwards) - Asian-Session(Ranging)
Conclusion | Trade Plan Execution & Risk Management On Demand;
Overall Consensus | Buy

LOKAUSDT // head and shoulders formationAlthough there is a reverse head and shoulders formation on the chart, the targets are drawn according to Fibonacci.Let's look for closures above the blue line.

Reddit Has Pulled BackReddit hit a record high early last month. Will some traders see an opportunity in the current pullback?
The first pattern on today’s chart is the bullish gap on October 30 after earnings beat estimates. RDDT approached the low of that session on March 10 and again last week. It bounced both times. That apparent double bottom may suggest new support has been established.
Next, the rebounds occurred around the 200-day simple moving average. Holding that line may suggest an uptrend is in place.
Finally, stochastics have turned up from an oversold condition. The stock also closed above its 8-day exponential moving average. Those patterns are potentially consistent with prices bottoming.
TradeStation has, for decades, advanced the trading industry, providing access to stocks, options and futures. If you're born to trade, we could be for you. See our Overview for more.
Past performance, whether actual or indicated by historical tests of strategies, is no guarantee of future performance or success. There is a possibility that you may sustain a loss equal to or greater than your entire investment regardless of which asset class you trade (equities, options or futures); therefore, you should not invest or risk money that you cannot afford to lose. Online trading is not suitable for all investors. View the document titled Characteristics and Risks of Standardized Options at www.TradeStation.com . Before trading any asset class, customers must read the relevant risk disclosure statements on www.TradeStation.com . System access and trade placement and execution may be delayed or fail due to market volatility and volume, quote delays, system and software errors, Internet traffic, outages and other factors.
Securities and futures trading is offered to self-directed customers by TradeStation Securities, Inc., a broker-dealer registered with the Securities and Exchange Commission and a futures commission merchant licensed with the Commodity Futures Trading Commission). TradeStation Securities is a member of the Financial Industry Regulatory Authority, the National Futures Association, and a number of exchanges.
TradeStation Securities, Inc. and TradeStation Technologies, Inc. are each wholly owned subsidiaries of TradeStation Group, Inc., both operating, and providing products and services, under the TradeStation brand and trademark. When applying for, or purchasing, accounts, subscriptions, products and services, it is important that you know which company you will be dealing with. Visit www.TradeStation.com for further important information explaining what this means.

$SPY Marcg 25, 2025AMEX:SPY Marcg 25, 2025
15 Minutes.
No trade for me yesterday as gap up and had no chance to enter.
For the rise 561.48 to 575.17 i am expecting a retrace to 566-568 levels as too far away from movoing averages.
On 60-minute time frame for the fall 597.37 to 549.68 4SPY has retraced between .5 to .618 levels.
So, at the moment I expect upside to be capped at 579-580 levels being .618 levels.
So, I will short around that levels or buy around 569 levels for the day.

EURUSD bearish scenarioEURUSD is in retreat after resistance in the 1.09500 zone. We are currently seeing a test of 1.08000 with pressure to continue on the bearish side. Around 1.07000, the pair will have a chance to look for support in the EMA200 moving average. If that is not enough, we continue down to the 1.05000-1.06000 support zone.

XAUUSDXAUUSD is making power moves to the heavens I believe it’s still safe to buy atm but we are overdue a correction very soon


PUNDIX // head and shoulders formationAlthough there is a reverse head and shoulders formation on the chart, the targets are drawn according to Fibonacci.Let's look for closures above the blue line.

Bitcoin on Breakdown Alert as Rising Wedge FormsBitcoin traders should be alert to the risk of renewed downside with the price forming a rising wedge pattern that often signals weakness ahead. While it's holding for now, the narrowing range suggests price momentum is fading, increasing the risk of a breakdown.
If the signal proves accurate, traders could establish shorts beneath wedge support with a stop above for protection. The obvious target would be the key 200DMA where the price bounced strongly from on March 11.
RSI (14) and MACD are both grinding higher, reinforcing the need to see a bearish price signal first before considering the trade.
Good luck!
DS

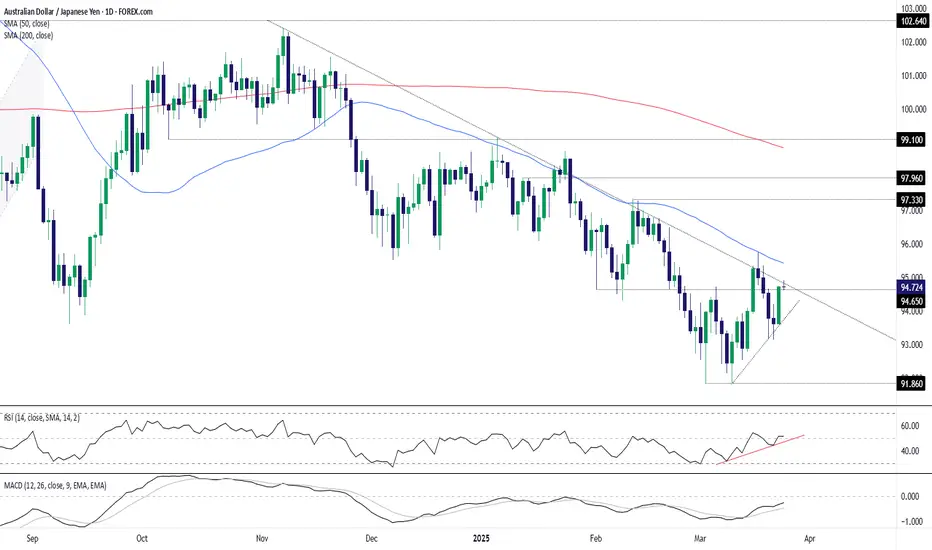
AUD/JPY Bulls Take Aim at Key Downtrend ResistanceDowntrend resistance that has thwarted AUD/JPY bulls since November is under attack on Tuesday following the completion of a three-candle morning star pattern. The bullish signal increases the probability of a retest of the equally formidable 50-day moving average, especially with momentum indicators like RSI (14) and MACD skewing higher.
A decisive break of the downtrend creates a setup where longs could be established above with a stop beneath for protection. The 50-day moving average is the key hurdle for bulls to overcome, with a break of that opening the path for a run towards 96.00 or even the February high of 97.33. Should the move fail at the 50DMA, the trade could be nixed or even reversed.
If the price fails to break the downtrend, the bullish setup would be invalidated.
Good luck!
DS
XAUUSD long biasit is a shiny year for gold so far, it kept reaching new all time highs since Trump declare tarrifs on canada, Mexico and china, that causes big demand on gold admit world war trade fears, we have also the geopolitical side while Israel resumes war on Palestine after months, my setup is wait for a pullback on last structure zone confirmed by Fibo, then it would be a good entry for a long run

GBPNZD long Biasprice is on an uptrend, after testing last resistance zone with 50% Fibonacci level price has confirmed my scenario to go long after break and retest a minor structure, entry would've been more precise on the 200 moving average touch, but that was missed and price give me another good sniper entry after retest, and I expect bullish run

BTC Trendline BreakoutBINANCE:BTCUSDT.P is breaking a key trendline with more then 3 touches, signaling a potential strong move! The price is also trading above the 200 MA, adding bullish confirmation.
💡 What to watch for:
✅ Wait for the trendline to flip into support on the 4H or 1H timeframe before entering.
✅ Be cautious—big players can trigger quick reversals!
✅ ETF markets won’t open until 9:30 AM UTC-4 (New York time) tomorrow, so expect volatility.

BTC IMF Tracking, Liquidation Frenzy, and Market PredictionsBitcoin's recent price action has been a rollercoaster, marked by significant gains, dramatic liquidations, and a confluence of macroeconomic factors that are shaping its trajectory. From the International Monetary Fund (IMF) officially tracking Bitcoin in cross-border finance to speculative predictions of a potential $87,000 surge, the cryptocurrency remains a focal point of intense market scrutiny.
One of the most noteworthy developments is the IMF's increasing recognition of Bitcoin's role in global finance. While the IMF previously issued warnings to El Salvador regarding its Bitcoin adoption, its decision to now track Bitcoin in cross-border financial flows signals a tacit acknowledgment of the cryptocurrency's growing significance. This shift reflects a broader trend of institutions grappling with the reality of digital assets, forcing them to incorporate these assets into their analytical frameworks.
Simultaneously, the Bitcoin market has witnessed a surge towards the $87,000 mark, triggering a wave of short liquidations. This phenomenon occurs when traders who have bet against Bitcoin's price are forced to close their positions at a loss as the price rises. The sheer magnitude of these liquidations, exceeding $110 million in a short period, underscores the volatility and the inherent risks associated with leveraged trading in the cryptocurrency market. The total market liquidations surpassing $200,000 in 24 hours only highlights the dramatic price swings and the vulnerability of short positions.
Adding to the complexity of the market dynamics is the emergence of another CME gap in the $84,000–$85,000 range. Historically, these gaps, which represent discrepancies between trading prices on the Chicago Mercantile Exchange (CME) and other exchanges, tend to be filled, suggesting a potential pullback in Bitcoin's price. This pattern creates a sense of uncertainty, with traders weighing the potential for further gains against the possibility of a corrective downturn.
Furthermore, the surge in Bitcoin open future bets on Binance, with an increase of $600 million, indicates heightened price volatility. Open interest, which measures the total number of outstanding futures contracts, often correlates with price movements. A rise in open interest alongside a price increase typically confirms an uptrend, but it also signals the potential for sharp price swings as more capital enters the market.
Market analysts are divided on Bitcoin's future trajectory. Some predict a "brutal bleed lower," while others foresee a break towards new all-time highs in the second quarter. The critical level to watch is $93,000. If Bitcoin can reclaim this level as support, it would significantly reduce the risk of a fresh collapse. However, until this threshold is breached, the market remains vulnerable to downward pressure.
On a more positive note, the S&P 500's reclamation of its 200-day moving average provides a potential tailwind for Bitcoin. This technical breakout in equities, coupled with similar signals in the cryptocurrency market, could indicate renewed bullish momentum. The correlation between traditional financial markets and Bitcoin has become increasingly apparent, with positive developments in equities often translating to positive sentiment in the crypto space.
Adding another layer to the narrative is the potential softening of the stance on reciprocal tariffs by Donald Trump. Some analysts see this development as a potential catalyst for a Bitcoin bottom. Any relaxation of trade tensions could boost investor confidence and create a more favorable environment for risk assets, including cryptocurrencies.
Finally, the concept of tokenized US gold reserves, as proposed by NYDIG, presents an intriguing long-term prospect for Bitcoin. While gold and Bitcoin are fundamentally different assets, the tokenization of gold on a blockchain could enhance the overall legitimacy and infrastructure of digital assets. This increased institutional acceptance could indirectly benefit Bitcoin by further integrating blockchain technology into mainstream finance.
In conclusion, Bitcoin's current market landscape is characterized by a blend of institutional recognition, intense trading activity, and speculative predictions. The IMF's tracking of Bitcoin in cross-border finance underscores its growing relevance, while the liquidation frenzy and CME gap highlight the inherent volatility of the cryptocurrency market. The interplay of macroeconomic factors, technical indicators, and speculative sentiment will continue to shape Bitcoin's trajectory, making it a fascinating asset to watch in the coming months.

REZUSDT // head and shoulders formationAlthough there is a reverse head and shoulders formation on the chart, the targets are drawn according to Fibonacci.Let's look for closures above the blue line.

C98USDT // reverse head and shoulders formationAlthough there is a reverse head and shoulders formation on the chart, the targets are drawn according to Fibonacci.

KAVAUSD – Midpoint Retest with a Shot at a Daily Higher LowCOINBASE:KAVAUSD / COINBASE:KAVAUSDC
Watching KAVA here on the daily, and it’s at a key decision point that could define the next leg. We’ve got two sets of Fibonacci retracements drawn: the first from the March 2024 high to the August 2024 low, and the second from the August low to the December high. Right now, price is retesting the 50% level of the larger March–August move—aka the midpoint of the macro range—and it's still holding above the 50% retracement of the more recent August–December leg. We’re also sitting right on the 38.2% Fib of that second move, which tends to act as a key area for potential higher lows.
The idea here is simple: I’m playing for a daily higher low. We had a strong move off the December lows, followed by a healthy consolidation, and this is where bulls need to step in. Structure-wise, this is the ideal area for bulls to attempt a defense if the trend is going to continue. EMAs are curling up, and price is still holding above the 12 and 26 EMAs for now, which gives me confidence in a potential bounce.
If the Trade Goes as Planned (Bullish Case)
If buyers step in here and confirm a higher low—ideally somewhere between $0.48 and $0.50—we’d expect a continuation toward the recent high at $0.56. If that level breaks, then $0.64 becomes the next area of interest based on prior price structure and confluence with the upper Fib retracement levels. From there, we could even make a push toward the $0.74 area, where the last major rejection happened in late 2024.
A strong bounce here also sets up a potential inverse head and shoulders structure on the daily if we revisit that neckline around $0.56 again with momentum. In short, a higher low here gives the bulls the setup they need to retake trend control.
If the Trade Fails (Bearish Case)
If price fails to hold the $0.48–$0.50 region and breaks below the August–December 50% Fib level, then we’re likely heading back to the $0.44 zone. That’s where the 200-day SMA is sitting, and it’s also a major pivot from previous support. A loss of that zone opens the door to a full retrace toward $0.39 or even $0.37—last seen during the November-December basing structure.
In that case, the trend would flip neutral at best and would require a fresh base-building phase before bulls could even think about regaining momentum.
TL;DR
Thesis: Playing for a daily higher low above key Fib levels and EMAs.
Bullish Target: Reclaim $0.56 → push toward $0.64–$0.74 if momentum follows through.
Bearish Invalidator: Break below $0.48 = likely revisit of $0.44 or lower.
Not financial advice. Just sharing my thinking as I try to stack confluence and play the levels. Let’s see if this bounce gets legs.

Direxion Midcap Bull 3x | MIDU | Long at $45.67Like my predictions for AMEX:TNA , I believe midcap stocks will likely rise as interest rates are lowered over the next few years (probably a little too early given the looming economic situation). While it may be a bumpy ride and everything truly depends no announcement of an "official" economic recession (by which all stock expectations would change to the negative), there could be significant room to run here before a top - but always stay cautious...
Thus, at $45.67 AMEX:MIDU is in a personal buy zone.
Targets:
$55.00
$75.00 (longer-term if the economic data/news hold up strong)

Potential Downtrend in AlcoaAlcoa has bounced this month, but some traders could think it’s due for a pullback.
The first pattern on today’s chart is the series of lower lows and lower highs since December. The aluminum company has climbed to the top of that falling channel, which may create potential resistance.
Second, prices stalled at the falling 50-day moving average (SMA) in February and seem to be peaking at the same SMA this month.
Speaking of the 50-day SMA, it recently had a “death cross” below the 200-day SMA.
Next, stochastics are dipping from an overbought condition.
Finally, the 52-week low is near $27 and last year’s low is under $25. Combined with the falling channel, those levels may provide space for potential moves to the downside.
TradeStation has, for decades, advanced the trading industry, providing access to stocks, options and futures. If you're born to trade, we could be for you. See our Overview for more.
Past performance, whether actual or indicated by historical tests of strategies, is no guarantee of future performance or success. There is a possibility that you may sustain a loss equal to or greater than your entire investment regardless of which asset class you trade (equities, options or futures); therefore, you should not invest or risk money that you cannot afford to lose. Online trading is not suitable for all investors. View the document titled Characteristics and Risks of Standardized Options at www.TradeStation.com . Before trading any asset class, customers must read the relevant risk disclosure statements on www.TradeStation.com . System access and trade placement and execution may be delayed or fail due to market volatility and volume, quote delays, system and software errors, Internet traffic, outages and other factors.
Securities and futures trading is offered to self-directed customers by TradeStation Securities, Inc., a broker-dealer registered with the Securities and Exchange Commission and a futures commission merchant licensed with the Commodity Futures Trading Commission). TradeStation Securities is a member of the Financial Industry Regulatory Authority, the National Futures Association, and a number of exchanges.
TradeStation Securities, Inc. and TradeStation Technologies, Inc. are each wholly owned subsidiaries of TradeStation Group, Inc., both operating, and providing products and services, under the TradeStation brand and trademark. When applying for, or purchasing, accounts, subscriptions, products and services, it is important that you know which company you will be dealing with. Visit www.TradeStation.com for further important information explaining what this means.

cup and handle pattern may be forming on the weekly chart HOOD"Potential Cup and Handle Pattern on NASDAQ:HOOD
A cup and handle pattern may be forming on the weekly chart of HOOD. The cup formation can be seen from August 2024 to February 2025, with a high point of around $55.00 and a low point of around $14.00. The handle formation started in late February 2025 and is currently ongoing.
Key levels to watch:
Resistance: $50.00
Support: $39.00
A breakout above the resistance level could confirm the pattern, potentially leading to a bullish trend. Keep a close eye on this stock! Weekly Daily and Monthly all look good.
#HOOD #cupandhandle #stockmarket #trading"

Pullback in Palantir Palantir Technologies had a dramatic rally in recent months, and now traders may see an opportunity in its latest pullback.
The first pattern on today’s chart is the 50-day simple moving average (SMA). While many other stocks, like Apple and Microsoft, have plunged below their 200-day SMAs, PLTR ended last week above its 50-day SMA. That may reflect relative strength versus the broader market.
Second, prices made a lower low and higher high on Friday. That kind of outside candle is a potentially bullish reversal pattern.
Third, the software company just had its highest weekly close since February 21.
Next, some short-term indicators may be positive: MACD is rising and the 8-day exponential moving average (EMA) is nearing a potential cross above the 21-day EMA.
Finally, PLTR is one of the top underliers in the options market. (Its 800,000 contracts per day in the last month ranks it fourth in the S&P 500, according to TradeStation data.) That could help traders take positions with calls and puts.
TradeStation has, for decades, advanced the trading industry, providing access to stocks, options and futures. If you're born to trade, we could be for you. See our Overview for more.
Past performance, whether actual or indicated by historical tests of strategies, is no guarantee of future performance or success. There is a possibility that you may sustain a loss equal to or greater than your entire investment regardless of which asset class you trade (equities, options or futures); therefore, you should not invest or risk money that you cannot afford to lose. Online trading is not suitable for all investors. View the document titled Characteristics and Risks of Standardized Options at www.TradeStation.com . Before trading any asset class, customers must read the relevant risk disclosure statements on www.TradeStation.com . System access and trade placement and execution may be delayed or fail due to market volatility and volume, quote delays, system and software errors, Internet traffic, outages and other factors.
Securities and futures trading is offered to self-directed customers by TradeStation Securities, Inc., a broker-dealer registered with the Securities and Exchange Commission and a futures commission merchant licensed with the Commodity Futures Trading Commission). TradeStation Securities is a member of the Financial Industry Regulatory Authority, the National Futures Association, and a number of exchanges.
Options trading is not suitable for all investors. Your TradeStation Securities’ account application to trade options will be considered and approved or disapproved based on all relevant factors, including your trading experience. See www.TradeStation.com . Visit www.TradeStation.com for full details on the costs and fees associated with options.
Margin trading involves risks, and it is important that you fully understand those risks before trading on margin. The Margin Disclosure Statement outlines many of those risks, including that you can lose more funds than you deposit in your margin account; your brokerage firm can force the sale of securities in your account; your brokerage firm can sell your securities without contacting you; and you are not entitled to an extension of time on a margin call. Review the Margin Disclosure Statement at www.TradeStation.com .
TradeStation Securities, Inc. and TradeStation Technologies, Inc. are each wholly owned subsidiaries of TradeStation Group, Inc., both operating, and providing products and services, under the TradeStation brand and trademark. When applying for, or purchasing, accounts, subscriptions, products and services, it is important that you know which company you will be dealing with. Visit www.TradeStation.com for further important information explaining what this means.
