What makes a good moving average?Four Core Qualities of Superior Moving Average
Accuracy (preserving large-scale structure):
Moving average should maintain the important underlying structure of price movements (like major trends and cycles) while filtering out all smaller fluctuations; it should faithfully represent the true price trajectory over longer timeframes.
Timeliness (minimal lag):
Most moving averages lag behind price action - they indicate changes way after they've already happened. A good moving average minimizes this lag, responding quickly to genuine price movements without sacrificing other qualities, providing more actionable signals and earlier entries/exits.
Minimal overshoot:
Overshoot occurs when a highly reactive moving average extends beyond the actual price extremes, creating false impressions of price levels never reached. TEMA, DEMA and HMA are examples of overshooting moving averages; good moving average should avoid this distortion, particularly during price reversals, preventing false triggers when used with threshold-based systems.
Smoothness (reduced noise):
A quality moving average filters out random price fluctuations (noise) that don't represent meaningful market activity, especially in steady non-volatile periods. This creates a clean, smooth line that clearly shows the underlying price direction without the jagged, erratic movements that could trigger false signals.
The Dynamic Adaptive Moving Average
Picture shows a study of Dynamic Adaptive Moving Average that employs a complex approach to price smoothing that continuously adjusts its behavior based on real-time market conditions. At its core, this indicator uses the ratio between short-term True Range and longer-term ATR to measure relative volatility changes in the market. This volatility assessment drives the automatic adjustment of critical smoothing parameters through calibrated sigmoid functions, allowing the indicator to become more responsive during volatile periods and more stable during consolidation.
Smoothing is achieved with three-stage filtering process: the first stage applies preliminary smoothing using self-adjusted adaptive exponential moving average. The second stage implements a Kalman filter that provides further smoothing while maintaining responsiveness to price spikes. The final stage applies another adaptive filter that balances smoothness and lag reduction.
The study shows comparison between HMA indicator and a working model of Dynamic Adaptive Moving Average.
Moving Averages

Breaking the 325 MA at 85K is a good sign.The 325 day moving average is seen in my chart as pink.
The rejection on Friday followed with a healthy retest over this weekend makes me believe liquidity is at 90-95K.
Then we will see more choppy behavior.

Gold | 100-Day SMAHistorically, gold's 100-day moving average has been a good entry-point for traders and buy-and-hold investors. As you can see from the chart, it's provided support on multiple occasions.
If gold is extended relative to its moving averages, you could wait for a pullback to go long. However, you might miss out on further upside, if the precious metal is in a strong bull market.

$SPY March 24, 2025AMEX:SPY March 24, 2025
15 Minutes.
Gap down open on 21st was not strong as gap was covered by close of day.
The fib move for downside was achieved by gap down hence no trade.
Now for the fall 570.57 to 558.03 566 is level to watch.
For the rise 558.72 to 564.89 561-562 is number to watch.
So, a short at 565-566 will have a target 562 -563 levels.
I will wait for Monday open before entering a trade.

Enhance Your Trading with Dual MACD OverlaysBy using two MACD overlays—one based on the current timeframe and another on a higher timeframe—you gain a more comprehensive view of market momentum. This approach helps identify short-term opportunities while aligning trades with the broader trend, reducing false signals. As seen in my chart, combining multiple MACD perspectives can improve decision-making and trade timing.
Try it out and refine your strategy with better trend confirmation!

$6 Copper By 2026 | 9 Months to GoWould like to see some type of pullback as we're at a major resistance level and then a resumption towards the $6 target.
This is the best fractal I've seen play out and is still on track.

LGDTF // cup handle formationAlthough there is a cup handle formation image in the chart, the targets are drawn according to Fibonacci. As a formation condition, we should look for closings above the 0.2752 level.

The Election Was Support. Has it Become Resistance?Last year’s presidential election was a catalyst for stocks. Today’s idea considers its potentially shifting impact on sentiment.
The first pattern on today’s S&P 500 chart is the range between 5597 and 5783. Those prices are the low of November 4 and the high of November 5, the Monday and Tuesday of election week.
On January 13, SPX pulled back to find support at the top of the range. That bounce seemed to reflect ongoing optimism about the coming administration. (Inauguration was exactly a week later.)
The index remained above that zone through early March before sliding below it. Prices have now rebounded but appear to be stalling at the bottom of the price range. Does that show a newer anxiety about policy?
Next, Wilder’s relative strength index (RSI) made lower highs from early December -- despite SPX making incrementally higher highs. That kind of bearish divergence may be consistent with a longer-term trend fading.
Third, SPX is under its 200-day simple moving average (SMA). Staying here may confirm a break of its longer-term uptrend.
Finally, the 50-day SMA recently crossed below 100-day SMA. Both are falling. That may also suggest prices have stopped rising.
TradeStation has, for decades, advanced the trading industry, providing access to stocks, options and futures. If you're born to trade, we could be for you. See our Overview for more.
Past performance, whether actual or indicated by historical tests of strategies, is no guarantee of future performance or success. There is a possibility that you may sustain a loss equal to or greater than your entire investment regardless of which asset class you trade (equities, options or futures); therefore, you should not invest or risk money that you cannot afford to lose. Online trading is not suitable for all investors. View the document titled Characteristics and Risks of Standardized Options at www.TradeStation.com . Before trading any asset class, customers must read the relevant risk disclosure statements on www.TradeStation.com . System access and trade placement and execution may be delayed or fail due to market volatility and volume, quote delays, system and software errors, Internet traffic, outages and other factors.
Securities and futures trading is offered to self-directed customers by TradeStation Securities, Inc., a broker-dealer registered with the Securities and Exchange Commission and a futures commission merchant licensed with the Commodity Futures Trading Commission). TradeStation Securities is a member of the Financial Industry Regulatory Authority, the National Futures Association, and a number of exchanges.
TradeStation Securities, Inc. and TradeStation Technologies, Inc. are each wholly owned subsidiaries of TradeStation Group, Inc., both operating, and providing products and services, under the TradeStation brand and trademark. When applying for, or purchasing, accounts, subscriptions, products and services, it is important that you know which company you will be dealing with. Visit www.TradeStation.com for further important information explaining what this means.

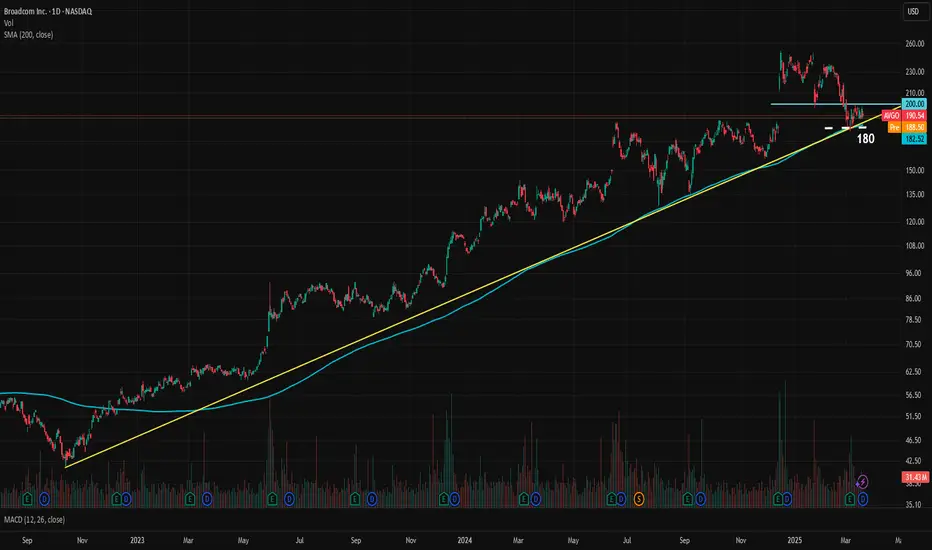
AVGO Stuck Between Key Levels, A Calm Before the Storm?Broadcom, one of the key favorites in the AI rally, is at a crossroads. AVGO has been in a steady logarithmic uptrend since October 2022, carrying the stock price from 41.51 to 251.88, marking an impressive 506% gain in about two and a half years. The company's EPS has been consistently increasing over the years and is expected to accelerate further this year. Although valuations are high, if Broadcom's performance in 2025 meets or exceeds expectations, the bullish case remains strong. The forward P/E for 2025 end is 28.7x.
Currently, the price is stuck between the trendline and the 200 resistance level. The uptrend is supported by the 200-day moving average. The trendline sits around 184, while the SMA is at 182.50. For a more cautious approach, 180 can be considered the key medium-term support level. If 180 holds and AVGO manages to break above the 200 resistance, there is significant upside potential for the bulls.
The current analyst consensus for the 12-month price target is 251, which also coincides with the stock's all-time high (ATH).
$BTC Battle at 200DMA - Bullish DivergenceThe 200DMA is the real battle for bulls and bears rn.
At least PA is respecting my squiggles 😊
Bullish Divergence is the key here.

Navigating XRP Regulatory Winds and Technical TidesThe crypto sphere remains fixated on XRP, a digital asset perpetually caught between regulatory scrutiny and promising technological advancements. Recent developments, including the delayed decision on a potential XRP ETF, the nearing conclusion of the SEC vs. Ripple lawsuit, and the launch of CFTC-regulated XRP futures, have injected fresh volatility and speculation into XRP's price trajectory.
ETF Delay and SEC Lawsuit: A Tale of Two Catalysts
The anticipation surrounding a potential XRP Exchange-Traded Fund (ETF) has been palpable. However, the recent delay in the SEC's decision has tempered immediate expectations. While a positive verdict would undoubtedly trigger a massive price surge, the postponement underscores the regulatory hurdles still facing the cryptocurrency market.
Conversely, the long-standing legal battle between Ripple and the SEC is seemingly approaching its denouement. Reports suggest the SEC is considering dropping the case against Ripple, a development that has already spurred significant price appreciation. The dismissal of the lawsuit, even if partial, would provide much-needed regulatory clarity, significantly boosting investor confidence. This potential resolution drove XRP up 12+% to $2.50, indicating the market's sensitivity to legal outcomes.
Technical Analysis: Charting a Course to New Highs
From a technical standpoint, XRP's price action displays a complex interplay of support and resistance levels. A critical resistance zone lies between $2.60 and $2.89. Overcoming this barrier is crucial for XRP to unlock its full potential and embark on a sustained upward trend. However, XRP has shown resilience, maintaining support above the $2.0 mark, which suggests underlying strength.
Analyzing the Elliott Wave theory, some analysts suggest XRP is currently in a corrective Wave 4. Within this framework, the $2.66 level emerges as a pivotal point. Breaking above this level would signal the completion of Wave 4 and the initiation of Wave 5, potentially leading to new all-time highs. This wave count, while speculative, provides a valuable framework for understanding potential price movements.
Conversely, trading below the 100-day moving average (MA) presents a significant setback for XRP buyers. This would signal a potential shift in momentum and could lead to further downward pressure. Investors should closely monitor this MA as a key indicator of short-term price direction.
Bitnomial's XRP Futures: Bridging Traditional and Crypto Markets
The launch of Bitnomial's CFTC-regulated XRP futures marks a significant milestone for the asset. This development provides institutional investors with a regulated avenue to gain exposure to XRP, potentially increasing liquidity and market depth. This regulated futures market may also provide more price stability, while also providing a tool for shorting XRP.
How High Can XRP Price Go After a Ripple Victory?
The question on everyone's mind is: how high can XRP soar if Ripple secures a decisive victory against the SEC? Predicting exact price targets is inherently challenging, but several factors suggest a bullish outlook.
Firstly, regulatory clarity would remove a major overhang that has suppressed XRP's price for years. This newfound certainty would attract a wave of institutional and retail investors who have previously been hesitant to invest due to legal uncertainties.
Secondly, Ripple's continued expansion and adoption of its technology, particularly in the cross-border payments sector, positions XRP for long-term growth. The increasing demand for efficient and cost-effective payment solutions could further fuel XRP's price appreciation.
Thirdly, the psychological impact of a legal victory should not be underestimated. It would validate XRP's legitimacy as a digital asset and potentially trigger a FOMO (fear of missing out) rally.
Based on these factors, some analysts speculate that XRP could potentially retest and surpass its previous all-time high, potentially reaching double-digit valuations. However, the timing and magnitude of such a surge remain subject to market dynamics and regulatory developments.
Why Is XRP Surging? The Convergence of Catalysts
The recent surge in XRP's price can be attributed to a convergence of positive catalysts. The nearing conclusion of the SEC lawsuit, coupled with the launch of CFTC-regulated XRP futures, has created a perfect storm of bullish sentiment.
Furthermore, general market sentiment towards cryptocurrencies has been improving, with increasing institutional adoption and growing awareness of the technology's potential.
Navigating the Volatility: A Word of Caution
While the outlook for XRP appears promising, investors should remain cognizant of the inherent volatility of the cryptocurrency market. Regulatory developments, market sentiment, and technical factors can all significantly impact price movements.
Therefore, investors should conduct thorough research, manage their risk prudently, and avoid making impulsive decisions based on short-term price fluctuations.
In conclusion, XRP is navigating a complex landscape of regulatory headwinds and technological tailwinds. The nearing conclusion of the SEC lawsuit, coupled with the launch of regulated futures, presents a compelling case for a bullish outlook. However, investors should remain vigilant and exercise caution as they navigate the volatile crypto market. The interplay of legal outcomes, technical analysis, and market sentiment will ultimately determine XRP's future trajectory.

Unveiling Crypto Market Insights - Wen PumpGM, Bitstampers!
In today’s update, we’re diving into Bitcoin’s recent price action, analyzing its current trend, and identifying key support and resistance levels .
Bitcoin Market Commentary
Bitcoin reached a new all-time high (ATH) of $109.4K on January 20, 2025, on Bitstamp. Since then, the price has been in a sustained downtrend, marking 50 consecutive days without a meaningful trend reversal.
On March 9, BTC broke below the 200-day simple moving average (SMA) and had repeatedly failed to reclaim it—until yesterday, when it made a conclusive close above it, indicating a potential trend reversal.
We’re closely watching key support and resistance levels:
March 11 low – Bitcoin touched 76K, and established short-term support.
Next major support – Around 73K, aligning with the March 2024 high. A drop to this level would mark a >30% correction from ATH.
With Bitcoin reclaiming the 200-day SMA, indicating a potential trend reversal, levels around 90K could act as an important line of resistance.
If Bitcoin bottomed on March 11, that would mark an almost 30% correction lasting 50 days.
What’s next for Bitcoin? Has it bottomed, or is further downside in play? When do you think Bitcoin will trade above 100K again? Share your thoughts in the comments!

$SPY March 20, 2025AMEX:SPY March 20, 2025
15 Minutes.
For the extension 559.07 to 566.3 to 562.05 100% move is done yesterday making a high 570.95.
For the last rise 562.05 to 570.95 holding 565 is important else i expect a side moving average consolidation around 562 563 levels so that 50, 100 and 200 gets sorted out in order.

Is Chevron Attempting a Breakout?Chevron has gone nowhere for more than a year, but some traders may think that’s changing.
The first pattern on today’s chart is the $162.30 level, the highest weekly close since last May. The energy giant challenged that resistance a few times without success -- but yesterday may have broken it decisively.
CVX also apparently escaped a falling trendline that began in September 2023.
Next, you have the series of lower weekly lows, followed by higher weekly lows (marked with yellow arrows). That may be viewed as a long-term basing pattern.
Last, the 100-day simple moving average (SMA) recently crossed above the 200-day SMA. The 50-day SMA crossed above both. Such an alignment, with faster SMAs above slower ones, may be consistent with a longer-term uptrend.
TradeStation has, for decades, advanced the trading industry, providing access to stocks, options and futures. If you're born to trade, we could be for you. See our Overview for more.
Past performance, whether actual or indicated by historical tests of strategies, is no guarantee of future performance or success. There is a possibility that you may sustain a loss equal to or greater than your entire investment regardless of which asset class you trade (equities, options or futures); therefore, you should not invest or risk money that you cannot afford to lose. Online trading is not suitable for all investors. View the document titled Characteristics and Risks of Standardized Options at www.TradeStation.com . Before trading any asset class, customers must read the relevant risk disclosure statements on www.TradeStation.com . System access and trade placement and execution may be delayed or fail due to market volatility and volume, quote delays, system and software errors, Internet traffic, outages and other factors.
Securities and futures trading is offered to self-directed customers by TradeStation Securities, Inc., a broker-dealer registered with the Securities and Exchange Commission and a futures commission merchant licensed with the Commodity Futures Trading Commission). TradeStation Securities is a member of the Financial Industry Regulatory Authority, the National Futures Association, and a number of exchanges.
TradeStation Securities, Inc. and TradeStation Technologies, Inc. are each wholly owned subsidiaries of TradeStation Group, Inc., both operating, and providing products and services, under the TradeStation brand and trademark. When applying for, or purchasing, accounts, subscriptions, products and services, it is important that you know which company you will be dealing with. Visit www.TradeStation.com for further important information explaining what this means.

NEM // cup handle formationAlthough there is a cup handle formation image on the chart, the targets are drawn according to Fibonacci. We need closings above 48.08 as a formation condition.

Bearish Scenario If FOMC News Favors BearsFOMC interest rate news is due in less than 2hours .
I Stayed out of the market waiting since last Thursday just to wait for FOMC news because the market will almost always goes into consolidation days before this news due to its significant impact. So its usually a good idea to avoid getting chopped in the sideways action unless you like donating money to the market instead of waiting for a new trend to emerge or a continuation of the on-going trend.
After todays fomc news, we will know if we will resume dumping everything, or we'll evaluate potential short term bullish scenarios. For now, my recent BTC short analysis is still intact. I already took profit on all 8 short positions i was in on various coins i shorted along side BTC. If the FOMC news favors the bears, i'll be looking to re-enter shorts in the range 86.4k to 91k.

XRP Update | $5Similar accumulation pattern to what we've seen last year December. Price action is holding up nicely above the 150d SMA on a daily TF with bullish closes also sitting above the 8d SMA.
Volume is looking very good too with price sitting above the value area.
I'm using the fibonacci extension to get a local target of $5.

$SPY March 19, 2025AMEX:SPY March 19, 2025
15 Minutes.
50% retracement done for the move 549 to 569
Foe the fall 569.71 to 559.07 563-564 is good levels to short.
But we have converging moving averages in 9,21,100 and 200. So 559 +- should be a strong support.
As of now i am looking for longs above 568.


GBP/USD: ID50 Setup Bullish Trade Opportunity1. **ID50 Setup Formation:**
- The market appears to have formed a **peak formation low**, followed by a reversal into an upward trend.
- The price retraced to the **50 EMA (blue line)**, which aligns with the **ID50 trade entry zone** in BTMM.
- A bounce off this moving average suggests **bullish continuation**.
2. **Market Structure & Momentum:**
- Higher highs and higher lows are evident, confirming an uptrend.
- The **red EMA (13 EMA)** remains above the **50 EMA**, reinforcing the bullish sentiment.
- Price recently tested the **50 EMA support**, indicating a potential **buying opportunity**.
3. **Key Levels to Watch:**
- The nearest **resistance zone** is around **1.29700**, which might serve as the next target.
- Support is currently around **1.29000**, aligning with the 50 EMA.
**Conclusion:**
If the price maintains support above the 50 EMA, the **bullish ID50 setup** suggests a continuation of the uptrend. A break above recent highs could lead to further gains. However, traders should watch for potential **stop hunts** before a strong move occurs.

GBP/USD Intraday Market Analysis: Potential Upside ReversalThe GBP/USD 15-minute chart suggests a possible bullish reversal following a period of consolidation near the 200-period moving average. Price action formed multiple rejection wicks at a key support level, indicating buying interest. A bullish engulfing candle has emerged, confirming a potential shift in momentum.
The risk-to-reward setup highlights a long position, with stop-loss protection just below the recent lows and a target towards previous liquidity zones. The stochastic-based momentum indicator shows a crossover in oversold territory, further supporting potential upside movement.
If price sustains above the 200 EMA and breaks through immediate resistance, further bullish continuation is likely. However, failure to hold above the entry level could invalidate the setup, leading to further downside pressure.

NAS100 | Distribution ContinuationPrice is awaiting a movement towards $18,000 and currently in a distribution phase.

USDCHF Take it or Leave it.USDCHF - The price is testing a demand zone from Dec 2024. The only valid scenario for this pair is to sell. We can wait to see how the price will react the next days.
