XRP Eyes $4? Analyst Says ‘Most Profitable Phase’ May Have BegunAs the broader crypto market shows signs of recovery, XRP is once again capturing investor attention—this time with bold forecasts of a surge toward $4.00, driven by technical momentum, market sentiment, and expanding real-world utility.
According to crypto analyst Darren Chu, CFA, founder of Tradable Patterns, XRP may be entering its “most profitable phase” since its 2021 rally. The token has posted a 20% gain over the last three weeks, breaking key resistance levels and displaying stronger correlation with broader altcoin inflows.
“XRP has the ideal confluence of legal clarity, technical breakout, and network traction,” Chu explained in a recent research note. “The conditions now resemble the early stages of major cyclical surges we’ve seen in past bull runs.”
Legal and Regulatory Tailwinds
Since Ripple Labs’ partial legal victory against the U.S. SEC in 2023—where a federal judge ruled that XRP is not a security when traded on exchanges—the asset has regained credibility among institutional players. Multiple crypto funds and ETFs have added exposure, and on-chain wallet growth has accelerated.
This legal clarity has paved the way for Ripple to resume aggressive expansion of its payment corridors, especially in Latin America and Asia-Pacific.
Real-World Utility as a Demand Catalyst
Unlike many Layer 1 tokens with purely speculative value, XRP benefits from real-world utility as a bridge asset for global payments. RippleNet, the enterprise-grade payment network built on XRP, now boasts over 300 financial institutions using or piloting XRP-based settlement infrastructure.
In July, Ripple announced its latest partnership with Banco Bradesco, one of Brazil’s largest banks, to streamline USD/BRL remittances—a deal expected to drive significant volume on-chain.
Analysts note that real-world utility may now be priced into XRP’s valuation at a discount, creating room for catch-up as adoption increases.
Technical Analysis Points Toward Breakout
From a technical standpoint, XRP has breached its multi-month descending channel, with daily trading volume rising 35% over the past two weeks. Analysts are watching the $0.92–$1.00 range as a short-term hurdle. If broken, momentum could accelerate quickly toward $1.50, and potentially as high as $3.80–$4.20, according to Fibonacci-based projections.
“The breakout setup is textbook,” says Chu. “We’re seeing volume confirmation, RSI divergence, and a broader macro narrative—all aligning.”
Risk and Reward: A Balanced View
Of course, XRP is not without risks. Pending SEC appeals, macro volatility, and delays in Ripple’s expansion plans could temper the pace of gains. Still, many investors are betting that the risk-reward profile is increasingly asymmetric in XRP’s favor.
In the eyes of analysts and asset managers alike, XRP is now more than a litigation story—it’s a comeback story.
For those seeking exposure to a large-cap crypto with strong fundamentals, legal clarity, and real-world traction, the message from the market is clear: XRP’s most profitable phase may have just begun.
Moving Averages

PayPal’s Stablecoin Ambitions Falter Ahead of Earnings ReportWhen PayPal launched its own stablecoin PYUSD in August 2023, the move was seen by many as a bold step toward dominating the digital payments space. However, nearly two years later, PYUSD has yet to meet expectations. Its market share remains minimal, trading volume is weak, and trust from the DeFi community is limited — all while PayPal’s next earnings report looms and investor pressure mounts.
What’s the issue?
According to data from DefiLlama and CoinGecko, PYUSD’s market cap stands at just over $400 million, despite high-profile marketing campaigns and its integration with Venmo. In comparison, USDT has surpassed $110 billion in circulation, and USDC stands at around $32 billion. PYUSD hasn’t even broken into the top five stablecoins on Ethereum by trading activity.
A key problem is low liquidity and limited DeFi adoption. Although PYUSD is available on several decentralized exchanges (DEXs), it often suffers from high slippage. Moreover, PayPal operates under strict regulatory scrutiny as a public fintech company, limiting its ability to innovate or respond rapidly to market trends.
Why earnings matter
PayPal’s Q2 earnings report is expected next week, and investors will be closely watching not only core metrics like revenue and profit but also figures related to its Web3 and digital asset initiatives. With PYUSD underperforming, pressure is building for PayPal to justify its continued push into the crypto space.
There is growing speculation that the company may consider partnering with an established stablecoin provider or even abandoning PYUSD in favor of a white-label solution — a move that could realign its Web3 roadmap.
The strategic lens
Despite current struggles, PayPal still has the brand and user base to play a significant role in digital finance. However, as DLT analysts emphasize, a stablecoin is more than a payment tool — it’s infrastructure. Success depends on liquidity, trust, and deep integration within the DeFi ecosystem. Without robust adoption across chains and use cases, PYUSD risks becoming an internal-only solution with limited external relevance.
Unless the earnings report reveals a strategic pivot or new partnerships, investors may interpret PYUSD as a lost opportunity rather than a long-term asset.
Ethereum Staking Strain Exposed — Daxprime Weighs InIn July, the Ethereum ecosystem faced a new challenge: a sharp increase in the staking exit queue revealed structural weaknesses in the current liquid staking architecture. Within just a few days, more than 75,000 validators submitted requests to exit, causing temporary disruptions in certain derivative protocols and downward pressure on the prices of liquid staking tokens such as stETH, rETH, and sfrxETH.
Daxprime, a firm specializing in institutional analytics and active strategies in the Web3 sector, believes that this situation presents not only risks, but also new opportunities for profit — particularly for well-prepared market participants.
What Happened?
Since transitioning to Proof-of-Stake in 2022, Ethereum has enabled staking through validators. However, to exit the network, validators must join a queue. Under normal market conditions, this process takes just a few hours to a couple of days. But in July, a sudden surge in withdrawal requests extended the queue to over seven days — the longest wait time since the Shanghai upgrade.
Several factors contributed to the spike in exits:
Increased market volatility;
Rising yields in alternative DeFi instruments;
Panic reactions to liquidity stress in certain protocols.
As a result, liquid staking tokens — which are designed to trade close to a 1:1 ratio with ETH — began to trade at discounts of 3% to 4%, particularly on low-liquidity DEX platforms.
Systemic Risk or Temporary Disturbance?
Daxprime analysts emphasize that this is not a structural threat to Ethereum itself. However, the recent events clearly demonstrate that even "liquid" staking is still fundamentally tied to base-layer network constraints. Protocols like Lido and Rocket Pool are susceptible to imbalances between assets and liabilities, especially when there is a rapid increase in redemption demand.
This also means that users trading staking derivatives without understanding the mechanics of validator exit processes may face temporary illiquidity or losses when attempting to unwind positions during stress events.
How to Profit — Daxprime’s Perspective
For experienced market participants, such imbalances offer entry points with positive expected value. Here’s how Daxprime identifies ways to profit:
1. Arbitrage on Discounted Tokens
When stETH or sfrxETH fall below 0.97 ETH, there is an opportunity to buy these tokens on the secondary market and redeem them for full ETH value — either through redemption protocols or by waiting through the validator exit process.
2. Liquidity Provision with a Premium
Liquidity providers in stETH/ETH or sfrxETH/ETH pools during periods of market stress earn higher trading fees and farming incentives due to increased volume and imbalance in the pools.
3. Futures and Hedging Strategies
On platforms such as dYdX or Aevo, traders can build structured positions using stETH as the spot asset and hedging via ETH futures. This allows them to profit from either the restoration of parity or a continuation of the spread.
Daxprime’s Conclusion
The current exit queue backlog is not a catastrophe — it is a reminder that liquidity in crypto markets is always conditional. Stress events create inefficiencies that sophisticated investors can turn into sources of return.
Daxprime provides the tools to monitor such inefficiencies and helps clients execute strategies that not only mitigate risk but convert volatility into profit.
In markets where even “liquid” assets can become illiquid, those who understand the mechanics and act ahead of the curve stand to win.
Capital B Hits 2,000 BTC as BBDelta Highlights StrategyEthereum has surged past the $3,900 mark, propelled in part by news that Sharplink has acquired 77,200 ETH — a transaction worth over $300 million at current market value. For BBDelta, this move is not just market noise — it’s a concrete example of how institutional-grade Ethereum strategies can drive both asset growth and consistent income.
Sharplink, originally focused on gaming and Web3 infrastructure, has recently pivoted toward an asset-heavy Ethereum strategy. This latest acquisition positions the firm among the top ETH holders globally — and, more importantly, signals a clear roadmap to profit generation within the Ethereum ecosystem.
BBDelta analysts believe Sharplink isn’t buying ETH for speculative purposes. Rather, the company is likely deploying a multifaceted revenue model using its holdings. That includes high-yield staking via Ethereum’s proof-of-stake protocol, engagement with DeFi lending platforms, and participation in liquidity pools. These strategies, when executed correctly, can yield between 4% and 8% annually — paid directly in ETH or stablecoins.
In addition to yield generation, Sharplink could be utilizing ETH to collateralize derivatives positions, fund tokenized infrastructure, or support its presence in NFT ecosystems. Ethereum, as a platform, offers an incredibly diverse set of use cases — making it more than just a crypto asset, but a cornerstone of digital finance.
The breakout past $3,900 further strengthens this strategy. BBDelta’s technical analysis shows increased open interest in ETH futures and options, indicating rising institutional demand and the likelihood of continued volatility — a prime environment for experienced players to profit from both price movement and structure-based yields.
Sharplink’s timing also reflects sound macroeconomic thinking. As fiat currencies continue to face inflationary pressure and traditional interest rates plateau, ETH-based strategies offer both protection and performance. BBDelta believes this dual value proposition — yield + appreciation — is driving renewed interest in Ethereum as a strategic reserve asset.
At BBDelta, we empower clients to capitalize on these same dynamics. Whether it’s through ETH staking, DeFi revenue models, or structured derivatives, we offer the tools and advisory frameworks that allow investors to turn ETH holdings into active profit centers — with proper risk management in place.
Ethereum’s $3,900 milestone is not a peak — it’s a gateway to next-level opportunity. For those with the infrastructure, insights, and risk controls in place, the digital economy is not just a bet — it’s a business.

Metaplanet Doubles Down on Bitcoin Despite Weak SharesJapanese investment firm Metaplanet continues to draw attention with its pro-Bitcoin stance, announcing a fresh acquisition of BTC worth $93 million. The move comes despite ongoing pressure on the company's stock, underscoring its long-term commitment to digital assets.
Publicly listed on the Tokyo Stock Exchange, Metaplanet began accumulating Bitcoin in early 2024, taking inspiration from U.S.-based MicroStrategy. Since then, the company has steadily increased its holdings, viewing the cryptocurrency as a hedge against inflation and currency devaluation — particularly in light of the weakening yen.
With this latest purchase, Metaplanet’s total Bitcoin holdings now exceed 5,000 BTC, making it one of Asia’s largest corporate holders of the asset. Company executives emphasize that their approach is not driven by short-term speculation, but rather by a strategic vision to transform the balance sheet and align with the future of finance.
Still, the stock market has not fully embraced the strategy. Since the company’s initial crypto investments, Metaplanet shares have experienced significant volatility and an overall downward trend. Some investors remain wary of overexposure to a single volatile asset, fearing it could deter traditional capital and increase overall risk.
Speaking to local media, CEO Tetsuya Nagata reiterated that the firm’s Bitcoin commitment is deliberate and resilient. “We’re not chasing short-term price movements,” he said. “We see corrections as opportunities to strengthen our position and prepare for long-term transformation.”
Analysts are divided. Some view Metaplanet’s approach as a sign of growing institutional appetite for crypto in Asia, while others call for a more diversified portfolio to mitigate risk. There is growing speculation that Metaplanet’s bold move could set a precedent for other Japanese and regional companies seeking similar exposure.
Against the backdrop of global economic uncertainty and financial digitization, Bitcoin is evolving from a speculative asset into a core component of strategic asset allocation. Metaplanet is a clear example of this shift — one that is navigating short-term market challenges in pursuit of a long-term digital vision.
Time will tell whether the strategy pays off. But for now, Metaplanet is carving out a bold new role in Japan’s corporate landscape, as a pioneer of institutional Bitcoin adoption in Asia.

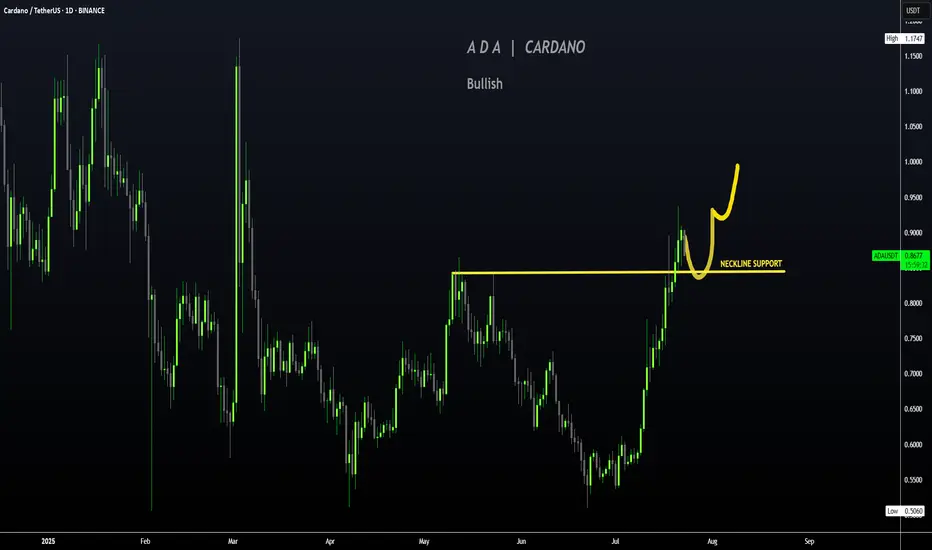
CARDANO | ADA Creeping UP to $1Cardano has made a big move in recent weeks, boasting a 77% increase.
If you were lucky enough to buy in around 30 or 40c, this may be a great TP zone:
Looking at the Technical Indicator (moving averages), we can see the price makes its parabolic increases ABOVE - which is exactly where we are currently beginning to trade. This could mean more upside is likely, and the 1$ zone is a big psychological resistance zone:
A continuation of the current correction may look something like this for the next few weeks:
_____________________
BINANCE:ADAUSDT
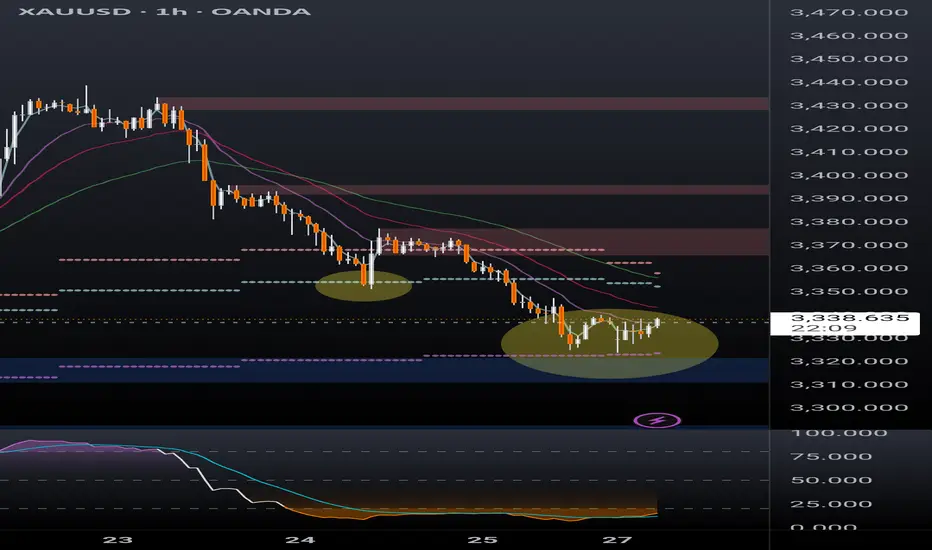
XAUUSD is bouncing off daily 50emaHonestly i hate trading this pair. So many ridiculous highs and lows. But right now the PA is bouncing off the daily 50ema. That's it.
Sugar Future - New York (Raw) Quote | Chart & Forecast SummaryKey Indicators On Trade Set Up In General
1. Push Set Up
2. Range Set Up
3. Break & Retest Set Up
Notes On Session
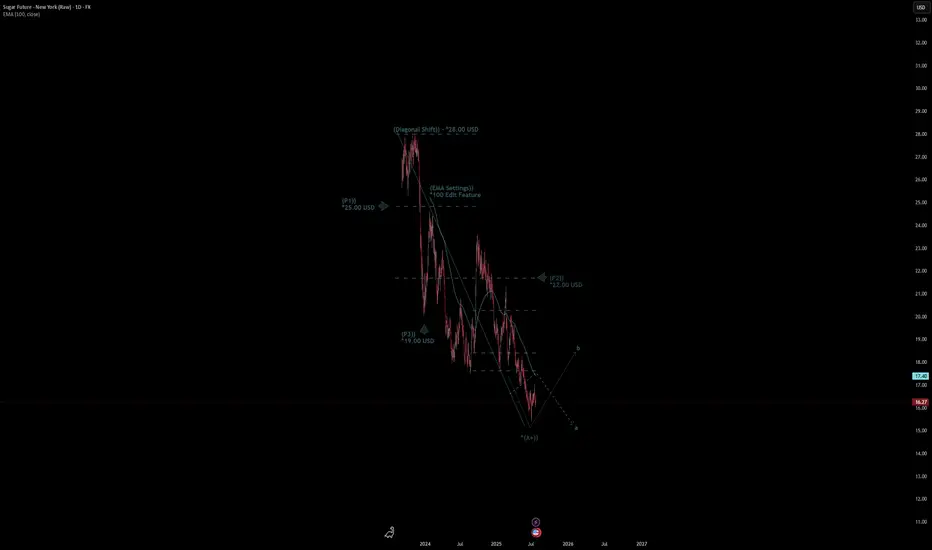
# Sugar Future - New York (Raw) Quote
- Double Formation
* (Diagonal Shift)) - *28.00 USD | Completed Survey
* (EMA Settings)) - *100 Edit Feature | Subdivision 1
- Triple Formation
* (P1)) / (P2)) & (P3)) | Subdivision 2
* (TP1) = a / Long Consecutive Range
* (TP2) = b / Short Consecutive Pullback | Subdivision 3
* Daily Time Frame | Trend Settings Condition
- (Hypothesis On Entry Bias)) | Regular Settings
- Position On A 1.5RR
* Stop Loss At 19.00 USD
* Entry At 16.00 USD
* Take Profit At 12.00 USD
* (Downtrend Argument)) & No Pattern Confirmation
- Continuation Pattern | Not Valid
- Reversal Pattern | Not Valid
* Ongoing Entry & (Neutral Area))
Active Sessions On Relevant Range & Elemented Probabilities;
European-Session(Upwards) - East Coast-Session(Downwards) - Asian-Session(Ranging)
Conclusion | Trade Plan Execution & Risk Management On Demand;
Overall Consensus | Sell
Bullish "Daily Chore" Setup on the EURUSDWe had one on Silver last week that played out nicely, now we have another Daily Chore signal setting up on the $EURUSD.
This is a short & sweet type of setup where we are looking for a test and rejection of a moving average an an opportunity to catch the next potential move upwards.
As mentioned in the video, we have A LOT of high impact news events happening this week so please be aware of that when looking to involve yourself in this and any other trading opportunities this week.
Please support by hitting that like button.
Follow so that you don't miss my future trading ideas.
And if you have any questions, comments or want to share you views on the market, please do so below.
Akil

DaxPrime: BlackRock Exec Move Signals SharpLink’s $1.3B ETH ShifIn a development that is drawing attention across both institutional finance and the crypto ecosystem, a senior executive from BlackRock’s digital assets division has transitioned to SharpLink Gaming — a rising Ethereum whale and sports betting infrastructure player now managing over $1.3 billion in ETH-based assets. At DaxPrime, we see this move not as an isolated career shift but as a strategic signal of deepening convergence between traditional asset management and Web3-native businesses.
The Move: From Wall Street to Web3 Execution
According to sources familiar with the matter, BlackRock’s former Head of Digital Asset Strategy, Daniel Wexler, is joining SharpLink Gaming as its Chief Digital Officer. Wexler played a critical role in shaping BlackRock's crypto ETF initiatives and oversaw early-stage partnerships with Ethereum ecosystem projects.
His transition comes at a time when SharpLink — originally focused on B2B sports betting technologies — has evolved into a key player in decentralized infrastructure, integrating smart contracts, Layer-2 analytics, and tokenized in-game markets. The company currently holds over $1.3 billion in Ethereum, making it one of the largest corporate ETH holders in the entertainment-tech sector.
DaxPrime’s View: Strategic Talent Realignment
At DaxPrime, we interpret this as more than just a personnel update. It reflects a broader realignment where institutional talent is gravitating toward firms that offer speed, flexibility, and a native role in the decentralized economy.
“The move illustrates a trend we’ve tracked since early 2024: legacy finance professionals are increasingly pivoting toward operational roles in Web3-native companies, particularly those with real assets and strong ETH exposure,” says Michaela Strobel, Senior Analyst at DaxPrime.
SharpLink’s use of Ethereum spans beyond treasury holdings. The firm is building proprietary smart contract infrastructure for real-time sports data feeds, NFT-linked fantasy games, and decentralized betting protocols — signaling a broader use-case than speculative ETH storage.
Ethereum as a Strategic Asset
Wexler’s decision also underscores Ethereum’s growing importance as a corporate strategic asset, not merely an investment vehicle. Ethereum’s programmable layer and widespread developer adoption make it the backbone of emerging digital business models — including SharpLink’s.
DaxPrime’s July 2025 ETH Treasury Index reveals that more than 18 publicly listed firms now hold over $500 million in Ethereum each, compared to just five a year ago. This uptick is particularly concentrated in sectors like digital media, AI-gaming convergence, and decentralized finance tooling.
“Ethereum’s shift from an investment to infrastructure asset is well underway,” Strobel notes. “Wexler’s move brings boardroom-grade credibility to a company operating deep within that transformation.”
What It Means for Investors
For investors, this move signals two critical developments:
Institutional Validation of Web3 Business Models: Wexler’s transition lends credence to firms building around Ethereum-based infrastructure, rather than just speculating on token prices.
New Pathways for ETH Utility: SharpLink’s planned integration of ETH staking, yield strategies, and decentralized oracles into its sports gaming vertical could set new standards for how consumer-facing platforms leverage blockchain.
DaxPrime’s Conclusion
The decision by a senior BlackRock executive to join an Ethereum-native company like SharpLink Gaming is not a one-off anomaly. It reflects a rapidly maturing industry where the center of gravity is shifting from financial speculation to operational integration.
At DaxPrime, we continue to monitor executive movements as a leading indicator of sector confidence and capital rotation. As Ethereum evolves from “store of value” to “platform for value,” such strategic appointments signal where the smart money is going — and what the next phase of crypto utility will look like.
ETH to Lead BTC Over Next 6 Months, Says Galaxy CEOIn a bold forecast that has reignited the debate over crypto market leadership, Galaxy Digital CEO Mike Novogratz stated that Ethereum (ETH) is poised to outperform Bitcoin (BTC) over the next six months, citing improving fundamentals, institutional tailwinds, and critical network upgrades.
Novogratz, a long-time crypto advocate with deep ties to both traditional finance and blockchain innovation, made the statement during an interview at the Digital Asset Summit in New York, sparking renewed discussion about the shifting dynamics between the two largest digital assets by market capitalization.
Ethereum’s Evolving Investment Case
“Ethereum is becoming more than just a smart contract platform,” said Novogratz. “It’s evolving into a foundational layer for the future of finance.”
This confidence is underpinned by Ethereum’s transition to proof-of-stake, reduced energy consumption, and growing usage of Layer 2 scaling solutions like Arbitrum and Optimism. These developments, Galaxy argues, have made Ethereum more attractive to institutional investors who previously stayed away due to scalability concerns and environmental critiques.
Stronger Fundamentals, Expanding Utility
Ethereum’s network revenue—driven by transaction fees and on-chain activity—has consistently outpaced competitors. According to Galaxy’s internal research, Ethereum generated over $2.1 billion in protocol revenue in the first half of 2025, compared to just under $1.5 billion for Bitcoin.
Additionally, the rise of real-world asset (RWA) tokenization, DeFi resurgence, and the adoption of Ethereum-based stablecoins by traditional finance platforms have significantly enhanced ETH’s long-term value proposition.
“Ethereum is no longer a tech experiment. It’s infrastructure,” Novogratz stated.
Bitcoin Still Dominates, But ETH Momentum Grows
While Novogratz remains bullish on Bitcoin, he emphasizes that BTC is now more of a macro hedge than a dynamic growth asset. With institutional investors already heavily exposed to Bitcoin via spot ETFs, the marginal capital over the next cycle may shift toward Ethereum, particularly as ETH-based ETF products gain traction.
“Bitcoin remains the king of store-of-value assets in crypto. But Ethereum is where innovation and yield are happening,” Novogratz added.
Six-Month Outlook
Galaxy projects that ETH could outperform BTC by 20–30% in the second half of 2025, driven by upgrades like Proto-Danksharding, expanding Layer 2 activity, and Ethereum’s role in cross-chain interoperability.
Novogratz also hinted that Galaxy is allocating more capital into Ethereum-based venture projects and staking infrastructure, in anticipation of a “second-layer boom” later this year.
Conclusion
While Bitcoin remains the undisputed anchor of the crypto economy, Ethereum’s expanding utility, institutional relevance, and revenue-generating capabilities position it to lead performance in the near term.

Crypto Might Protect You from a Global Debt Crisis | OpinionAs sovereign debt levels surge and central banks struggle with inflationary aftershocks, investors worldwide are seeking new forms of financial protection. While gold and U.S. Treasuries have historically served as safe-haven assets, the current global debt structure presents unprecedented risks. In this context, cryptocurrencies — particularly decentralized, deflationary assets — may offer a unique hedge against systemic instability.
A Mounting Crisis
According to the IMF, global debt reached $315 trillion in Q2 2025, led by the U.S., China, and EU member states. Rising interest rates have pushed sovereign debt servicing costs to record highs. At the same time, inflation remains sticky, and fiscal deficits continue to expand — creating a scenario where traditional instruments may no longer preserve purchasing power.
Credit downgrades of major economies — including a recent warning from Moody’s on the UK and France — further highlight the fragility of fiat-based systems.
Why Crypto Provides an Alternative
Fixed Supply:
Bitcoin’s 21 million cap remains untouched. In an era of unlimited fiat printing, scarcity is a value proposition in itself.
Decentralization:
Cryptocurrencies operate outside centralized banking systems. In case of capital controls or currency devaluation, digital assets remain globally transferable and resistant to censorship.
Accessibility and Liquidity:
From stablecoins to DeFi protocols, crypto provides 24/7 access to financial tools — often with greater transparency than traditional banks.
Not Without Risk
Crypto remains volatile and vulnerable to regulatory shifts. The recent ETF delays by the SEC and tax crackdowns in G20 countries underscore the uncertain terrain. However, compared to the looming debt traps of fiat economies, some volatility may be an acceptable tradeoff for autonomy and deflationary exposure.
Growing Institutional Interest
Firms like Fidelity, BlackRock, and BBDelta have significantly increased their crypto allocations, particularly in ETH and BTC. Even central banks are researching CBDCs and holding digital reserves as a contingency plan.
Conclusion
While crypto isn’t a panacea, it represents a credible hedge in a world where fiat debt continues to spiral. For risk-aware investors, a balanced portfolio in 2025 likely includes a thoughtful allocation to digital assets — not for speculation, but for protection.
The debt crisis is not a distant threat. It’s unfolding now — and cryptocurrency may be one of the few tools with the potential to navigate what comes next.

Diageo plc Quote | Chart & Forecast SummaryKey Indicators On Trade Set Up In General
1. Push Set Up
2. Range Set Up
3. Break & Retest Set Up
Notes On Session
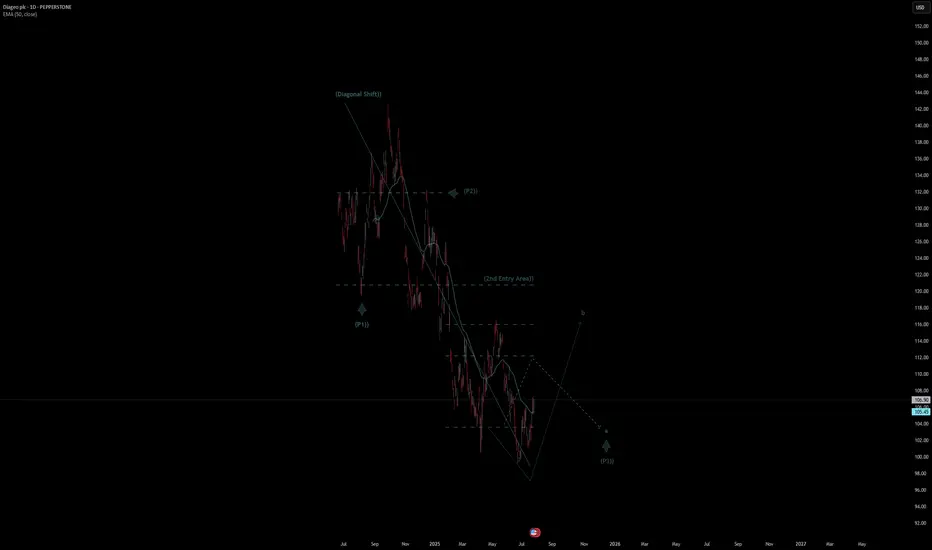
# Diageo plc Quote
- Double Formation
* (Diagonal Shift)) | Completed Survey
* (2nd Entry Area)) | Subdivision 1
- Triple Formation
* (P1)) / (P2)) & (P3)) | Subdivision 2
* (TP1) = a / Long Consecutive Range
* (TP2) = b / Short Consecutive Pullback | Subdivision 3
* Daily Time Frame | Trend Settings Condition
- (Hypothesis On Entry Bias)) | Regular Settings
- Position On A 1.5RR
* Stop Loss At 113.00 USD
* Entry At 107.00 USD
* Take Profit At 98.00 USD
* (Downtrend Argument)) & No Pattern Confirmation
- Continuation Pattern | Not Valid
- Reversal Pattern | Not Valid
* Ongoing Entry & (Neutral Area))
Active Sessions On Relevant Range & Elemented Probabilities;
European-Session(Upwards) - East Coast-Session(Downwards) - Asian-Session(Ranging)
Conclusion | Trade Plan Execution & Risk Management On Demand;
Overall Consensus | Sell
HMC Capital Ltd Quote | Chart & Forecast SummaryKey Indicators On Trade Set Up In General
1. Push Set Up
2. Range Set Up
3. Break & Retest Set Up
Notes On Session
# HMC Capital Ltd Quote
- Double Formation
* (Downtrend Argument)) - *A+ | Completed Survey
* Ongoing Wave (3)) - *(P3)) | Subdivision 1
- Triple Formation
* (P1)) / (P2)) & (P3)) | Subdivision 2
* (TP1) = a / Long Consecutive Range
* (TP2) = b / Short Consecutive Pullback | Subdivision 3
* Daily Time Frame | Trend Settings Condition
- (Hypothesis On Entry Bias)) | Indexed To 100
- Position On A 1.5RR
* Stop Loss At 80.00 AUD
* Entry At 50.00 AUD
* Take Profit At 10.00 AUD
* (Downtrend Argument)) & No Pattern Confirmation
- Continuation Pattern | Not Valid
- Reversal Pattern | Not Valid
* Ongoing Entry & (Neutral Area))
Active Sessions On Relevant Range & Elemented Probabilities;
European-Session(Upwards) - East Coast-Session(Downwards) - Asian-Session(Ranging)
Conclusion | Trade Plan Execution & Risk Management On Demand;
Overall Consensus | Sell

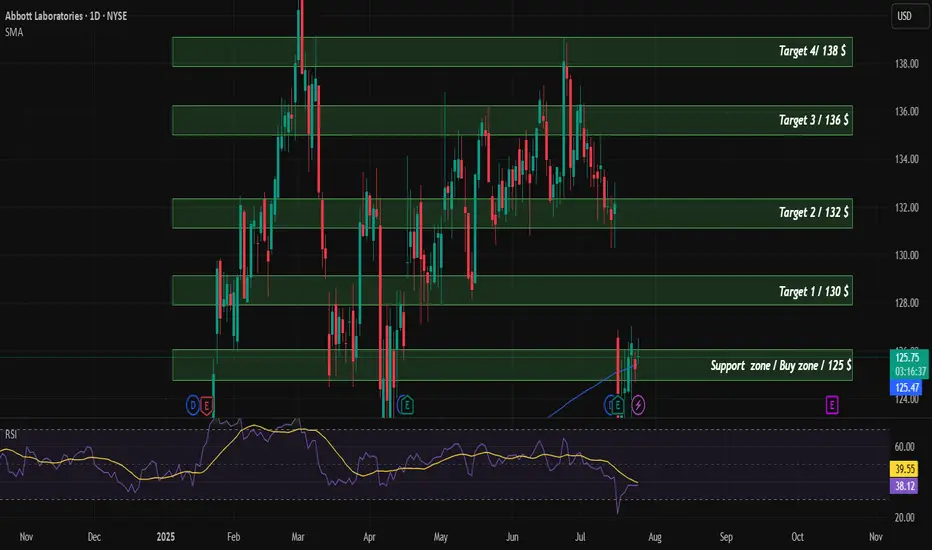
ABT Buy/LongTechnical analysis of the company. According to financial indicators, the company is currently undervalued and is supported by SMA200. The target price for the company is $142.
CELH Eyes Upside Momentum as Consolidation TightensCelsius Holdings, Inc. ( NASDAQ:CELH ) has shown a notable recovery from its early 2025 lows, steadily climbing and recently consolidating around the $46 level. The stock is currently trading above both the short-term (red) and mid-term (blue) moving averages, which are sloping upward—indicating bullish momentum.
The recent price action reveals a tight consolidation just below the previous local highs around $47–$48. If CELH can decisively break above this resistance zone with increased volume, it may trigger a short-term breakout and open room toward the $52–$55 range, even $60.
Conversely, if the stock fails to break above resistance and falls below the $43–$44 support area (near the moving averages), it could trigger a short pullback toward the $40 level.
Key Levels to Watch:
Resistance: $47.50–$48.00
Support: $43.00–$44.00
Breakout Target: $52.00–$55.00 / extended $60
Momentum remains positive, but confirmation through volume and follow-through price action is essential for any breakout to sustain.

USDNOK short potential setupUSDNOK recently broke down below the monthly 50ema (overlayed on this 4h chart) and has rejected off the daily 20ema (overlayed) twice this week. RSI is showing bearish momentum after a brief overbought period while the PA has remained in a strong downtrend. Short setup potential is evident but not certain.
I'm a cat not a financial advisor.

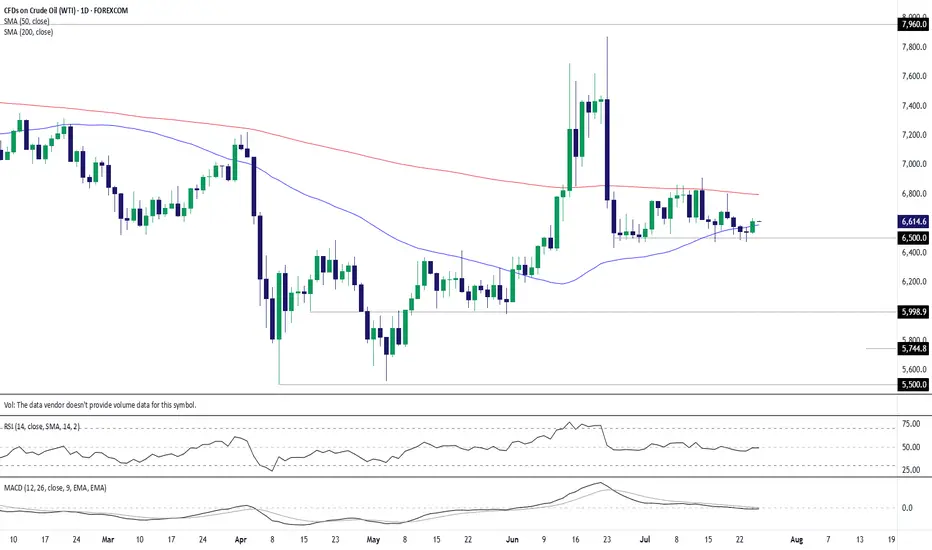
WTI crude: $65 floor holds again as bulls test 50-day MAAfter nine failures to break and close beneath $65 per barrel over the past month, you have to wonder how much longer bears will persist in attempting to take out the level. Following a nice pop higher on Thursday, completing a morning star pattern and closing above the 50-day moving average, it may be time for WTI bulls to have their day in the sun.
For those eyeing long setups, positions could be initiated above the 50-day moving average with a stop beneath for protection against reversal.
As for potential targets, the contract had little luck breaking cleanly above the 200-day moving average earlier this month, making it screen as a suitable level. It’s found just below $68 per barrel today.
Good luck!
DS
XRP 1hr Inverse head & shoulder formingXRP 1 hr chart inverse head and shoulders forming.
If it breaks the neckline it could break out for a 5% rise to the next resistance.
Watching this closely over the next few hours for confirmation.

NZDUSD is forming an upward cycle trendKiwi dollar is strong at the moment.
It is in an upward trend. If the trend completes 2 cycles and maintains the upward trajectory, I will get in the trade as a Long/Buy.
Patiently watching if the trend continues or breaks down.

#TAOUSDT #4h (ByBit) Ascending trendline near breakdownBittensor printed an evening doji star deviation, a retracement down to 200 MA support seems next.
⚡️⚡️ #TAO/USDT ⚡️⚡️
Exchanges: ByBit USDT
Signal Type: Regular (Short)
Leverage: Isolated (5.0X)
Amount: 5.0%
Entry Targets:
1) 430.38
Take-Profit Targets:
1) 362.01
Stop Targets:
1) 464.64
Published By: @Zblaba
GETTEX:TAO BYBIT:TAOUSDT.P #4h #Bittensor #AI #DePIN bittensor.com
Risk/Reward= 1:2.0
Expected Profit= +79.4%
Possible Loss= -39.8%
Estimated Gaintime= 1 week

Las Vegas Sands | LVS | Long at $43.76Pros:
Earnings are forecast to grow 13.29% per year
Earnings grew by 18.4% over the past year
2.3% dividend yield
Cons:
Insider selling and exercising of options
Debt-to-equity ratio of 3.8x
Small price gap on the daily chart near $41 that may close prior to a move up.
If people can't buy houses, they will travel... thus, at $43.76, Las Vegas Sands NYSE:LVS is in a personal buy zone.
Targets
$50.00
$57.00
$59.00

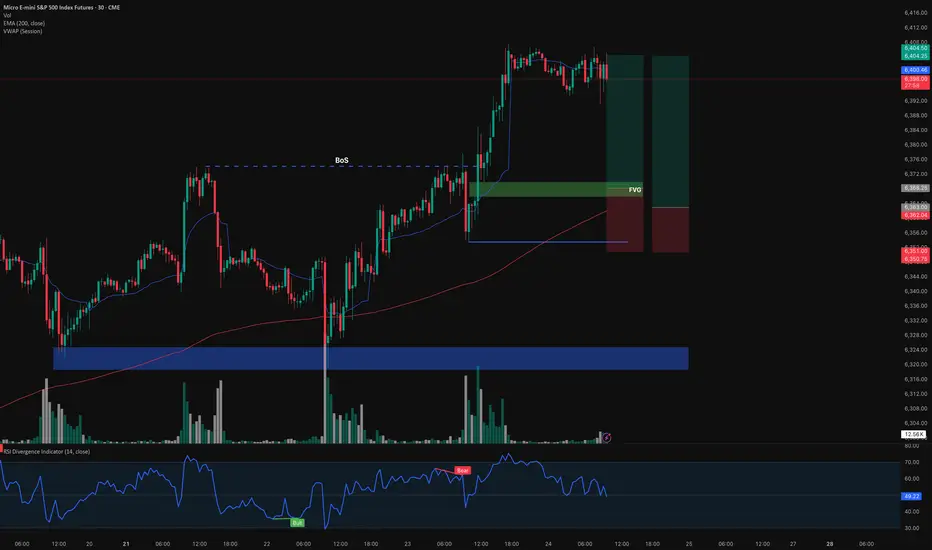
Long MESentry 6338
stop loss 6351
TP 6404.50
1. currently in a uptrend
2. FVG at 6368
3. above 200ema
Before I enter my trade at Id like to look for some market structure to form.
if it breaks below 6353.5 and makes a ChoCh im no longer bullish