Bitcoin Vs Microsoft 🚨MartyBoots here , I have been trading for 17 years and sharing my thoughts on COINBASE:BTCUSD .
🚨
.
NASDAQ:MSFT vs COINBASE:BTCUSD
Do not miss out on COINBASE:BTCUSD as this is a great opportunity. You are still early
Watch video for more details
Microsoft (MSFT)

Nasdaq-100 Goes Back to 'PRE-PAIN' 20 000 Level. Series IIApril has gone..
Wow.. Duh..!? ..really? ... or still not!?
Briefly a month ago or so, we have examined at our wonderful @PandorraResearch Team what is 'Revenge Trading', watch our recent 'Educational' idea right here (if you missed one), to learn what sort of lessons we should know about it.
Indeed, it was a really bad story, to purchase in late March 2025 most-hyped so-known Mag Seven stock that came flagships of the recent stock market collapse.
First of all, watch how it's been below (late March 2025) 👇👇
What's happened next just in a week or two since our publications has been made?
⚒ Russell 2000 Index TVC:RUT 95% stocks were: DOWN
⚒ S&P500 Index SP:SPX 96% stocks were: DOWN
⚒ Nasdaq-100 NASDAQ:NDX as well as Dow Jones Industrial Averages DJIA indices: 97% stocks were DOWN
⚒ Magnificent Seven: ALL STOCKS WERE DOWN
Since Nasdaq-100 went back to pre-pain 20'000 Level, lets repeat some lessons.
Revenge trading is DANGEROUS AND HARMFUL pracrice where traders, after suffering a loss, attempt to immediately recoup their losses by making impulsive, emotionally-driven trades. This behavior is widely recognized as one of the major reasons traders lose significant amounts of money and often blow up their accounts.
Why Revenge Trading Is Bad
1. Emotional Decision-Making Replaces Strategy
When traders engage in revenge trading, they abandon their carefully crafted trading strategies and risk management rules. Instead, trades are made based on anger, frustration, or the desire to "get back" at the market. This emotional state clouds judgment, leading to irrational decisions such as increasing position sizes recklessly, disregarding stop-loss orders, or chasing trades without proper analysis. As a result, the likelihood of making successful trades plummets.
2. Escalating Losses and Account Blowups
The urge to recover losses quickly often leads traders to double down or over-leverage their positions, exposing a large portion of their capital to additional risk. Statistically, 80% of revenge trading ends disastrously, with only a small fraction experiencing temporary success before ultimately facing larger losses. This cycle of chasing losses can rapidly erode trading capital, making recovery increasingly difficult.
3. Psychological Burnout and Stress
Revenge trading is mentally and emotionally exhausting. The constant cycle of loss and frantic attempts to recover can lead to stress, depression, and burnout. This further impairs decision-making, creating a vicious cycle of poor performance and deteriorating mental health.
4. Long-Term Damage to Trading Habits
Repeatedly succumbing to revenge trading ingrains bad habits, making it difficult for traders to maintain discipline and consistency in the long run. This lack of consistency undermines the potential for sustainable profitability and can end trading careers prematurely.
Recent Real-World Examples
Recent years have seen numerous cautionary tales illustrating the dangers of revenge trading (all links are from r/wallstreetbets subreddit for learing/ educational purposes only):
$40,000 Lost on NVDA Options (2024). A trader repeatedly doubled down on Nvidia (NVDA) put options during its price rally in mid-2024. Despite initial small wins, the trader, driven by the urge to recover losses, continued to increase his position size, ultimately losing over $40,000.
$26,000 Lost in 20 Minutes on SPX. A Reddit user reported losing $26,000 in about 20 minutes trading the S&P 500 index (SPX) after prices dropped sharply. The loss was the result of impulsive trades made in an attempt to quickly recover from earlier setbacks.
From $27,000 to $0 in Three Days. Another trader turned $500 into $27,000 in just a few days, only to lose it all within 48 hours after a market reversal. Instead of taking profits or stepping back, the trader kept chasing losses with increasingly risky trades, ending up with nothing.
$100,000 Loss on a Yen Carry Trade. A trader, influenced by news of geopolitical tensions, made a large leveraged bet on the yen. After an initial loss, he refused to cut his losses and doubled down, ultimately losing $100,000 instead of accepting a smaller $30,000 hit.
More juicy stories are to be collected...
These stories are not isolated incidents. They are echoed across trading forums and social media, serving as stark warnings of how quickly revenge trading can destroy even substantial gains.
Conclusion
Revenge trading is DANGEROUS AND HARMFUL because it replaces rational, strategic decision-making with emotional reactions, leading to escalating financial losses, psychological distress, and long-term damage to trading discipline. The real-world examples from the past year underscore that no trader-regardless of experience-is immune to its risks. The best defense is to recognize the urge, step away, and return only with a clear, objective mindset and a disciplined strategy.
--
Best wishes,
@PandorraResearch Team 😎

If you think the 2025 bottom is in you couldn't be more wrongIf you think the bottom for 2025 is in and it's only up from here let me have what you're smoking.
Just a puff, please!
About 80% of social media retail traders are confidently calling a bottom, that's a major contrarian signal.
Herding equals danger!
If everyone is bullish, most are already positioned long leaving a few buyers to push prices higher.
It's known as "pain trade" where markets often move in the direction that causes the most discomfort.
Many of loudest voices are retail traders influencers chasing engagement, not portfolio managers or data driven strategists.
AMEX:SPY SP:SPX NASDAQ:QQQ AMEX:DIA NASDAQ:META NASDAQ:NVDA NASDAQ:MSFT NASDAQ:GOOG NASDAQ:AAPL NASDAQ:AMZN

MSFT Setup After EarningsEarnings season is heating up and Microsoft (MSFT) is once again in the spotlight. With its dominance in cloud and AI, the next move could be explosive.
Here’s how pro Im thinking my setting up:
🔹 $390 – A bold speculative entry for breakout hunters.
🔹 $365 – A defensive entry on post-earnings pullback to support.
🔹 $345 – The opportunity zone if a sharp drop offers value.
🎯 Profit Targets:
TP1: $410 – Psychological and technical resistance.
TP2: $426 – Momentum continuation level.
TP3: $445–$450 – Ambitious upside for long-term riders.
Whether you’re playing momentum or patiently buying dips, MSFT is offering clear levels. Stay sharp.
Disclaimer: This is not financial advice. All trading involves risk. Do your own research or consult a professional advisor before investing.

Microsoft in Focus Ahead of Key Earnings, AI Outlook Under WatchMacro:
- Microsoft (MSFT) climbed on cautious optimism ahead of major earnings and economic data.
- Four of the “Magnificent Seven,” AMZN, AAPL, META, and MSFT, are set to report, with investors focusing on Microsoft (MSFT) today.
- Wall Street expects EPS of 3.22 USD and revenue of 68.44 B USD, both up YoY. Microsoft’s strength in AI, cloud, and enterprise software, along with its continued investment in AI talent and solid dividend history, makes this a closely watched report.
- Key drivers will be its results, AI/cloud growth outlook, and forward guidance, while any surprises could shift the stock sharply.
Technical:
- MSFT recovered and tested the resistance at around 396, confluence with EMA78. The price is sideways, and we await a clearer breakout to determine the following direction.
- If MSFT breaks above 396, the price may approach the following resistance at 405, confluence with the 100% Fibonancci Extension.
- On the contrary, remaining below 396 may prompt a retest to the support at around 378, confluence with the broken descending channel.
Analysis by: Dat Tong, Senior Financial Markets Strategist at Exness

Microsoft's Downtrend Poised for Deeper RetracementsMSFT 4D TECHNICAL ANALYSIS 📉
OVERALL TREND
📉 DOWNTREND — Confirmed by the descending pivot structure, cluster of recent lower highs, and bearish rejection from the 430–455 zone. The downtrend is confirmed with a moderately confident score of 23.8%, with a Trend Score of -0.50.
🔴RESISTANCE ZONE
🔴 468.3500 — SELL STOPLOSS | PIVOT HIGH
🔴 455.7494 — SELL ORDER 2
🔴 430.2472 — SELL ORDER 1
🎯ENTRIES & TARGETS
🎯 381.6944 — SELL ORDER & | TP 1
🎯 340.8905 — SELL ORDER & | TP 2 | MID-PIVOT
🎯 310.8399 — SELL ORDER & TP 3
🎯 264.4180 — EXIT SELL & TP 4
🟢SUPPORT ZONE
🟢 253.2621 — BUY ORDER 1
🟢 226.1769 — BUY ORDER 2
🟢 213.4130 — BUY STOPLOSS | PIVOT LOW
✍️STRUCTURAL NOTES
Major lower high rejection seen near 455–468 zone—clearly defined by the last bullish failure to break above
Recent candles show moderate bullish defense near 380, but unable to create a higher high
All key short-term MAs (10–50) are bearish, with crossover confirmation stacking downward
Longer-term moving averages (100–200) show mixed signals; short-term selling strength remains dominant
Oscillators show mixed-to-weak bearish signals, with MACD and Awesome Oscillator suggesting negative momentum
📉TRADE OUTLOOK
📉 Bearish Continuation Bias with potential downside continuation toward TP3 @ 310.84 and TP4 @ 264.41
📈 Temporary bounce possible at 381.69–340.89 range, but expected to be corrective unless higher highs are confirmed
🔍 Watch for retest and rejection at 430.24 or 455.74 zones to validate reentry setups on the short side
🧪STRATEGY RECOMMENDATION
CONSERVATIVE APPROACH (Trend-Following):
— Entry: 381.69 (on rejection confirmation)
— TP: 340.89 / 310.84 / 264.41
— SL: Above 430.25
AGGRESSIVE REVERSAL PLAY:
— Entry: 253.26 (Buy Order)
— TP: 310.84 / 340.89
— SL: Below 213.41
“Discipline | Consistency | PAY-tience™”

Stock Market Forecast | TSLA NVDA AAPL AMZN META MSFTStock Market Forecast | NASDAQ:QQQ AMEX:SPY
Mag 7 Forecast | NASDAQ:TSLA NASDAQ:NVDA AAPL AMZN META MSFT

Is Stock Market Bottom Here or Continue Crashing?Stock Market Analysis | NASDAQ:QQQ AMEX:SPY
Mag 7 Analysis | NASDAQ:TSLA NASDAQ:NVDA AAPL AMZN META GOOGL MSFT

Immediate leap on MSFT! 🔉Sound on!🔉
📣Make sure to watch fullscreen!📣
Thank you as always for watching my videos. I hope that you learned something very educational! Please feel free to like, share, and comment on this post. Remember only risk what you are willing to lose. Trading is very risky but it can change your life!

MICROSOFT On 4th largest correction in 15 years. Buy or trap?Microsoft (MSFT) has corrected by -26.50% from its All Time High (ATH), representing the 4th biggest correction since June 2010, which was the first pull-ack after the historic 2008 Housing Crisis.
At the same time the 1W RSI hit the 30.00 oversold limit for the first time since that low of June 2010! Not even the Housing bottom didn't exhibit such low 1W RSI.
All while the current Tariff War correction stopped a little before testing the 1W MA200 (orange trend-line), which has been the long-term Support since 2011 and was last hit (for the 2nd time during that time span) in December 2022 during the previous Inflation Crisis.
As a result, this is a unique long-term buy opportunity for such a tech giant. The 2010 rebound hit the 0.786 Fibonacci level before pulling back while the rally that was initiated after the 2022 Inflation Crisis bottom reached +117.45%.
Based on the above, we have a medium-term Target on MSFT at $440 (Fib 0.786) and a long-term at $700 (+100%).
-------------------------------------------------------------------------------
** Please LIKE 👍, FOLLOW ✅, SHARE 🙌 and COMMENT ✍ if you enjoy this idea! Also share your ideas and charts in the comments section below! This is best way to keep it relevant, support us, keep the content here free and allow the idea to reach as many people as possible. **
-------------------------------------------------------------------------------
💸💸💸💸💸💸
👇 👇 👇 👇 👇 👇

Microsoft Regains Top Spot as Most Valuable Company Microsoft Corp. (NASDAQ: NASDAQ:MSFT ) has reclaimed its place as the world’s most valuable public company. The tech giant now holds a market capitalization of $2.64 trillion, surpassing Apple Inc. (NASDAQ: NASDAQ:AAPL ), which fell to $2.59 trillion.
Apple’s sharp decline followed a major 23% sell-off over four days. This came after President Trump announced sweeping new tariffs. These tariffs hit countries like China, India, Vietnam, and Brazil. Apple’s heavy reliance on these regions for manufacturing intensified investor concerns.
Meanwhile, Microsoft appears less exposed to tariff risks. Analysts say the company remains a stable large-cap stock during ongoing market volatility. Microsoft previously held the top spot briefly last year but was overtaken by Apple and Nvidia (NASDAQ: NASDAQ:NVDA ), now ranked third at $2.35 trillion.
Technical Analysis
Microsoft’s stock is trading at $383.15, up 8.06%, with a high of $387.07 so far today. The price rebounded sharply from the support level near $345. This zone had previously acted as resistance in late 2021 and early 2022. It now serves as strong support. The volume spike confirms buyer interest at this level.
The projected path shows a potential bounce toward $468, the recent high. If the trend holds, Microsoft may attempt a new all-time high.

Is Stock Market Bouncing Here or Continue Crashing?Stock Market Analysis | NASDAQ:QQQ & AMEX:SPY
Mag 7 Analysis | NASDAQ:TSLA NASDAQ:NVDA AAPL AMZN MSFT GOOGL META

QQQ: Tariff ReactionNASDAQ:QQQ As China strikes back with a 34% tariff on U.S. goods starting April 10, the global trade landscape could see some serious turbulence. This follows Trump's tariff moves, and the market's already feeling it: QQQ’s daily chart shows capitulation volume on the table, suggesting a potential bounce— IF tariffs ease.
But until these trade tensions subside, it's likely to be a rocky ride. Tariffs push prices up, inflation lingers, and the Fed finds itself boxed in. The outcome? A market crash, recession, and stagflation—yet, there's still hope for a bounce, depending on how these factors play out.
Manage the levels with us at ChartsCoach.

Microsoft - A Little Lower And Much Higher!Microsoft ( NASDAQ:MSFT ) is about to retest strong support:
Click chart above to see the detailed analysis👆🏻
In mid 2024 Microsoft perfectly retested the previous channel resistance trendline and the recent weakness has not been unexpected at all. However the overall trend still remains rather bullish and if Microsoft retests the previous all time high, a significant move will most likely follow.
Levels to watch: $350
Keep your long term vision!
Philip (BasicTrading)

I find value here on MSFTMSFT recently retraced back to $380, fueled by headlines about Trump's tariffs. However, I find this retracement an overreaction. According to my calculations, MSFT is fairly valued now. Take this chance to add it to your portfolio today.

Is Stock Market Going to Crash?Stock Market Analysis | NASDAQ:QQQ AMEX:SPY
Mag 7 Price Forecast | NASDAQ:TSLA NASDAQ:NVDA AAPL AMZN META MSFT GOOGL

#MSFT - HTF Distribution - Waiting for key levels to be taken.Clear HTF distribution. There’s a potential pullback (if it occurs) into the 1W PHOB before a downward continuation.
Personally, I’d like to get involved between the HTF Demand zone and the 1M PHOB + 4W HOB, which, in my opinion, could serve as a potential reversal level, so keep an 👀 out

Stock Market Forecast | TSLA NVDA AAPL AMZN META MSFTStock Market Forecast | NASDAQ:QQQ AMEX:SPY
Mag 7 Forecast | TSLA NASDAQ:NVDA AAPL AMZN META MSFT NASDAQ:GOOG

Sharp reversal in US marketsAmid market volatility and uncertainty, US stock indices experienced a sharp decline last week. The Dow Jones Index (#DJI30) fell by 3.5%, the S&P 500 (#SP500) dropped by 4.1%, and the Nasdaq-100 (#NQ100) lost 5.5%.
Investors reacted nervously to new economic data, including rising inflation and expectations of interest rate hikes, leading to a sell-off in stocks and a decline in key indices. The drop was particularly significant in the technology and consumer sectors, where companies like Apple and Tesla lost around 6-7% of their value.
However, starting March 13, 2025, the indices began to recover: #DJI30 gained 2.3%, #SP500 rose by 2.5%, and #NQ100 increased by 3.1%.
The recent rebound in US stock indices has been driven by several factors that restored investor confidence. Let’s take a closer look at the main reasons:
• Improvement in unemployment data: Labor market statistics played a crucial role in the market recovery. The US unemployment rate fell to 3.4% in February 2025, marking a record low in recent decades. This indicates strong employment levels and economic resilience, boosting investor optimism and supporting stock market growth.
• Stabilization of inflation and interest rate expectations: Although inflation in the US remains high, recent data showed a slowdown in its growth. Reduced inflationary pressure gave investors hope that the Federal Reserve (Fed) might slow down the pace of interest rate hikes. This was perceived as a sign of potential economic stabilization, positively impacting stock indices.
• Growth in consumer spending: One of the key drivers of the recent market recovery has been the increase in consumer spending. In Q1 2025, consumer demand in the US showed strong performance, serving as an essential indicator of economic activity. Increased spending on goods and services supports business stability and enhances corporate revenues, which, in turn, stimulates stock growth.
• Absence of new geopolitical risks: In recent weeks, there have been no major geopolitical crises or new threats on the international stage. This helped financial markets stabilize, as investors could focus on economic data and corporate earnings reports, contributing to stock index growth.
• Positive corporate earnings reports:
• #Microsoft (MSFT): Microsoft shares rose by 4.2% after reporting strong quarterly results, driven by growth in cloud services and software revenue.
• #Google (GOOGL): Alphabet’s stock increased by 3.7% due to higher advertising revenue and improved forecasts for upcoming quarters.
• #Apple (AAPL): Apple shares climbed 2.9%, supported by strong sales of new products and rising revenue from services.
• #Tesla (TSLA): Tesla stock surged 5.6%, fueled by strong electric vehicle sales growth and optimistic profit projections for the next quarter.
These companies demonstrated significant growth on the back of improved financial performance, strengthening investor confidence and aiding the stock market’s recovery amid volatility.
So despite last week’s market downturn, the current situation in the US stock market signals a potential recovery and a more positive trend in the coming weeks.

Microsoft (MSFT): The "Can’t Go Wrong" Stock... Until It DoesAh, Microsoft—the tech titan that could probably survive a meteor impact. 🌍☄️ With a market cap so large it could buy entire countries and still have spare change for a few yachts, MSFT is the stock that everyone loves... even when it’s overvalued. But hey, let’s take a look at the "genius" behind the current price action. 🔍💰
📊 The Almighty Stock Performance (Because Fundamentals Don’t Matter Anymore?)
📉 Price: $385.76 (up a whole 0.00584%! Call the champagne guy! 🍾)
📊 Intraday High: $387.88
📉 Intraday Low: $383.27 (because even Microsoft has bad days, right? 😅)
🔮 200-day moving average: $423.98 (oh look, it's trading below that... bearish much? 🐻)
So, let me get this straight. MSFT is 7.80% down year-to-date, but analysts are still screaming “BUY! 🚀.” Sure, because blindly trusting price targets has always worked out well for retail investors. 🤑
💰 Valuation: Overpriced? Who Cares, It’s Microsoft!
📢 Intrinsic Value Estimate: $316.34
😬 Current Price: $385.76
💰 Overvaluation? About 18%
But let’s be honest—does valuation even matter anymore? If people are throwing money at meme coins, why not pay a premium for MSFT? 🤷♂️ It’s basically a subscription service at this point—you pay every month, and the stock just keeps draining your wallet. 💸
🤖 AI Goldmine or Just Another Buzzword?
Microsoft has been riding the AI hype train harder than a teenager with ChatGPT. 🚂💨 Their enterprise AI growth is over 100%, and they’re pulling in a $13 billion annual run rate from AI services. But sure, let’s pretend that no one remembers the last time “the next big thing” crashed and burned. (cough dot-com bubble cough). 💀💾
Evercore analysts claim MSFT will dominate AI for enterprises. Well, duh. If you’re an enterprise and don’t buy Microsoft AI services, Satya Nadella himself might show up at your office and force you to install Windows 11. 🏢💻
📉 Risk Factors? No Way! MSFT is Invincible... Right?
🦅 Hawkish Fed = Potential Market Sell-Off (But don’t worry, just HODL, right? 🤡)
🚀 Tech Bubble Concerns (Microsoft will totally be the exception… like every overhyped stock before it. 😬)
🧐 Overvaluation? Pfft, who cares? (People said the same about Tesla at $400. Look how that turned out. 🪦)
📢 Analyst Hot Takes (Because They’re Always Right 😂)
📊 D.A. Davidson: Upgraded to Buy with a price target of $450. (Ah yes, let’s just throw numbers out there. Why not $500? $600? 🚀)
🔮 UBS: Predicts $3,200 for gold, but Microsoft will somehow go even higher. (Probably. Because… reasons. 🤷♂️)
🎭 Final Thoughts: Buy? Sell? Just Panic?
Microsoft is basically the “safe” tech stock everyone clings to while pretending that the market isn’t built on dreams and overleveraged hedge funds. 🏦💰 If you believe in the power of monopolies, overpriced AI services, and analysts pulling price targets out of thin air, then MSFT is your golden ticket. 🎟️💎
Otherwise, maybe—just maybe—waiting for a dip below fair value isn’t the worst idea in the world. But what do I know? I’m just some guy on the internet. 🤷♂️
🚀💸 Good luck, traders. You’ll need it. 😈📉
💬 What do you think? Drop your thoughts below! 👇🔥

Is the Stock Market Bottom in? Stock market analysis | NASDAQ:QQQ AMEX:SPY NASDAQ:SMH
Mag 7 Price Forecast | TSLA NASDAQ:NVDA AAPL AMZN META MSFT GOOGL

MICROSOFT Channel Down bottom formation targets $440.Microsoft (MSFT) has been trading within a Channel Down since the July 05 2024 High. The stock is on its latest Bearish Leg in the past 3 months and almost completed a -17.62% decline, similar with the Bearish Leg that led to the August 05 2024 Low.
As the 1D RSI has Double Bottomed, which is what it did on the April 30 2024 Low that kick started a rally of +20.63%, we expect the stock to initiate its new Bullish Leg of the Channel. The previous one was +18.16%, so we expect a similar range and target $440.
-------------------------------------------------------------------------------
** Please LIKE 👍, FOLLOW ✅, SHARE 🙌 and COMMENT ✍ if you enjoy this idea! Also share your ideas and charts in the comments section below! This is best way to keep it relevant, support us, keep the content here free and allow the idea to reach as many people as possible. **
-------------------------------------------------------------------------------
💸💸💸💸💸💸
👇 👇 👇 👇 👇 👇

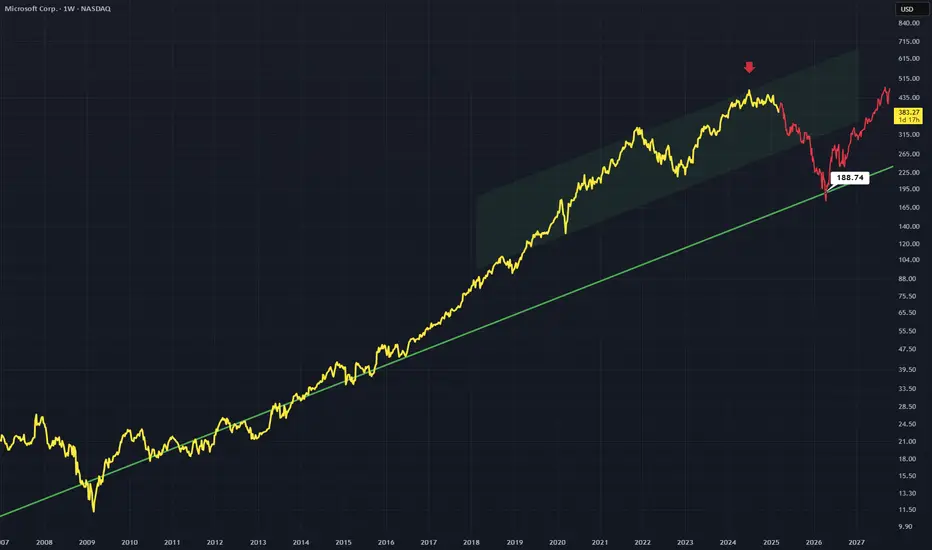
MSFT - Trend Line TestMSFT has formed a channel way above a dominant trend line
This is coupled with a double top (higher high double top) suggesting after a pull back bulls will return
I think there will be downward movement to test this trend line in green again
Weekly timeframe