MSFT Poised for More UpsideMSFT has followed through nicely after bouncing out of our expected long term support zone below 254. Price recently consolidated after reaching the 1.618 fib extension, but has held short term moving average support and now looks ready to continue higher.
Resistance could come in at 283.6, but we think the higher likelihood is to see price re-test the overhead gap range of 292-296 in the coming days.
Microsoft (MSFT)

Microsoft Targeting An Equality TestIn this update we review the recent price action in Microsoft and identify the next high probability trading opportunities and price objectives


MICROSOFT - Short PositionMicrosoft's Lead Kinect and HoloLens Developer Leaves the Company After Abuse Allegations

Radar recap before the breakoutPROFZERO'S TAKE - RADAR RECAP
Ever since the very first edition of our daily Parlay, Profs have repeatedly cited their radar to keep track of ongoing macroeconomic developments and forming views. It's about time then
for a first full-blown recap of what we are looking at right now, and how do we see the next steps moving:
World politics: The war in Ukraine has reshaped European geopolitics, forcing the EU to rethink its entire energy supply and security policy off from Russia, other than bringing the continent back to reassessing the readiness of its armed forces. The blockade of the port of Odesa exacerbated supply-chain tensions that had been simmering since 2021, pushing commodity prices to all-time highs in energy and fertilizers and ushering the risk of famine and social unrest in the Middle East and Africa due to shortage of cereals and calories at large. Meanwhile, the relationships between the U.S. and China remain tense over Taiwan, as the island remains exposed to a potential Chinese invasion - Bearish
Monetary policy: Central banks around the world have finally taken inflation seriously, launching interest rate hike and balance sheet trimming plans in an attempt to cool price surges and yet preserve growth and employment in the real economy. U.S. data in May were in fact supportive, with Main Street adding 390,000 jobs and keeping unemployment as low as 3.6%. Yet, the effects of higher interest rates are going to be felt only as they trickle down through the economy, in the form of costlier mortgages for homeowners and more expensive or altogether barred access to debt financing for sub-investment grade nations and corporates. As a result, defaults could sweep the economy, as already seen by the failure of Sri Lanka to pay its foreign-currency debt; the looming default of Russia; and the collapse back in 2021 of Chinese constructions giant Evergrande - Neutral
Equities: The secular bull run hit by equities since the fall of Lehman Brothers in 2008, and fueled by loose monetary and fiscal policy on both shores of the Atlantic, hit a major stop in Q1 2022, when investors rushed to the door, spooked by the prospects of Regulators draining liquidity from the system. As a result, Nasdaq plunged 30% from peak (November 2021) to trough (April 2022), while S&P 500 only teetered on the brink of a bear market (negative 19.9% peak-to-trough). Investor fled Growth stocks whose profits are deep in the future, hence exposed to greater discounting by higher interest rates, favoring Value equities thanks to the solidity of their balance sheets and capacity to generate income via dividends. ProfZero argues that within the very Growth space, Value-like equities do already exists - tech giant Microsoft (MSFT) for instance is America's best-rated company (AAA/stable) - Neutral
Commodities: After a lost decade, and crude oil trading even in negative price territory for one day in 2020 (April 20, WTI crude contract settling at negative 37.63/boe), commodities came back roaring in 2022, in what analysts at Goldman Sachs have already dubbed the beginning of a new supercycle. ProfZero concurs that commodities - and their supply chains - have been taken for granted for too long; now, in the wake of de-globalization talks, developed as well as emerging economies find themselves rattled by the prospects of unsustainably high - or even unaccessible - key commodities like fuel and fertilizers, or even worse calories. Thinking one step ahead, ProfOne has set its eyes on the minerals of the future - cobalt, lithium and nickel - reminding that these are also highly concentrated in a handful of areas around the globe, thus possibly falling into the same supply trap of the commodities of the past century - Bullish
Blockchain assets: A unprecedented "crypto winter" has gripped investors in the blockchain space, first sending BTC from all-time at USD 68,990 in November 2021 to USD 25,350 on May 12, 2022 (63% peak-to-trough), then decreeing the collapse of Terra/LUNA project in just 3 days on the second week of May this year. Yet, the blockchain space is showing remarkable resilience, with BTC resisting further slides and in fact potentially preparing for a new "golden age", as foreseen by venture capital fund Andreesen Horowitz. ProfZero remains focused on the superiority of the blockchain as a technology, capable to shape the next decade in information processing, automotive, entertainment, finance and healthcare - Bullish

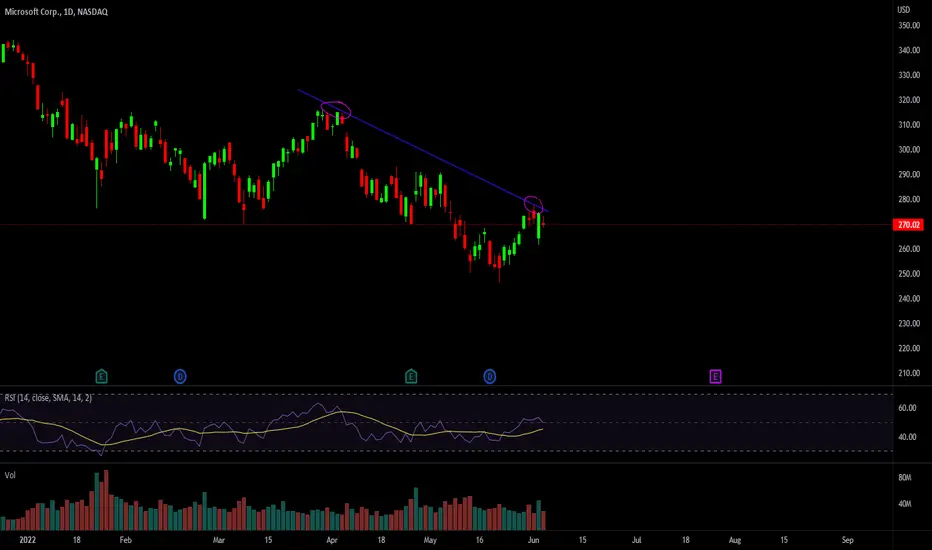
MSFT Potential for bearish momentum | 8th June 2022With RSI moving within a downtrend channel , we have a bearish bias that price will drop to our take profit at 246.88 where the horizontal swing low support is from our sell entry at 275.80 in line with the horizontal overlap resistance, 61.8% fibonacci projection and 38.2% fibonacci retracement . Alternatively, price may break entry structure and head for stop loss at 290.14 where the horizontal swing high resistance and 61.8% fibonacci retracement are.
Any opinions, news, research, analyses, prices, other information, or links to third-party sites contained on this website are provided on an "as-is" basis, as general market commentary, and do not constitute investment advice. The market commentary has not been prepared in accordance with legal requirements designed to promote the independence of investment research, and it is therefore not subject to any prohibition on dealing ahead of dissemination. Although this commentary is not produced by an independent source, FXCM takes all sufficient steps to eliminate or prevent any conflicts of interest arising out of the production and dissemination of this communication. The employees of FXCM commit to acting in the clients' best interests and represent their views without misleading, deceiving, or otherwise impairing the clients' ability to make informed investment decisions. For more information about the FXCM's internal organizational and administrative arrangements for the prevention of conflicts, please refer to the Firms' Managing Conflicts Policy. Please ensure that you read and understand our Full Disclaimer and Liability provision concerning the foregoing Information, which can be accessed on the website. Disclaimer

Placed heavy short position on MSFT EODBased on the complexion of the market and weight of evidence of the market structure I continue to look for downward pressure.
I will be in this position up to this Friday; however, may choose to exit within 1-2 days.
Speaking of Friday: Friday, June 10th CPI Expectations.
I'm expecting to see a 1.6% increase for the month of May, which will all but destroy the narrative by the Fed that inflation is coming down and the worst is behind us.
Based on the M2 Money Supply and correlating that with money growth, GDP, and a new element total debt of the economy -- there is a tight correlation al the way back to the 1960's with these new formulations.
CPI is understating by ~ 10% which means we "should" be seeing further price increases in price inflation.
I do not believe we see the inflation peak until early 2023 where that would peak around 10.6%. I believe the Weight of the Evidence is Statistically on my side that we have not seen the end of price inflation.
This might push that barrel price of oil up above the $135 a barrel and push gasoline prices even higher.
The downward pressure goes for the high bets tech sector. If you go to the Facebook link (below and in my profile) you'll find some additional charts and annotations.
In Bear Markets, the weight of the evidence is when the bulls are unable to maintain and sustain market sentiment when the markets gap-up and they fail to control the narrative.

MSFT MICROSOFTA higher high has been formed suggesting a short term change in trend.
However, there is no confirmation until the $316 region is taken out.
As long as we remain below $316, expect bounces to be sold.
In the near term, I expect $250-$260 zone to be a good buying opportunity.
As long as last week's $246 low holds, expect dips to be bought for a move to 296-305 supply zone.
Bullish in short term, bearish long term (as long as we’re below 316)

Judgement Week for $SPX $SPY is Upon UsReally not sure what to expect, but the level of bearishness combined with a few gigantic stock splits ($AMZN splits Monday 6/6, $GOOGL 7/15, and $SHOP 6/22) could propel the marketing into the 4400 range. I believe that would be the MAXIMUM pain for bears, then continue down.
Reasons for my bullish short tern outlook.
1. $AMZN stock spilt on 6/6
2. Incredible amount of PUTS across the bored leading to a sense of over hedging
3. TTM Squeeze on $SPX daily looks primed to rip towards the upside
4. WeBull comments section is super bearish. lol

BTC trying to bounce back but a hurricane set to cool optimismINVESTMENT CONTEXT
While OPEC+ agreed to boost crude oil production in the coming months, in a gesture of reconciliation to the U.S., it still remains unclear whether Saudi Arabia, the cartel's largest producer, will agree to further isolate economically Russia
BlackRock's CEO, Larry Fink, sees inflation to remain high for "years" due to the persisting effects of supply shocks
After raising interest rates on April 29, the Fed is now about to kick-off the plan to shrink its USD 8.9tn balance sheet
U.S. corporate profits fell the most in two years in Q1 2022; in the past year, earnings at 620 companies (of the 3,000 listed entities) fell short of interest payments — well above pre-pandemic 2019 levels
President Volodymyr Zelensky said Russian forces have seized a fifth of Ukraine, as the war passed the 100-day milestone
Russia missed a USD 1.9mln payment, inching closer to a default that would trigger billions of CDS insurance contracts
PROFZERO'S TAKE
In a rollercoaster trading day, equities shook off pre-market losses to close deep into green territory. Traders are mildly attempting to restore risk-on attitude, even in the wake of Microsoft (MSFT) lowering fourth-quarter guidance for both revenue and earnings, citing unfavorable foreign exchange rates. ProfZero maintains its cool aplomb: while welcoming the prospective second straight green weekly candle, the overarching narrative still hasn't found sufficient grounding for a rebound to be called - war in Ukraine still has no clearly defined endgame, China has but started softly lifting COVID restrictions and this week showed inflation in Europe has not peaked yet. Hot summer ahead? Cruel summer, rather
ProfZero is awaiting today's nonfarm payrolls and unemployment rate data to see whether the real economy is keeping the upbeat tone much needed to absorb inflation; earlier indications point to slowing hiring activity coupled with companies vying for talent, even at considerably heftier wages. As shared on Step99 podcast on June 2, ProfZero reminds that the inflation equation simply can't be escaped: it's going to be paid either by companies in case they'll opt to internalize higher costs (including salaries), or by households through higher retail prices (United Nations, U.N., food price index surged 73.9% in May 2022 as compared to 2020)
On June 2 Italy's natural gas distributor Snam announced it took over a 5-bcm strong regasification vessel from Golar LNG, as attempts to diversify energy supply in Europe gather pace. Other than the cost of energy itself, ProfZero is attentively looking at the freight market as a new source of possible bottlenecks: while pipelines from Russia allowed for seamless, low-cost primary transportation, the construction of brand-new seaborne supply chains will shift much market power into the hands of traders (Trafigura, Gunvor) and logistics middlemen. Speak of inflation - think of trading routes and supply-chain nodes, and you'll see who's behind it
BTC testing again the high USD 30k bracket - or simply draining liquidity from altcoins?
PROFONE's TAKE
Following yesterday’s thoughts on lithium, ProfOne’s sees the very same pressures on nickel. The price of the metal used in stainless steel and electric-vehicle batteries gained more than 50% since the beginning of 2022, including a one-day market rout on March 8 that sent prices up 250% intraday, and had the London Metals Exchange shut trading to contain credit risk . Some stainless steel factories in Europe already had to cut production (Acerinox) on stable supply concerns. Countries are looking for ways to substitute supplies from Russia, which produces a fifth of the world’s purest-grade nickel. Thus again on de-globalization talks: around 80% of the world’s nickel processing is based in China and 60% of the world’s nickel mines are Chinese owned. ProfZero and ProfOne are starting to wonder what actually was on the agenda at Davos just 10 days ago...


Stocks Surge Ahead of NFPGreat groundwork in stock indices all week, terrific technical patterns developed to usher strength, and leadership from Tech. Let's take a look at the landscape ahead of Nonfarm Payroll.

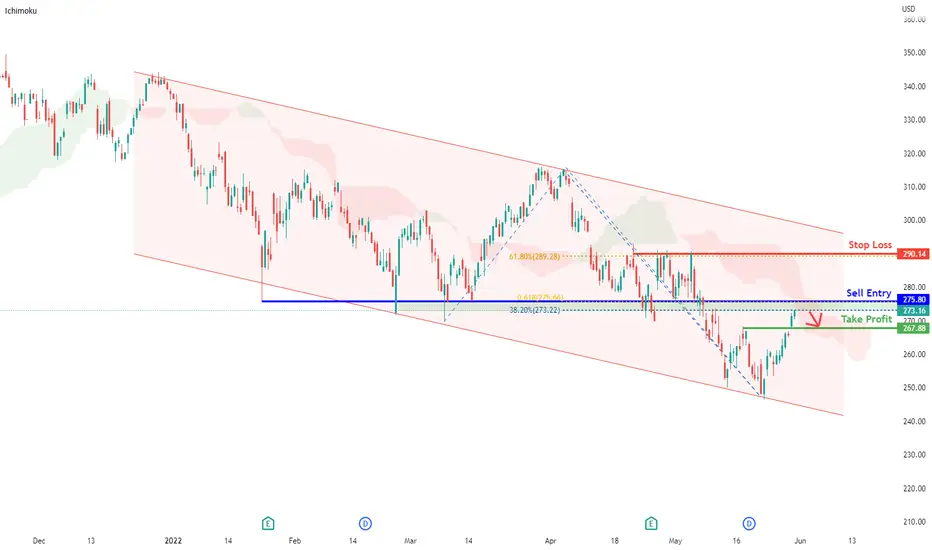
MSFT Potential for bearish momentum | 2nd June 2022With RSI moving within a downtrend channel , we have a bearish bias that price will drop to our take profit at 246.88 where the horizontal swing low support is from our sell entry at 275.80 in line with the horizontal overlap resistance, 61.8% fibonacci projection and 38.2% fibonacci retracement . Alternatively, price may break entry structure and head for stop loss at 290.14 where the horizontal swing high resistance and 61.8% fibonacci retracement are.
Any opinions, news, research, analyses, prices, other information, or links to third-party sites contained on this website are provided on an "as-is" basis, as general market commentary, and do not constitute investment advice. The market commentary has not been prepared in accordance with legal requirements designed to promote the independence of investment research, and it is therefore not subject to any prohibition on dealing ahead of dissemination. Although this commentary is not produced by an independent source, FXCM takes all sufficient steps to eliminate or prevent any conflicts of interest arising out of the production and dissemination of this communication. The employees of FXCM commit to acting in the clients' best interests and represent their views without misleading, deceiving, or otherwise impairing the clients' ability to make informed investment decisions. For more information about the FXCM's internal organizational and administrative arrangements for the prevention of conflicts, please refer to the Firms' Managing Conflicts Policy. Please ensure that you read and understand our Full Disclaimer and Liability provision concerning the foregoing Information, which can be accessed on the website. Disclaimer

DOW ANALISE
The state of affairs on the dow ts kamipanii were distributed relative to the indices on the principle of relative strength in this order
despite the fact that many sectors still do not show confident bullish growth, we already have some strong leaders, this company UNH is on the 2nd place, GS is on the 3rd place, HD is on the 4th place with you and me MSFT in 5th place we have the company AMGN
look at the relative strength indices that absolutely clearly show our leaders and outsiders
But who is the outsider at the moment , now the outsider of the company is the WBA and the relative strength index absolutely clearly shows the position of the shares to the market .
I always use this technical parameter together with the foundation parameters when analyzing the market
See you for new reviews !
Click like subscribe necessarily if the review came in! Then I will post more ideas .
My chat for learning and analysis Wyckoff Analytics search in chats and subscribe
Friends, I conduct training in an individual format and in a limited number of students, since a large number will interfere with my trading!
The training course includes :
The Wyckoff Method
Demark method
VSA
A trading method tailored to your psychotype
Psychology of trading
For details, write in a personal message
I can also introduce you to my own unique indicators , of my own design
Wykoff Zone ( You determine the activity and zones of smart money and also gives buy and sell signals )
The Demark indicator , which has no analogues on the platform - since most of the indicator are far from the essence of the Dymerka technique and are too simplified , which violates the basics of the principle
For investors, I can shift a 2-week lazy investor course where you can learn how to invest correctly and in which stocks + the tic-tac-toe method
supplemented
with your own developments taking into account the imbalance of supply and demand
The Wyckoff Line indicator was created based on the activity of professionals and the identification of liquidity zones to which the price is attracted.
Remember that the market is driven only by supply and demand. No technical indicators will tell you in advance that there has been an imbalance of supply or demand.
Listening to the news, you can lead yourself into a state of incorrect decision, so make decisions only on the activity zones of professionals. By understanding where the imbalance of supply and demand occurs, you can correctly build your work strategy.
The indicator has a smart algorithm that takes into account the activity zones on several timeframes that are above the working schedule.
The indicator also has a VSA system that determines the entry point in order to buy or sell a certain instrument. The entry point is determined by an imbalance of volume and price based on the principle of lack of demand, or lack of supply in liquid zones.
Take a look at "Figure 1", which clearly shows the test of the offer after which the price reached the next level of liquidity in WMT shares
The following example clearly shows a purchase after a downtrend, which, after passing through the liquidity zone, determined a clear signal to buy AAPL shares.
The essence of the indicator is that a high volume is always a liquidity zone to which the price will constantly strive. The indicator determines the liquidity zones of professionals that you set on higher timeframes using certain settings of the high volume bar. And together with the package of indicators, I provide a training video where I tell you how to use this indicator. And I also give some author's settings and recommendations for entering or exiting a position.
Now let's analyze the sell signal. Here is an example of one of the sell signals in which the indicator has clearly worked
The price reached the liquidity zone and he signaled three times that it was time to enter the position. Then, using completely different entry techniques, you could sell the KO stock or, if you were trending upwards and your techniques did not involve selling, you could simply exit your position in time.
The uniqueness of the indicator lies in the fact that it works on such a chart as tic-tac-toe. Having established liquidity zones, you can use the signal of this indicator to enter a position without any market noise. See the example below , where the entry into the MSFT promotion was carried out:
snapshot
To start using the indicator, you need to write to me in a personal message.
I will send you instructions for using the indicator and my recommendations (how to enter and exit the position) and the settings of the indicator.
During the entire use of the indicator, you can receive free support and advice from me by writing to me in private messages.
The ability to use the indicator in different languages: I will provide you with a video instruction for setting up and instructions for use in your native language.
Available languages for using the indicator: Russian, English, Chinese, Spanish, German.
The translation of the indicator settings into various languages is currently in progress.
The subscription price for the indicator is $20.
Buying an indicator for unlimited use is $300.

MSFT Potential for bearish momentum | 31th May 2022With prices reversing off the ichimoku indicator, we have a bearish bias that price will drop to our take profit at 267.88 where the horizontal pullback support is from our sell entry at 275.80 in line with the horizontal overlap resistance, 61.8% fibonacci projection and 38.2% fibonacci retracement . Alternatively, price may break entry structure and head for stop loss at 290.14 where the horizontal swing high resistance and 61.8% fibonacci retracement are.
Any opinions, news, research, analyses, prices, other information, or links to third-party sites contained on this website are provided on an "as-is" basis, as general market commentary, and do not constitute investment advice. The market commentary has not been prepared in accordance with legal requirements designed to promote the independence of investment research, and it is therefore not subject to any prohibition on dealing ahead of dissemination. Although this commentary is not produced by an independent source, FXCM takes all sufficient steps to eliminate or prevent any conflicts of interest arising out of the production and dissemination of this communication. The employees of FXCM commit to acting in the clients' best interests and represent their views without misleading, deceiving, or otherwise impairing the clients' ability to make informed investment decisions. For more information about the FXCM's internal organizational and administrative arrangements for the prevention of conflicts, please refer to the Firms' Managing Conflicts Policy. Please ensure that you read and understand our Full Disclaimer and Liability provision concerning the foregoing Information, which can be accessed on the website.
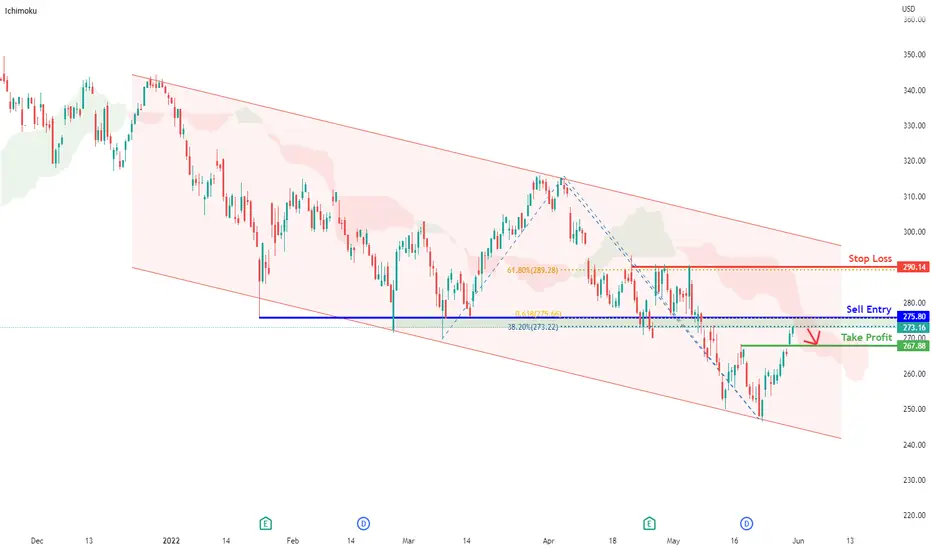
MSFT Potential for bearish momentum | 30th May 2022With prices reversing off the ichimoku indicator, we have a bearish bias that price will drop to our take profit at 267.88 where the horizontal pullback support is from our sell entry at 275.80 in line with the horizontal overlap resistance, 61.8% fibonacci projection and 38.2% fibonacci retracement . Alternatively, price may break entry structure and head for stop loss at 290.14 where the horizontal swing high resistance and 61.8% fibonacci retracement are.
Any opinions, news, research, analyses, prices, other information, or links to third-party sites contained on this website are provided on an "as-is" basis, as general market commentary, and do not constitute investment advice. The market commentary has not been prepared in accordance with legal requirements designed to promote the independence of investment research, and it is therefore not subject to any prohibition on dealing ahead of dissemination. Although this commentary is not produced by an independent source, FXCM takes all sufficient steps to eliminate or prevent any conflicts of interest arising out of the production and dissemination of this communication. The employees of FXCM commit to acting in the clients' best interests and represent their views without misleading, deceiving, or otherwise impairing the clients' ability to make informed investment decisions. For more information about the FXCM's internal organizational and administrative arrangements for the prevention of conflicts, please refer to the Firms' Managing Conflicts Policy. Please ensure that you read and understand our Full Disclaimer and Liability provision concerning the foregoing Information, which can be accessed on the website.
MSFT $315 August TargetLooking for a nice rebound on MSFT. Lower volumes at current levels and could start to see several levels of resistance on the way up. I have personally entered into 6-17 $280, $295, $300, $325 & $335 calls.

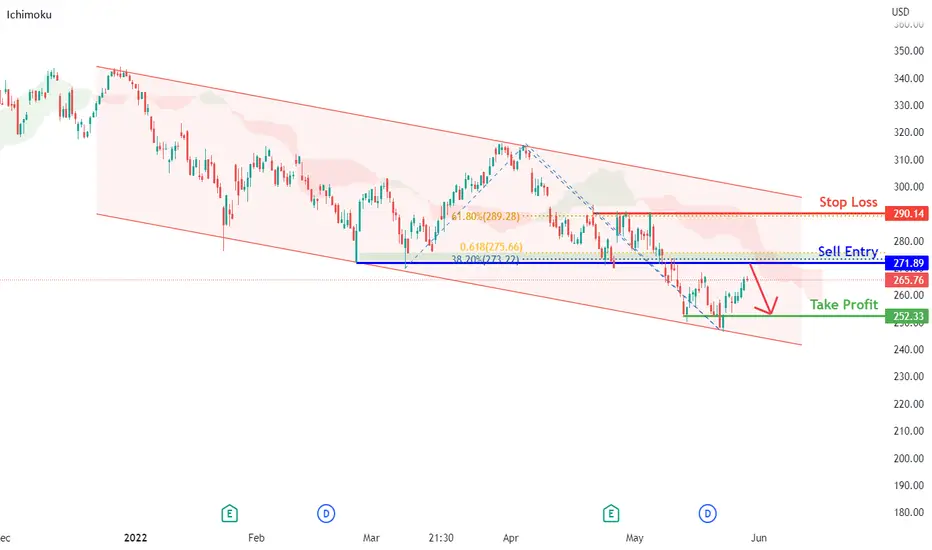
MSFT Potential for bearish momentum | 27th May 2022With prices below the ichimoku indicator, we have a bearish bias that price will drop to our take profit at 252.33 where the horizontal pullback support is from our sell entry at 271.89 in line with the horizontal overlap resistance, 61.8% fibonacci projection and 38.2% fibonacci retracement . Alternatively, price may break entry structure and head for stop loss at 290.14 where the horizontal swing high resistance and 61.8% fibonacci retracement are.
Any opinions, news, research, analyses, prices, other information, or links to third-party sites contained on this website are provided on an "as-is" basis, as general market commentary, and do not constitute investment advice. The market commentary has not been prepared in accordance with legal requirements designed to promote the independence of investment research, and it is therefore not subject to any prohibition on dealing ahead of dissemination. Although this commentary is not produced by an independent source, FXCM takes all sufficient steps to eliminate or prevent any conflicts of interest arising out of the production and dissemination of this communication. The employees of FXCM commit to acting in the clients' best interests and represent their views without misleading, deceiving, or otherwise impairing the clients' ability to make informed investment decisions. For more information about the FXCM's internal organizational and administrative arrangements for the prevention of conflicts, please refer to the Firms' Managing Conflicts Policy. Please ensure that you read and understand our Full Disclaimer and Liability provision concerning the foregoing Information, which can be accessed on the website.
Bearish breakdown for MSFT on the Fibonacci Bollinger BandThe monthly chart for Microsoft (MSFT) shows a breakdown below the upper band (red line) of the Fibonacci Bollinger Bands (FBB) indicator. While it is likely that MSFT will bounce for the time being, as inflation worries cool and tech stocks attempt a rally, the upper band will likely act as resistance. If the price rebounds it might be hard to sustain a breakout above $300. While I like MSFT as much as anyone else, the charts do not lie. The chart is showing that there is a long-term mean reversion occurring in the price of MSFT. The white line is the standard deviation basis for the monthly chart which reflects the downside potential. It's quite steep and the yearly oscillators are saying MSFT is primed to correct down to this level. All of this will unfold slowly (months to years) and fakeouts might trap some bulls. Is your MSFT position prepared for a worst-case scenario reversion to the mean? Trade wisely.
Not financial advice.
