Msftlong

MSFT - LongMSFT bounce back from the long trendline,
Triangle will be ended, there is a chance for a breakout.

MSFT INV H&Sholding that support trendline well, if it can hold above that .618 I'm bullish, i can see an inv h&s, break that neckline i can see a strong push to 220.
PT 220
im looking at 220C 12/18

MSFT LongNice accumulation , ascending triangle and ready to breakout. Can go long 225 with minimum 30 days gap.

MSFT GOOD IDEA BUY I am a consultant for anyone who needs a consultant, I see that MSFT will GO UP IN HOURS
1, When you decide to use my ideas in your trading, please contact me to inform you of some things and monitor the position together without specifying a take profit or stop loss, we will decide when to open and close the position
2 (When I set the take profit and stop loss in a number that does not mean that the price will reach it, I gave a buy or sell signal only according to the analyzes I made in the chart and delete it later, in the order to share it with you so that you have a clear picture and read it clearly, thank you!)
3, you can try me for one or two weeks to decide to work with you and give you signals about buying or selling

A potential area to get long for a MSFT swingWith the rotation into value over the past week or two tech has either dropped or consolidated. Looking at MSFT chart we can see some potential weakness in the giant so not all that interested in buying here for the long term. Looking at 206-207 as price target in order to start buying in big on MSFT.


MSFT Microsoft Corp. 4 hs LONG SHOULDER HEAD SHOULDER.
The market made a false break of the neck line to confuse the buyer but I think this is the real configuration

MSFT Vertical Spread Long position Updates on existing Bullish Spreads MSFT has moved in the money. MSFT is unfolding into wave 5 that could reach 240–245 or the 127.2% retracement. The key is to stretch existing profits on MSFT with the daily chart that shows SMH terminal wave 5 rally is in progress.

MSFT and Big Tech start the next move up? EARNINGS & ELECTIONBig Tech companies are looking really interesting, there is a lot of upside potential in the market and we could see the tech moves really help the rest of the market push up in terms of overall ETF indices. We have seen the lag of a lot of companies in the S&P 500 but this could be the return to value after the 15-20% drop in big tech.
We have seen multiple head and shoulders patterns form on tech across the board. The FAANG and MSFT. However, we are in an interesting and turbulent time right now. We are coming into a period where naturally we see increased volatility and the potential for anything to happen. However the closer we get to this debate, the more bullish it looks, the outcome of it will bring uncertainty but I feel that they may be priced into the market. It's well known that the president won't be known for weeks or months after and the market hasn't reacted poorly.
The only bearish reaction was that Trump announced no stimulus until after the election. We'll see if his hand gets forced. The Federal Reserve is also talking about perma stimulus that they will have to navigate through. Or at least high dovishness.
Meaning that big tech, for the most part and MSFT are stuck here, complacent without a real trend waiting to see what happens. There is potential for the upside as we are moving along and we are creating higher lows on all but 2 massive tech companies.
With the potential of the S&P 500 and the big tech stocks to break their most recent tops, we could see that bull side open up and all-time highs get hit. The deciding level to the downside is around each stock's 100-day moving average, most of which are well away from that now and making ground to the bull side.
We also have earnings season coming up, there are limited if any expectations for a lot of companies out there, with minimal forward guidance. Meaning any positive number looks like a beat considering last quarters' extremely negative GDP number. Even slight beats in earnings will help the upside in these companies.
This does not constitute investment advice, or trading advice this post is for educational purposes only.

Reversing Short to Long at 209.42
The Ingenuity Trading Model is a Hidden Markov Model with specific inputs related to Price, Time, Volume , and Volatility .

MSFT wave 5 Bullish The overall markets technical evidence still supports a continuation of bull trend, looking for a wave (iv) extended consolidation. We’re currently in wave (iv) consolidation moving through the underside of wave (e) support at 197 support level before a wave 5 terminal rally begins. Still holding on to our bullish position on MSFT that could take us through Nov.

⌨️ MSFT SCALP PLAN 🖱️ If you took a handful of positions, feel free to trim a few @Open to manage risk, do NOT let any trade go green to red.
LONG MSFT above 205.15-205.30
PT @209.35 and @211.5-212
Ideal PT @218.45
Conservative SL @202.15
Max SL @200.59
SHORT MSFT below 202
PT @200.15 and @199.52
Ideal PT @194.50-194
Conservative SL @204.75
Max SL @205.21

MSFT LONG SET UP (MICROSOFT CORP.)TITLE/(DATE)- BUY MSFT/USD
ASSET- STOCK
PLATFORM-MT4
ORDER TYPE- BUY Market
Time Frame-4hr
ENTRY PRICE 1- $206.50✅ market
ENTRY 2- $202.50 pending
STOP LOSS- $199.50 (70 PIPs)
TAKE PROFIT 1-$213.50 (70PIPS)
TAKE PROFIT 2- $220.50(140 PIPS)
TAKE PROFIT 3- $227.50 (210 PIPS)
TAKE PROFIT 4- $234.50 (280 PIPS)
TAKE PROFIT 5- $241.50 (350 PIPS)
STATUS:🏃🏽♂️RUNNING 🏃🏽♂️

MSFT wave 5 Bullish Up to the Medium Time Frames and above, MSFT has dropped into critical support level at wave (4) but the bullish trend has not been invalidated. Remaining bullish against 184 wave count invalidation level for a terminal wave 5 rally.

MSFT wave 5 Bullish Up to the Medium Time Frames and above, MSFT has dropped into critical support level at wave (4) but the bullish trend has not been invalidated. Remaining bullish against 184 wave count invalidation level for a terminal wave 5 rally.

MSFT wave 5 Bullish Up to the Medium Time Frames and above, MSFT has dropped into critical support level at wave (4) but the bullish trend has not been invalidated. Remaining bullish against 184 wave count invalidation level for a terminal wave 5 rally.

MSFT - buy support zones analysisHello traders,
Description of the analysis:
Microsoft ( MSFT ) support zones ideal for timing long positions (gray). Trade what you understand, trade carefully and sparingly according to the business plan.
About me:
Hi, my name is Jacob Kovarik and I´m trading on stock exchange since 2008. I started with a capital of 3000 USD. My first strategy was based on OTM options. (American stock index and their ETF ). I´ve learnt on my path that professional trading is based on two main fundaments which have to complement each other, to make a bussiness attitude profitable. I´ve tried a lot of techniques and many manners how to analyze the market. From basic technical analysis to fundamental analysis of single title. My analytics gradually changed into professional attitude. I work with logical advantages of stock exchange (return of value back to average, volume , expected volatility , advantage of high stop-loss, the breakdown of time in options, statistics and cosistent thorough control of risk). At the moment, my main target is ITM on SPM index. Biggest part of my current bussiness activity comes from e mini futures (NQ, ES). I´m trader of positions. I´m from Czech republic and I take care of a private fund (over $4.000.000 USD). During my career I´ve earned a lot of valuable experience, such as functionality of strategies and what is more important, control of emotions. Professional trading is, in my opinion, certain kind of mental training and if we are able to control our emotions, accomplishment will show up. I will share with you my analysis and trades on my profile. I wish to all of you successul trades.
Jacob

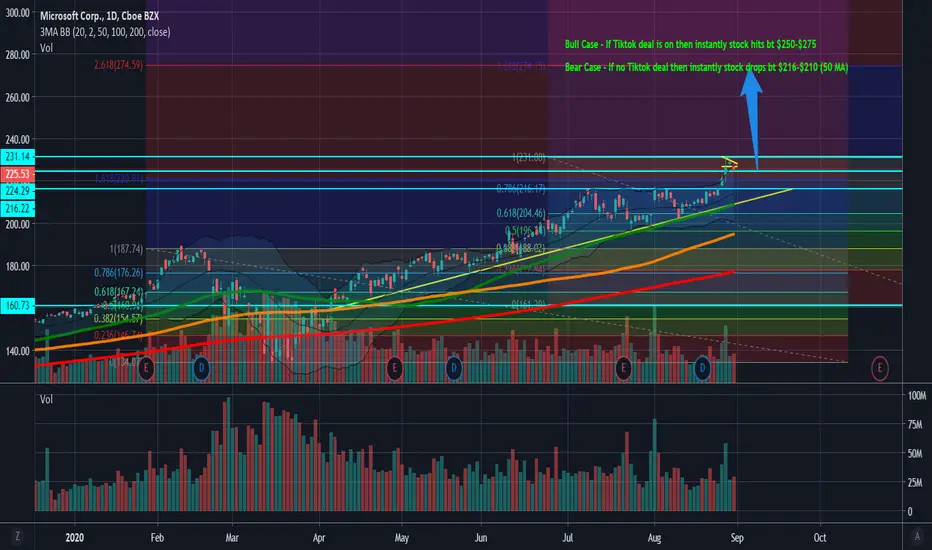
$MSFT - Tiktok Deal & No Deal AnalysisBull Case - If Tiktok deal is on then instantly stock hits bt $250-$275
Bear Case - If no Tiktok deal then instantly stock drops bt $216-$210 (50 MA)
MSFT wave 5 Bullish Up to the Medium Time Frames and above, MSFT has completed a Bullish Triangle pattern moving higher towards wave (5) upside target of 276. Look to stretch the profits on our existing long position on MSFT. Asymmetric Risk Reward vertical spread calculation shown in Video Update.


MSFT - 8.91% Potential Profit - Bullish PennantBullish Pennant formed with the possibility to hit the historical resistance line. Entry price conservatively set at mid-resistance breakout.
Target price set at resistance line bounce.
- Historical Uptrend
- RSI and STOCH well above 50
- MACD well above Signal
Suggested Entry $216.58
Suggested Stop Loss $211.56
Target price $235.96
Note that I tend to adjust stop losses in order to secure profits early and preserve capital. This means that the target price is going to be achieved as long as there are no strong pullbacks that trigger my new adjusted stop loss.

MSFT (8/31)-(9/4) Trading Plan$MSFT
MSFT Bullish above 227.
Price target @231.10
Breaking and holding above @231.15 and we'll push to @235-240 range for new highs.
MSFT Bearish breaking under 225.45
Price target @221-220
Under @220, we'll pullback until we find support around @215 or so
