Msftlong

MSFT Measured move into wave v Updates on MSFT as tech is leading the rally, looking for a wave (iv) consolidation to be completed setting up for a terminal wave (v) on the daily chart. We’re currently in wave (iv) consolidation moving through the underside of wave (e) support at 197 support level before a wave 5 terminal rally begins.

MICROSOFT CORP. LONG📈 NASDAQ:MSFT LONG H4
🛒BUY above = 211.40
🎯Target1 = 216.40
🎯Target2 = 224.16
🛑Stop loss or cancel trade = 203
🙈Risk = (1%-2%)
#MSFT #MSFTLONG #BUYMSFT

MSFT UPDATE , TARGET UP TO $245 MSFT already has my old analysis, but due to the fact that I have recently changed we need to update it.
- MSFT has confirmed the old "Cup and Handle" large model from $ 190 then went up to nearly $ 120 and adjusted here.
- MSFT Now forming and being able to confirm the small Flag pattern today it will be the same with the news of
the US acquisition of Tiktok to help MSFT up to $ 245.
MSFT Purchase additional : $210
MSFT Target : $245
Stop loss : 8% .
Wish you good deals!

Microsoft LONG📈 NASDAQ:MSFT LONG D1
🛒BUY above = 217.90
🎯Target1 = 222.60
🎯Target2 = 230.40
🛑Stop loss = 210.10
🙈Risk = (1%-2%)
#MSFT #MSFTLONG #BUYMSFT

MSFT Potential Talks of Buying TikTok wave (5) Play The 3 hours MSFT chart is showing we are setting up for one more push higher into wave (5) Green before a completed 5-wave impulse is complete. Looking to place a momentum trade on MSFT and potential takeover of TikTok for MSFT to expand into the social media business. Actionable Trade Execution in Video Report.

Microsoft Trading opportunity in the mid termwell, let's try this again. I had basically finished making this post, but I pressed esc on my keyboard and my whole blog post got erased. So, I am a little tilted, a little triggered, but let's move past this into the t.a.
Elliott wave analysis: The elliott wave analysis, similar to AMD, took me quite a while. There were a lot of probable wavecounts, but it wasn't until I really started to look into the price action, that the wavecount I have right now, appeared to me. As I am writing this post, we have just ended the wave four, and are beginning to start the wave 1 of A, of the great wave 5. The target for wave 5 is the 247-260 range. This is because it is the 0.764 extension of waves 1-3-4, and it is the 3.618 extension of wave 1-2. Now some of you are wondering why I didn't make the first target the 0.618 of waves 1-3-4, and this is because, there is such a strong cluster at the 0.764. Once the wave a unfolds, I will be able to give a more accurate target, but for now, we just have to forecast on the information at hand.
Moving average analysis: The moving average analysis on the 1 hour is telling us a very important story. We have been riding the 200 ema for quite sometime, so long that the 55ema, is also starting to ride the 200 ema. This is important, because if the 55ema break downwards, we are headed a lot further down, but a bounce off of the 200 ema for the 55ema, is great confirmation that what I predict is going to come true. On other time frames, such as the 2 hour -daily, we are steadily cruising on the 55ema, which is an alright sign.
Macd analysis: The macd on the one hour, is providing us with a huge signal that we are headed up. We have crossed over not once, but twice on the negative side, and the most recent one being so close to the zero line, that it shows huge bullish momentum is at play. On other time frames, such as the 2 hour, we see bullish divergence on the macd, and higher timeframes such as the 4 hour and 6 hour, show a cross on the negative, and a bullishly diverging histogram. So tldr, we have lots of bullish signs that support my belief that we are headed up.
RSI Analysis: Finally the rsi analysis. The RSI on the 1 hour macd is looking KILLER. We are seeing major bullish divergence, meaning higher highs and higher lows. Something interesting is the action that has taken place on the daily rsi.We can see that we have failed to break into the overbought territory on the daily in the past couple days, but have found the support in the bottom of the bullish territory. I think this might imply that we are headed back up higher. I believe that before msft starts to correct, we will see an oversold RSI, or atleast some bearish divergence on the daily. Meaning higher highs on the price action, and lower highs on the RSI.
In summation, this looks like a really great trade to take.
Target 1 is 250
Target 2 is 260
The stop loss is below the most recent swing low, so 197.
All in all we have a risk to reward of 6.6, which is crazy.
Anyway, best of luck trading this week, and made the stock market gods look favourably upon you.

Microsoft Hitting Major Channel Resistance. (MSFT)We all know if you go back in time till now on Microsoft it has an insane parabolic curve.
I currently have a channel drawn out between the two lines.
Arrows and red line is Resistance.
Green line is support.
We are seeing the overall trend from the last impulse hit the top level of Resistance in the channel, where we have seen previous good size selloffs occur at.
The ema dots are all red and the custom rsi has already dropped off.
I'm in favor of a short up here at this top level of range.
I think it would be healthy to see a pullback here.


MSFT forming cup patternExpected to consolidate a little for forming the handle and it shall go bullish then..

Buy Zone and Target for Microsoft $MSFTWhat i think $MSFT will do in upcoming days.
(Not financial advice)

MSFT 15min outlook PT $208Can def see $208 today. I entered around $203 and entered again at $205 off retest.


🚨 Compression On Microsoft! (MSFT)💰 LET'S GET INTO SOME MICROSOFT ANALYSIS!💰
1️⃣ First off SMASH that LIKE BUTTON & Give us a FOLLOW for DAILY ANALYSIS! ❤❤❤
(Overall Market Sentiment) 🐻 Bearish
- Currently showing signs of compression at previous structural high. A pullback would indicate a double top.
- The candle is still green but is a doji at a very critical price area. Next we want to see it xrop below the green and then the red line for a strong selloff.
- All 3 ema dots on the bottom are firing red, indicates a bearish sign.
- I will be taking a short here and setting a 1% stoploss.
Drop a comment down below and share your chart with us, we would love to see what you think will happen next! 🍻🍻🍻🍻🍻❤❤❤❤❤❤
Thanks for checking out our analysis! ✌😁✌
🥇MLT | MAJOR LEAGUE TRADER

🤔 Hidden Bearish Pattern For Microsoft? (MSFT)🐻 Similar to amazon stock I notice a rising wedge from the main structures. This could lead to a fakeout trap as we approach the upside of previous high and selloff.
Patterns do not always mean what they are said to mean in the textbook but we can use them to help us look for our next play. The top of the wedge lines up with previous high. Be cautious. Play short if the bottom support of wedge breaks.
You never know we could get caught off guard and the bulls could run it up. Anything is possible. Just manage the risk if it were to flip.
Happy trading! ✌😁✌
🥇MLT | MAJOR LEAGUE TRADER


MSFTWaiting for the breach of the 50 level strongly to buy!
Exit at level 61 or level 78
Let's wait and see what happens in the coming weeks.
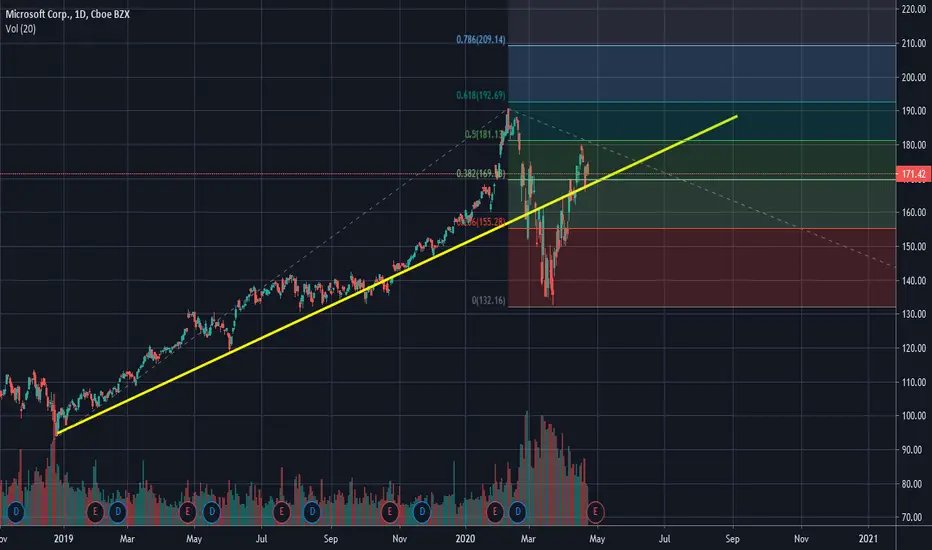
Microsoft longHere is an easy ta from Microsoft long.
At first I want you take a look on gaps that going hand in hand mostly every earnings. In upward trend you can see outbreaking gap on 22. oct followed by exhausting gap on earnings 29. jan.
Then reversal island compared to corona falling shows trend reversal to a short-term downtrend. Strong support around 132 mark continue the primary uptrend amongst others with continuing gap 14. april.
So for next earnings there are some bullish scenarios. As you can see, volume was high last weeks. Like my last ideas also here you must have to watch SP500 (take a minute and compare it, its almost same trend) and here what Fed is pumping on.
In my opionion, next upcoming earnings are accompanied by gaps and high volume. All my bullish scenarios are made for longterm investments:
We have trendline support line around 164 mark, next softcore support is around 156 from uptrend and last but not least the most important support 132 from primary uptrend.
Going up, first resistance is on 180 mark, next is ATH 190.
I think on the fundamental side of life msft is heavy weight in corona crisis and and MSFT Teams, Azure and co could show good growth cause of working home.
Any comments are welcome Im learning ta :)

MSFT is the same configuration than IndicesBreaking 166 would increase confidence in this count. Invalidation at 180.

