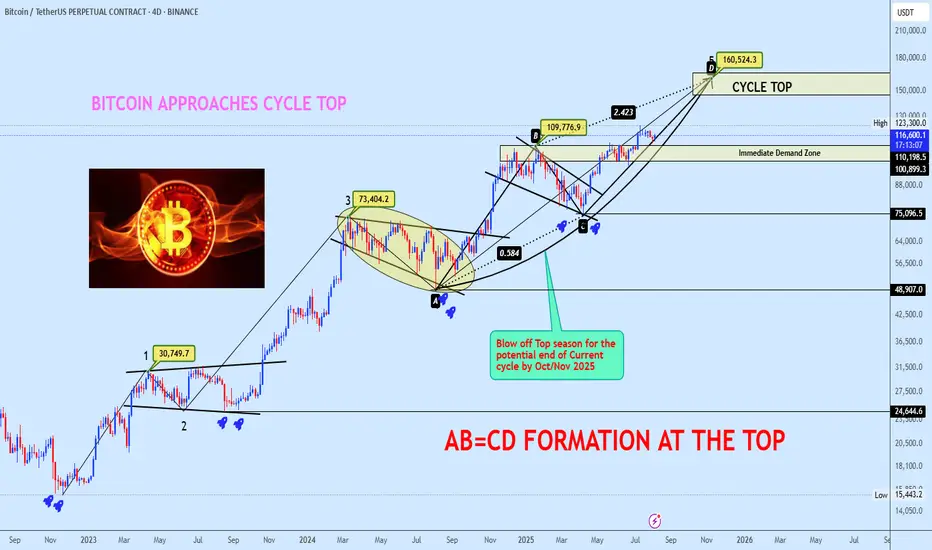
Bitcoin Approaches Cycle Top with AB=CD Completion in SightBTCUSDT continues its bullish macro structure, now advancing towards the projected cycle top zone at $160,524, completing a textbook AB=CD harmonic formation. The BC leg retraced precisely 0.584 of AB, aligning with a 2.423 CD extension, confirming a strong harmonic symmetry.
Price is currently trading around $116,569 after breaking through key resistance levels, with the Immediate Demand Zone resting at $110,198. This zone will act as the first major defense level if a short-term correction occurs.
Market structure suggests a potential blow-off top formation into October/November 2025, marking the probable end of the current cycle. Do check out our Bitcoin lifecycle thread for clarity on the reason for picking cycle top.
POTENTIAL BITCOIN LIFECYCLE
Deciphering Bitcoin's Cyclical Trends & Phases
Momentum remains firmly bullish, with the upward curve indicating buyers remain in control until exhaustion patterns emerge near the cycle projection zone.
Plan: Hold long positions into strength, scale out as BTC approaches the $160K cycle top zone, and prepare for a potential macro reversal as the cycle matures. Monitor lower timeframes for divergence signals as we approach the final leg.
If this structure aligns with your outlook, feel free to share your thoughts in the comments.
You’re also welcome to drop your preferred altcoins for a quick technical review.
Multiple Time Frame Analysis
GBPUSD SWING: SHORT OPPORTUNITYHi there,
Of all the USD pairs, I think GBPUSD is the weakest and I speculate lower prices.
At the very least, to hunt the equal lows the market created by not taking the previous low just before the monthly FVG. That action is suspect - it will induce buyers and drop more shorts on them.
Anyways, watch out for my next post.
Cheers,
Jabari

ETH Highly chance to go bearish Basic structure levels are indicating the sell there's a huge supply to sell

PUMPUSDT Showing Strong Accumulation StructurePUMPUSDT is developing a compelling base formation, suggesting a possible imminent rally. Price is currently reacting within a key accumulation zone, where early positioning remains strategic. The structure hints at underlying strength, with momentum gradually shifting in favor of bulls.
If the current support zone holds, the setup favors a multi-leg rally. Immediate targets have been mapped for short-term profit-taking, while extended projections align with the final breakout objectives.
Plan: Accumulate within the marked zone and monitor price reaction closely. A break above the immediate neckline will validate continuation toward midterm and final targets.

USD Set To bounce? EUR/USD, USD/JPY, USD/CHFIt has been a week since the US dollar plunged following a weak NFP report. Given it has consolidated within a tight range near last week's low, alongside price action clues on EUR/USD, USD/JPY and USD/CHF, I suspect the dollar could bounce before its losses resume.
Matt Simpson, Market Analyst at City Index and Forex.com

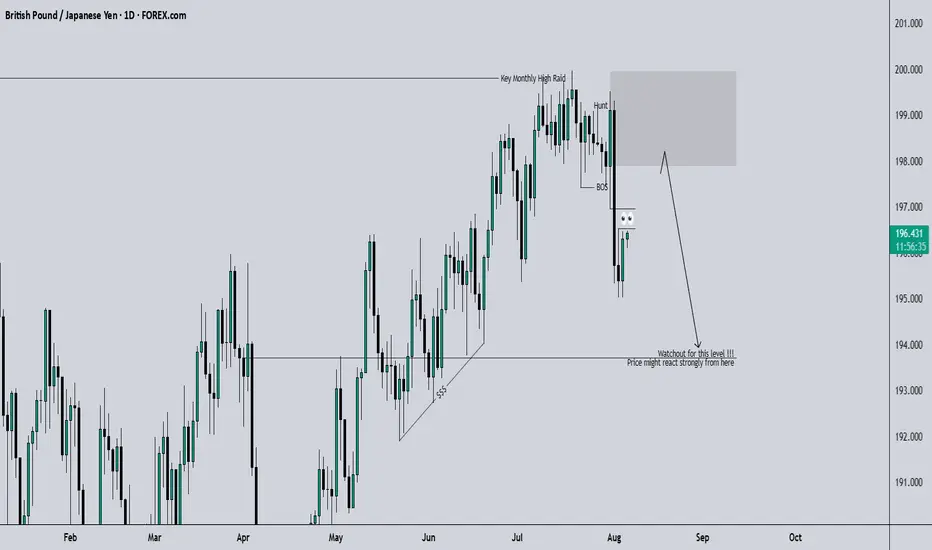
GBP/JPY Could Be Rising Into a Bear ZoneGBP/JPY is trying to notch its third bullish day heading into today's Bank of England (BOE) meeting. But with a cut expected and the potential for a dovish tone, I suspect its upside could be limited. Besides, the technical clues on the daily and weekly chart suggest we may have seen a major top in July.
Matt Simpson, Market Analyst at City Index and Forex.com

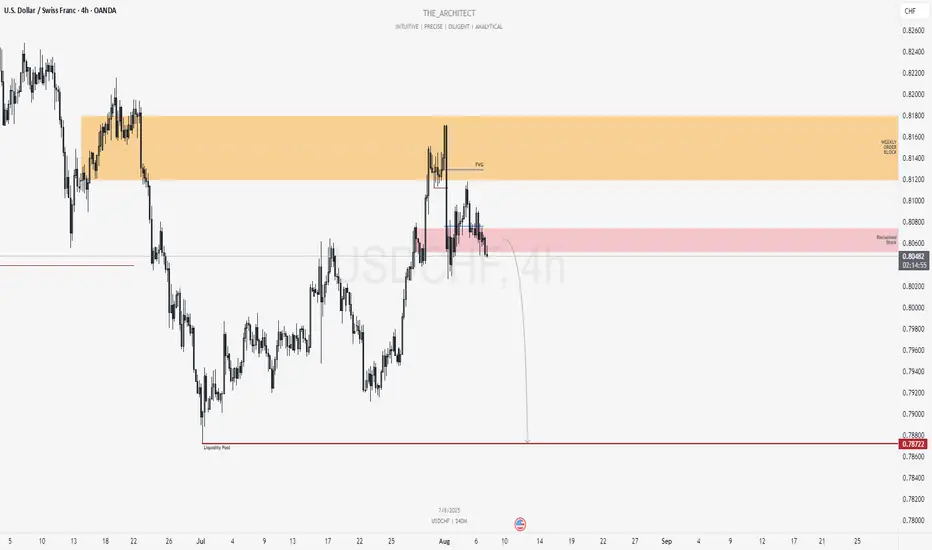
USDCHF: Bearish Continuation Setup From Reclaimed Supply ZoneGreetings Traders,
In today’s analysis of USDCHF, recent price action confirms the presence of bearish institutional order flow. This reinforces our directional bias to the downside, prompting us to focus on strategic selling opportunities.
Key Observations on H4:
Weekly Bearish Order Block: Price recently tapped into a weekly bearish order block, which triggered a decisive market structure shift to the downside. This confirms the order block's validity as a firm resistance zone.
Bearish Fair Value Gap (FVG): Following the market structure shift, price retraced into an H4 FVG. This zone acted as resistance, maintaining bearish momentum.
Reclaimed Mitigation Block: After breaking through a previous mitigation block, the area now functions as a reclaimed order block. We expect this to serve as a high-probability resistance zone moving forward.
Trading Plan:
Entry Strategy: Monitor lower timeframes (M15 and below) for confirmation entries within the reclaimed order block.
Target Objective: The current draw on liquidity is the discount-side liquidity pools, which aligns with our bearish bias.
As always, remain patient, wait for solid confirmations, and manage your risk with precision.
Kind regards,
The Architect 🏛️📉
Long trade
📘 Trade Journal Entry
🔹 Pair: LINKUSDT
📅 Date: Friday, 8th August 2025
🕖 Time: 7:30 PM
🗺 Session: NY to Tokyo Session PM
⏱ Timeframe: 15-Minute TF
📈 Direction: Buyside
📊 Trade Details
Parameter Value
Entry Price 16.668
Profit Target 18.229 (+9.37%)
Stop Loss 16.562 (−0.64%)
Risk-Reward 14.73: 1
📌 Technical Context
Entry Zone: The trade was initiated after observing a sell-side liquidity sweep, followed by an internal break of structure (BOS), which supported the shift toward bullish intent. The trade aligns with a Wyckoff-style accumulation schematic, with a Phase C spring-type event visible. We anticipate that Phase D — a trending move within the range — is now underway.

GJ|- Bullish Momentum Setup for Next Week4H – From the top-down, price has been respecting structure and just broke major highs with strong momentum to the upside.
30M – Price pulled back into structure, refined to the cleanest level. Before that, we had the professional sweep I mentioned in my last GJ post.
5M – I’m watching for a sweep of SSL into my refined zone before taking an entry. Once that happens, I’ll look for bullish follow-through.
Buy Zone: 196.264
SL: 195.925
Bias: Bullish continuation into next week — pending liquidity sweep confirmation.

AUDUSD SWING: SHORT-TERM BEARISH OPPORTUNITY (TRICKY)Hi there,
I'd like to see AUDUSD trade lower after running multiple highs and lows and creating a MSS on the weekly chart.
Price is also currently trading in-between weekly support and resistance levels which could aid the trade play out. The only concern I have is that the current region price is playing at is quite choppy - hence, price might not move cleanly.
Anyways, watchout for my next post tomorrow.
Cheers,
Jabari

NZDCAD SHORT Market structure bearish on HTFs DW
Entry at both weekly and daily
Weekly Rejection at AOi
Previous Weekly Structure Point
Daily Rejection at AOi
Daily EMA retest
Previous Structure point Daily
Around Psychological Level 0.82000
H4 Candlestick rejection
Levels 3.23
Entry 100%
REMEMBER : Trading is a Game Of Probability
: Manage Your Risk
: Be Patient
: Every Moment Is Unique
: Rinse, Wash, Repeat!
: Christ is King.

USDCAD: Bearish Structure with Rejection from Key Supply ArraysGreetings Traders,
In today’s analysis of USDCAD, recent price action confirms the presence of bearish institutional order flow. As a result, we aim to align ourselves with this directional bias by identifying strategic selling opportunities.
Key Observations:
Weekly Timeframe Insight:
Last week's candle rebalanced a weekly Fair Value Gap (FVG), indicating internal range price action. As a rule of thumb, once internal imbalances are addressed, the draw typically shifts toward external liquidity—located at the swing low, where the weekly liquidity pool resides.
H4 Resistance Alignment:
On the H4 timeframe, price shifted bearish and has since retraced into a bearish FVG that aligns precisely with a reclaimed bearish order block. The alignment of these bearish arrays strengthens the case for continued downside, making this zone a high-probability resistance area.
Trading Plan:
Entry Strategy:
Look for bearish confirmation setups on the M15 or lower timeframes within the H4 supply arrays (FVG + OB confluence).
Target Objective:
The primary draw on liquidity lies within the discount range—targeting the liquidity pool below the most recent swing low.
For a detailed market walkthrough and in-depth execution zones, be sure to watch this week’s Forex Market Breakdown:
Stay patient, wait for your confirmations, and trade in alignment with the flow of smart money.
Kind regards,
The Architect 🏛️📉

NZDUSD SHORTsMarket structure bearish on HTFs DW
Entry on Weekly and Daily AOi
Weekly Rejection at At AOi
Previous Weekly Structure Point
Daily Rejection at AOi
Daily EMA retest
Previous Structure point Daily
Around Psychological Level 0.59500
H4 Candlestick rejection
Levels 3.67
Entry 100%
REMEMBER : Trading is a Game Of Probability
: Manage Your Risk
: Be Patient
: Every Moment Is Unique
: Rinse, Wash, Repeat!
: Christ is King.

CHFJPY: Pullback From Resistance Confirmed?! 🇨🇭🇯🇵
CHFJPY may retrace from a key daily horizontal resistance.
A breakout of a support line of a consolidation range
on that on an hourly time frame provides a strong intraday confirmation.
Goal - 182.42
❤️Please, support my work with like, thank you!❤️
I am part of Trade Nation's Influencer program and receive a monthly fee for using their TradingView charts in my analysis.

GBPJPY SWING: SHORT-TERM BEARISH OPPORTUNITYHi there,
Overall for the 3rd quarter of the year, I speculate a bullish candle close, however, for price to rally, it needs to trade lower to gather the needed liquidity. Hence, the short-term bearish move.
If you turn your chart to the 3M, you will see the wick of the last quarter's candle which translates to the Monthly OB that price is most likely to trade into after running multiple stops.
Check out my next post on CADJPY.
Cheers,
Jabari
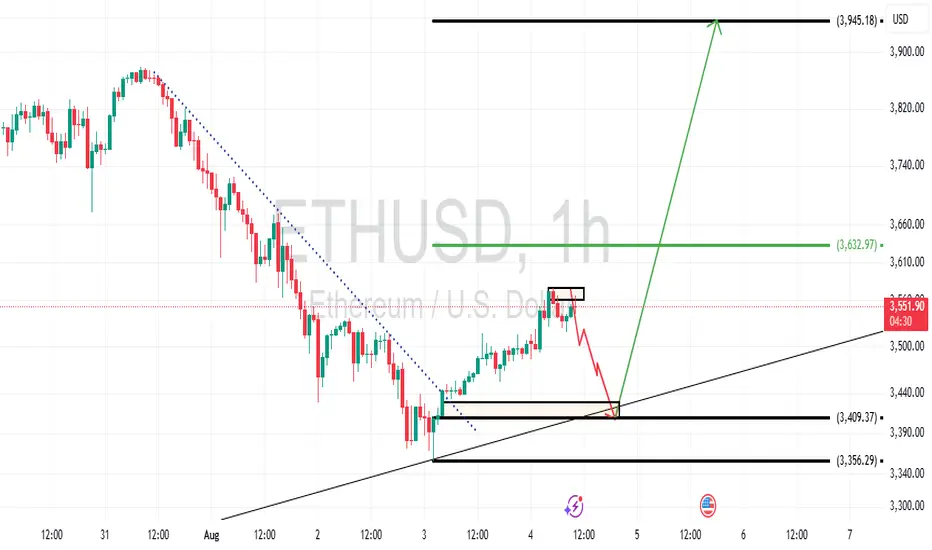
Eth/Usd Possible pathEthereum declared a possible bullish move that pends a retest. Depending on the momentum of the market, the market is likely to retest today or tomorrow in order to keep the week bullish.
AUDCAD SHORT Market structure bearish on HTFs 3
Entry at both Daily and Weekly AOi
Weekly Rejection at AOi
Previous Weekly Structure Point
Daily Rejection at AOi
Previous Structure point Daily
Around Psych Level 0.89500
H4 Candlestick rejection
Rejection from Previous structure
Levels 4.18
Entry 120%
REMEMBER : Trading is a Game Of Probability
: Manage Your Risk
: Be Patient
: Every Moment Is Unique
: Rinse, Wash, Repeat!
: Christ is King.

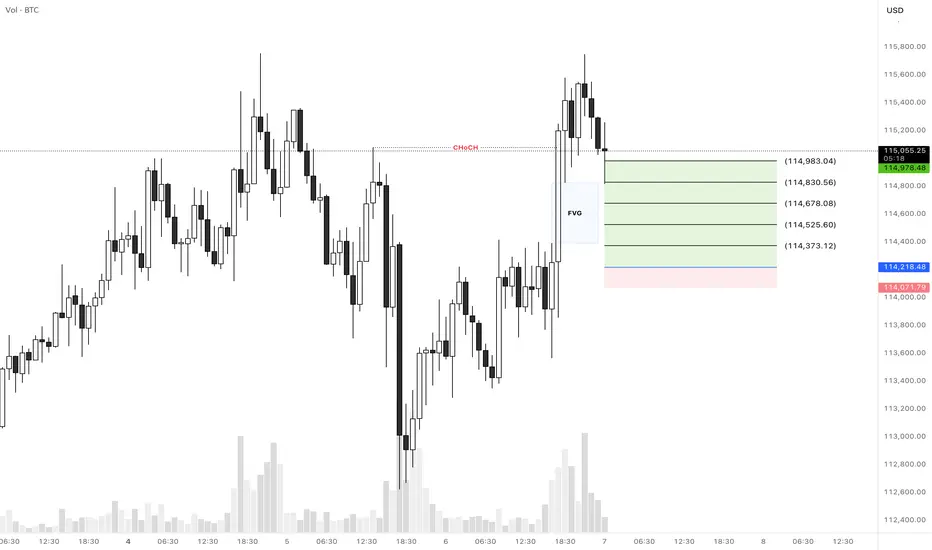
BTCUSD Long SetupHello everyone.
We have a CHoCH in 1H TF that it left a FVG area and it was touched a minute ago...
Let's see how does it reacts to this FVG area and if it didn't push the price up then we can expect our entry is valid...
Another thing that we should consider is that we're in down trend in 4H TF and the price didn't break the previous high for a CHoCH, so this trade would be a little risky so please consider the risk management...
Let's see what happens...
Good luck
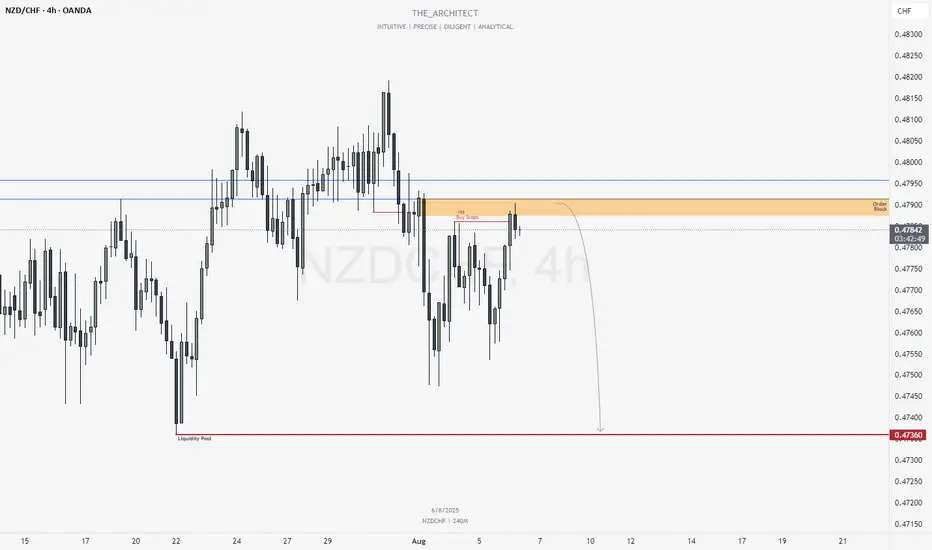
NZDCHF: Selling Within Bearish Order Flow & Order BlockGreetings Traders,
In today’s analysis of NZDCHF, recent price action confirms the presence of bearish institutional order flow. As a result, we aim to align ourselves with this directional bias by identifying strategic selling opportunities.
🔍 Key Observations on H4:
Bearish Market Structure Shift
The H4 timeframe has confirmed a bearish shift in market structure, giving us a solid framework to seek short setups aligned with institutional momentum.
Bearish Order Block
Price has recently reached a bearish order block, expected to act as a strong resistance zone for potential downside continuation.
Liquidity Engineering
Buy stops on H4 have been taken out—this sweep may be used to order the pair against liquidity, favoring bearish continuation.
📈 Trading Plan:
Entry Strategy
Monitor lower timeframes (e.g., M15 and below) for bearish confirmation setups within or near the bearish order block.
Target Objective
Our draw on liquidity remains the liquidity pool located at deeper discount levels, in alignment with the prevailing short bias.
For a detailed market walkthrough and in-depth execution zones, be sure to watch this week’s Forex Market Breakdown:
Stay disciplined, trust your confirmations, and manage your risk wisely.
Kind regards,
The Architect 🏛️📉
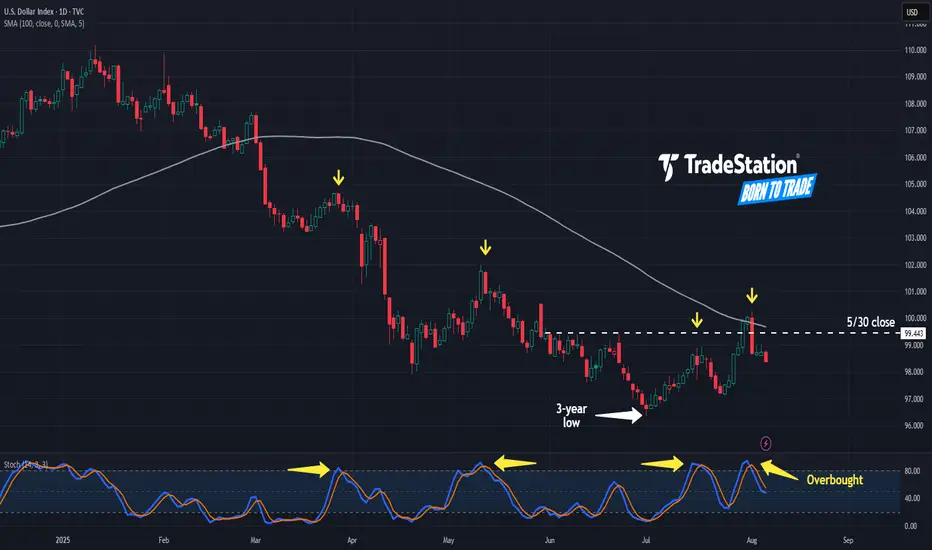
More Downside in the Greenback?The U.S. Dollar Index began 2025 with a dramatic slide. Now, after a period of consolidation, some traders may see further downside risk.
The first pattern on today’s chart is 99.443, the closing price for both a week and the entire month of May. DXY tested above the level between July 30 and August 1. It got rejected after the Labor Department revised payroll data lower. Has resistance been confirmed?
Second, the reversal occurred at the falling 100-day simple moving average. That may reflect bearishness over the longer term.
Third, stochastics have dropped from an overbought condition. Notice how those turns have occurred at other short-term peaks (marked in yellow).
Finally, traders may focus on news flow and catalysts with the White House expected to announce a replacement for Federal Reserve Governor Adriana Kugler this week.
TradeStation has, for decades, advanced the trading industry, providing access to stocks, options and futures. If you're born to trade, we could be for you. See our Overview for more.
Past performance, whether actual or indicated by historical tests of strategies, is no guarantee of future performance or success. There is a possibility that you may sustain a loss equal to or greater than your entire investment regardless of which asset class you trade (equities, options or futures); therefore, you should not invest or risk money that you cannot afford to lose. Online trading is not suitable for all investors. View the document titled Characteristics and Risks of Standardized Options at www.TradeStation.com . Before trading any asset class, customers must read the relevant risk disclosure statements on www.TradeStation.com . System access and trade placement and execution may be delayed or fail due to market volatility and volume, quote delays, system and software errors, Internet traffic, outages and other factors.
Securities and futures trading is offered to self-directed customers by TradeStation Securities, Inc., a broker-dealer registered with the Securities and Exchange Commission and a futures commission merchant licensed with the Commodity Futures Trading Commission). TradeStation Securities is a member of the Financial Industry Regulatory Authority, the National Futures Association, and a number of exchanges.
TradeStation Securities, Inc. and TradeStation Technologies, Inc. are each wholly owned subsidiaries of TradeStation Group, Inc., both operating, and providing products and services, under the TradeStation brand and trademark. When applying for, or purchasing, accounts, subscriptions, products and services, it is important that you know which company you will be dealing with. Visit www.TradeStation.com for further important information explaining what this means.
CADJPY SWING: SHORT OPPORTUNITYHi there,
Just like my short expectation on the GBPJPY analysis I shared, I would like to see CADJPY trade lower.
My reasons are well annotated on the chart. But I'd urge you to look at the 3M chart and see where we are in terms of support and resistance levels.
Anyways, I wish you good trading.
Cheers,
Jabari

EURJPY: Rejection Block Support Fuels Bullish momentum!Greetings Traders,
In today’s analysis of EURJPY, recent price action confirms the presence of bullish institutional order flow. As a result, we aim to align ourselves with this directional bias by seeking high-probability buying opportunities that target the long-term highs, where a significant liquidity pool resides.
Key Observations:
Weekly Timeframe Insight:
Last week, price retraced into a weekly bullish Fair Value Gap (FVG), which has acted as a strong support zone. This reaction has initiated a bullish response across lower timeframes, validating the weekly FVG as a meaningful area of institutional demand.
H4 Bullish Market Structure Shift:
Following the weekly bounce, the H4 chart presented a clear bullish Market Structure Shift (MSS), signaling the onset of upward momentum. Price then retraced into an extreme discount, where it found support at a well-defined Rejection Block—an institutional array we expect to hold as a launchpad for further bullish continuation.
Trading Plan:
Entry Strategy:
Monitor the Rejection Block zone for bullish confirmation setups on lower timeframes (M15 and below) to validate potential long entries.
Target Objective:
The draw on liquidity remains at higher premium levels, with the liquidity pool above the long-term highs serving as our primary objective.
For a detailed market walkthrough and in-depth execution zones, be sure to watch this week’s Forex Market Breakdown:
As always, exercise patience, wait for confirmation, and maintain strict risk management.
Kind regards,
The Architect 🏛️📈

SOLUSD Sell Limit ordersHi everyone.
I've set 3 orders to go short on Solana.
Please consider That if the second order triggered, Risk free the first order and If the third order triggered so you need to risk free the second order too...
These TP levels are based on Fib Levels. But if you want you can set the first TPs at 1:1RR for each order.
Let's see what happen.
Good luck everyone.
