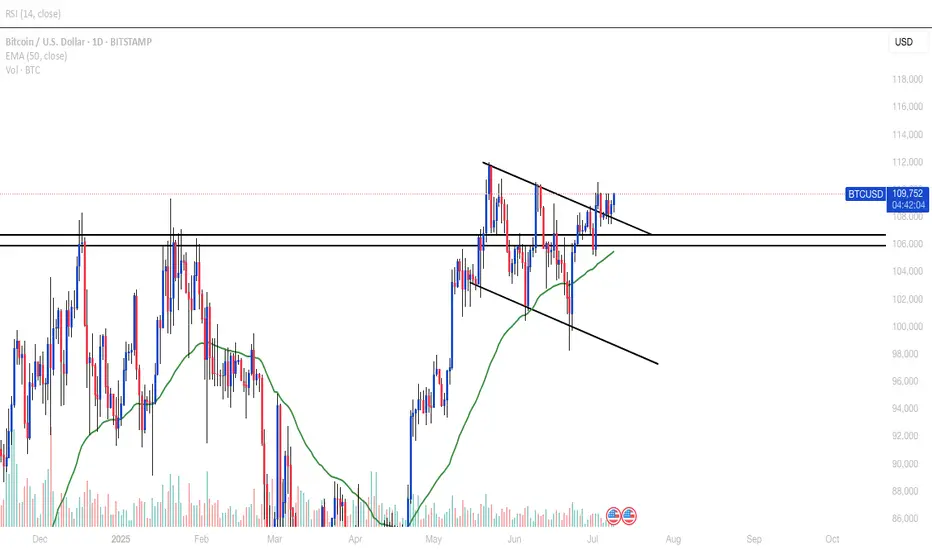
Everybody loves Gold Part 7Great trading last week. Gold really pushing deep into blues.
This week takes a downturn with possibilities highlighted on the chart; all pointing towards LOS (Level of significance). This level is calculated based on previous week high-low values.
Trade parameters:
1. SL: 50-100pips
2. TP: 3-4x SL
3. double tops/bottom (around LOS) are direction changers.
As always price action determines trades
Multiple Time Frame Analysis

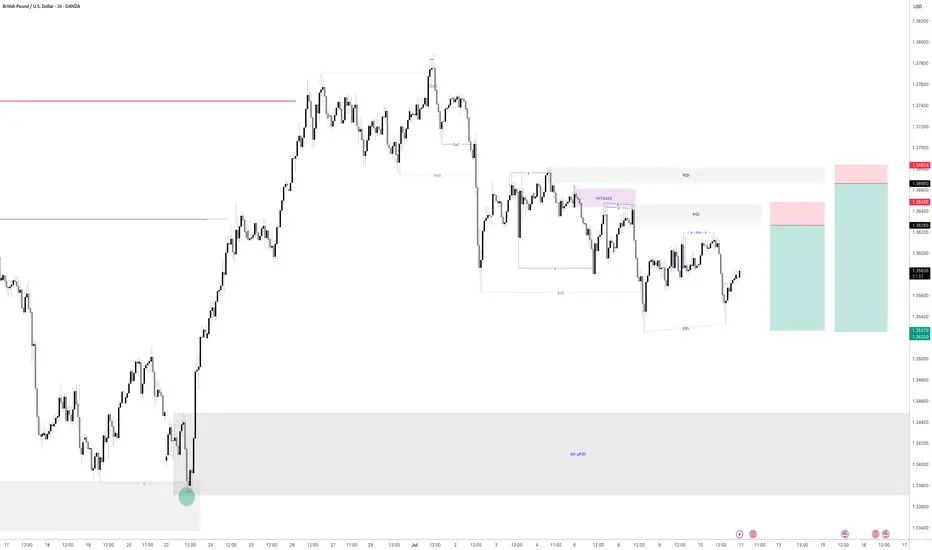
GBPUSD - 2 Selling opportunitiesLooking at GBPUSD
We have 2 opportunities to get short. Both have a build of liquidity before the areas of supply before them. This means we are looking for the early seller to get into the market before we get in so that all the early seller get stopped out.
As we can see the order flow on this is still bearish. So until the market shows me it want to go higher then we will remain bearish
Keep a close eye on this for tomorrow
Long trade
ETHUSDT 4H Chart Analysis
Date: Sat 05th July 2025, 4:00 PM
Session: London to NY AM
Key Trade Details
Entry: 2,515.17
Profit Target: 2,864.44 (+13.89%)
Stop Loss: 2,479.01 (−1.43%)
Risk-Reward: 9.66
Key Reasons for the Trade:
Bullish Breakout above 2,515, supported by strong volume surge.
Price Above EMA & WMA: Clear trend confirmation.
Strong Momentum: The RSI is overbought, indicating bullish strength, but watch for a potential short-term pullback as the price approaches resistance.
Target Zone: Prior resistance cluster at 2,820–2,860.
Current RR in Play: Trade already moving

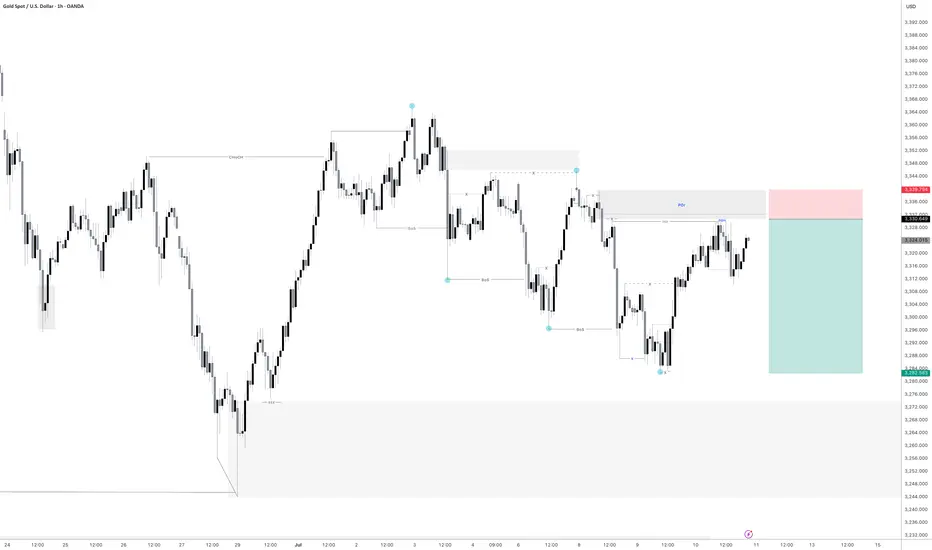
Gold - Sell inboundGold is looking very promising for another sell off. we are already showing signs that price has intent to move lower with some lower timeframe break of structure.
Just waiting for a manipulation now of the most recent highs put in before price moves lower.
Let's see if we get an entry tonight.
EURUAD is in the Buy direction from the Third Touch Hello Traders
In This Chart EUR/AUD 4 HOURLY Forex Forecast By FOREX PLANET
today EUR/AUD analysis 👆
🟢This Chart includes_ (EUR/AUD market update)
🟢What is The Next Opportunity on EUR/AUD Market
🟢how to Enter to the Valid Entry With Assurance Profit
This CHART is For Trader's that Want to Improve Their Technical Analysis Skills and Their Trading By Understanding How To Analyze The Market Using Multiple Timeframes and Understanding The Bigger Picture on the Charts

GBPUSD | ChoCh & FVG Reversal playPrice broke bullish structure and created a Clear Change of Character (CHoCH) after sweeping the lows, indicating a shift in momentum. A valid entry setup formed as price tapped into the refined demand zone + FVG, aligning with an overall bullish reversal idea.
🔹 CHoCH confirmation
🔹 Break of trendline (liquidity sweep)
🔹 FVG + Demand zone alignment
🔹 Targeting the inefficiency fill and supply mitigation above
Expecting a push back toward premium pricing before reevaluation. Let’s see if the algo delivers.
#SMC #GBPUSD #CHoCH #FairValueGap #Orderflow #FXTradingClub #PriceAction

AUDUSD ENTRY CHARTOn this Pair, we are still BEARISh, the Dollar is still very much Strong,price retrace back to our H1 zone that we have been watching out for, we got our Entry Confirmations with other Confluences, If this matches with your Trade idea, you can add to your watch-list, and if joined, kindly dont forget to move BREAK-EVEn,after +1R, or check the update section, THANK YOU, and Dont forget to RISK WISELY

Penguusdt Buy opportunityPENGUUSDT is exhibiting a potential bullish pennant formation, with price making a strong breakout from the consolidation zone.
It recently found resistance near the top of the pennant pole around the $0.0176 level, which aligns with the Immediate Internal Resistance Level (IIRL).
The current plan is to watch for a pullback into the designated buy-back zone, offering a possible re-accumulation opportunity. If the structure holds, the projected pennant target sits around the $0.043 zone, as illustrated on the chart.

GBPUSD Bearish Signal | Technical + Custom AlgoSmart Trend Signal | Technical Analysis + Custom Algorithm
This signal is the result of a combination of classic technical trend analysis and a proprietary software I personally developed.


CROUSDT trading ideaCROUSDT is holding above the Immediate Demand Zone near $0.068. A successful defense here could trigger a bullish recovery targeting $0.166, $0.232, and possibly $0.881 if price breaks the long-term descending trendline and reclaims the Internal Supply Zone. However, a breakdown below this level could send price toward the Crucial Demand Area around $0.039.

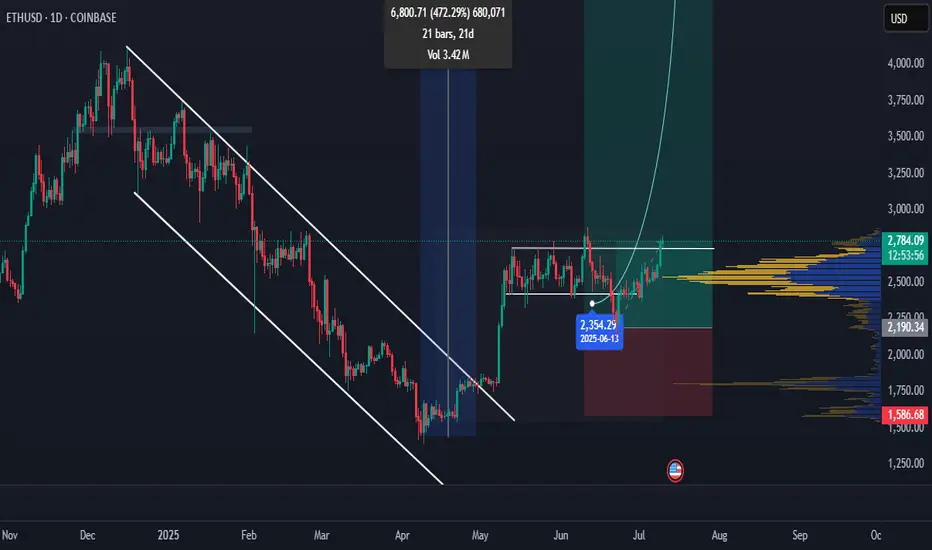
ETH resumes it's rally!!! | 5k loading! We got the perfect entry in our prediction.
ETH continues to give ALT season hints. Once the bitcoin outflow starts, expect 8k COINBASE:ETHUSD
What do you think of the idea? any counter ideas?
I'm open for feedback. Feel free to drop your thoughts!
Forex Weekly Round-Up: DXY, GBPUSD, EURUSDKey Price Zones (DXY): 97.422 - 97.685
🟦 DXY (Dollar Index):
On paper, USD had a strong week:
🔹 Durable Goods smashed expectations (+8.6% vs 0.5%)
🔹 PMIs, GDP Price Index, and Jobless Claims came in solid
But the market ignored it:
🔻 Consumer Confidence disappointed (93.0 vs 99.4)
🏠 New Home Sales missed
🕊️ Fed Chair Powell stayed soft — no aggressive tightening talk
Result?
Despite strong fundamentals, DXY broke down, sweeping daily lows and printing fresh bearish structure.
It’s now down ~10% YTD — the worst first half in over 50 years.
📈 EURUSD & GBPUSD: Holding Strong Despite Weak Data
EURUSD
German Retail Sales: –1.6%
Import Prices: –0.7%
ECB tone: muted
Still, EURUSD held daily support and gained — thanks to broad USD weakness.
GBPUSD
Current Account widened (–£23.5B), GDP unchanged
No standout UK catalyst
Yet GBPUSD held its ground and edged higher as DXY continued to fall.
🧠 What This Tells Us
Strong data isn’t always enough.
When price action, market sentiment, and liquidity targets align — they override the numbers.

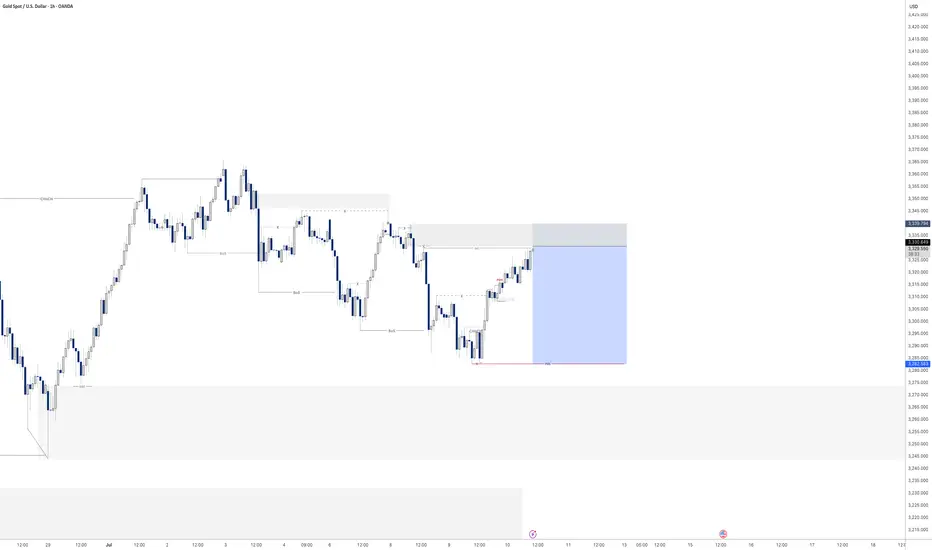
Gold - Sell before longer term buyLooking at gold we are a matter of a few pips away from entry. looking to play gold down till our larger 4H area of demand seeing as we have had a CHoCH to the upside.
There for i will be looking to take my sell position down to 3283.5 at a bare minimum as it was the previous structure level in which we turned around.
Lets see if we get tagged in. If not i will jump down to the lower TF and see if we can get a confirmation that price is going to turn from here.
Sell GC based on 15M bearish unicorn breakerGC swept previous day high, 4h high during London open. It reversed sharply making 15M bearish change in state of delivery (CISD) and moving through 15M breaker and forming 15M FVG. Nice ICT unicorn breaker!
I have my sell limit placed at the low of 15m FVG. Will be targeting RR 1:2.

PLTR DUMP INCOMINGdump it dump it dump it.
huge resistance off yearly level. gap on daily chart. Untested levels acting as a magnet lower. Dump it.

July 2025 - Duolingo trading opportunityGood news for Duolingo... The chart is now showing some promising signs that it might be ready to turn things around and head higher. Some simple clues why:
RSI resistance breakout:
The "RSI" indicator (bottom of chart) tells us strength is returning. A break of resistance that has been active over the last month is now no more. This usually means the buyers are taking control again.
Hidden strength:
Even though the price might look a bit sleepy, oscillators now print significant bullish divergence with price action.
Past resistance confirms support:
Certainly one of the most simplest concepts to take advantage of, previous resistance now confirms support. This test occurs as price action strikes the 50% Fibonacci level.
20% Forecast
Look left, previously market structure failed. Typically past breaks of structure shall be tested to confirm resistance, which is between 20-30% away.
Is it possible price action continues to print lower lows? Sure.
Is it probable? No.
Ww

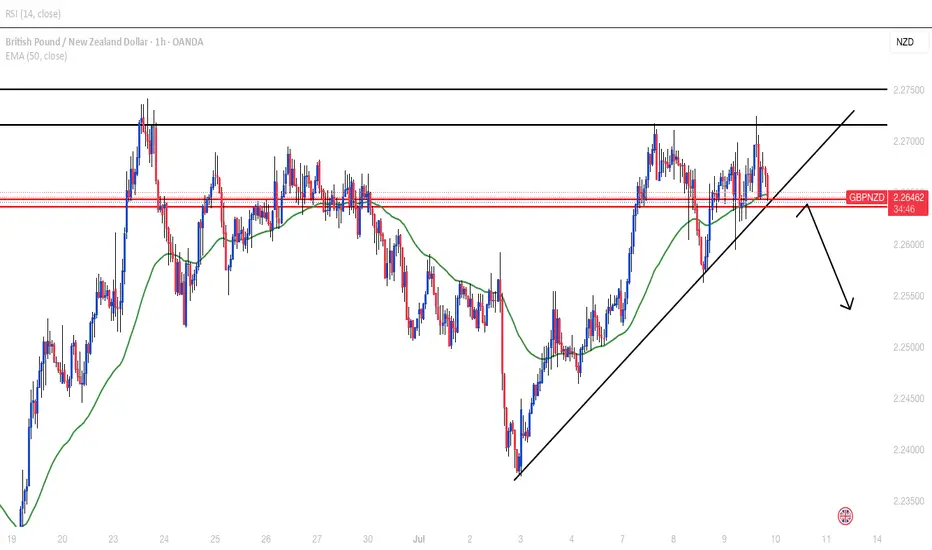
GBPNZD RANGEDaily and H4 range. Price at resistance zone with possible H4 double top forming. Clear head and shoulder on M15. waiting for break below neckline to look for selling signals.
GBPUSDPrice reached a major weekly resistance and started selling with the daily giving a strong bearish engulfing last week. H4 formed a double top and started creating lower highs. H1 has formed a third bearish wedge. Waiting for clear breakout to look for shorts. Watch out for fundamentals this week.

NZDUSD LONGMarket structure bullish on HTFs DW
Entry at both Daily and Weekly AOi
Weekly rejection at AOi
Weekly Previous Structure Point
Daily Rejection at AOi
Previous Daily Structure Point
Daily EMA retest
Around Psychological Level 0.60000
H4 Candlestick rejection
Levels 4.93
Entry 100%
REMEMBER : Trading is a Game Of Probability
: Manage Your Risk
: Be Patient
: Every Moment Is Unique
: Rinse, Wash, Repeat!
: Christ is King.

GOLD (XAUUSD): Time to Recover?!
Gold reached an important rising trend line on a daily.
I see 2 nice intraday bullish reactions to that on a 4H time frame
and a double bottom pattern formation.
Its neckline breakout and a 4H candle close above 3309
will confirm a start of a bullish correctional movement.
Goal will be 3327.
Alternatively, a bearish breakout of the trend line will push
the prices lower.
❤️Please, support my work with like, thank you!❤️
I am part of Trade Nation's Influencer program and receive a monthly fee for using their TradingView charts in my analysis.

USDCHF: Short Sell Trigger on 4HGood morning everyone,
yesterday evening my LuBot Ultimate indicator sends me an alert for a sell signal I entered.
The signal is in favor of the trend and the main period structure both on the current timeframe and on the higher timeframes.
The indicator provides exit levels which I will follow as I think they are already optimal for a short term trade.
The stop is located above the highs and leaves some space for any spikes, and the take profit is located in the low area where it would be appropriate to exit.
👍 If you want to see other similar posts, like/boost
🙋♂️ Remember to follow me so you don't miss my future analyses
⚠️ Disclaimer: This post is for informational purposes only and does not constitute financial advice. Always do your research before making investment decisions.
TAGS: FPMARKETS:USDCHF FX_IDC:USDCHF KRAKEN:USDCHF SAXO:USDCHF FOREXCOM:USDCHF OANDA:USDCHF FX:USDCHF
