Sniper Entry on AUDCAD - SMC Concepts - Trade Code RevealedAlright snipers, here it is!
From today onwards, I will publish my live trades. My A+ setups.
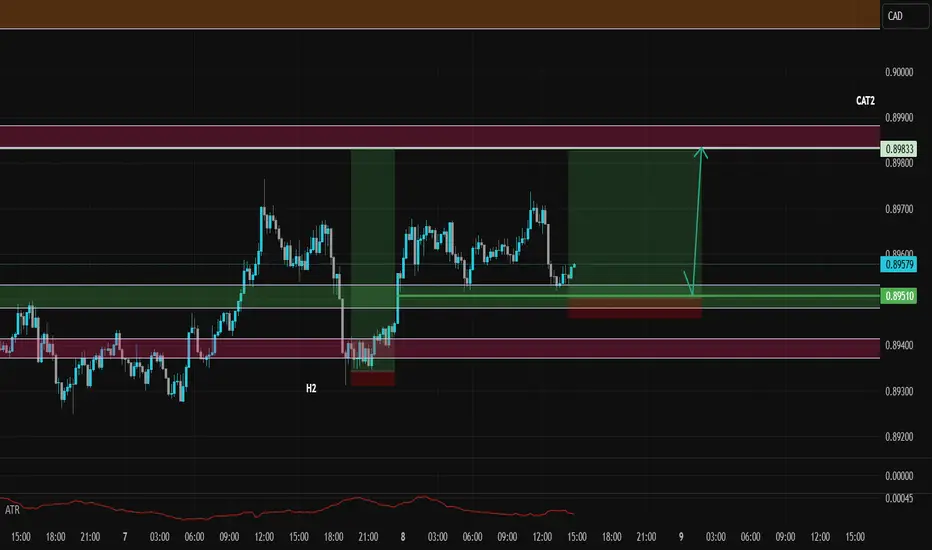
In this one, I follow the H2 game ( Bullish) as there is no other game played at the moment on this pair contradicting my story.
Story says, H8 bullish, H2 bullish, BOS confirmed. Now market is mitigating towards an imbalance left behind and visible on m15/m8.
I am expecting this last point of true mitigation to be reached, inducing the last swing buyers who believe the market has to go up.
Also a very important info: market will break through the low of Asia and low of Europe sessions before taking off (0.89519)
No sign of reversal move either, H8 candles are closing above the H8 S/R. No sign of H2 or m30 reversal candlestick pattern (Rejection + Acceleration or Supply Zone). So we're good to go.
Enjoy this trade! See you on the one...
Multiple Time Frame Analysis
Long trade
Trade Journal Entry – XRPUSDT
Direction: Buyside trade
Date: Wednesday, 6th August 2025
Time: 12:30 PM (Tokyo to London Session PM)
Timeframe: 15-Min TF Entry
📊 Trade Details
Entry Price: 3.3479
Profit Target: 3.5547 (+6.18%)
Stop Loss: 3.3236 (−0.73%)
Risk-Reward Ratio: 8.51: 1
🧠 Context / Technical Notes
Price action shows a bullish structure following prior range accumulation.
Multiple higher timeframe fib ranges marked; entry taken within premium/discount zones. Current price reacting from a demand zone with liquidity sweep seen in the lower timeframe.

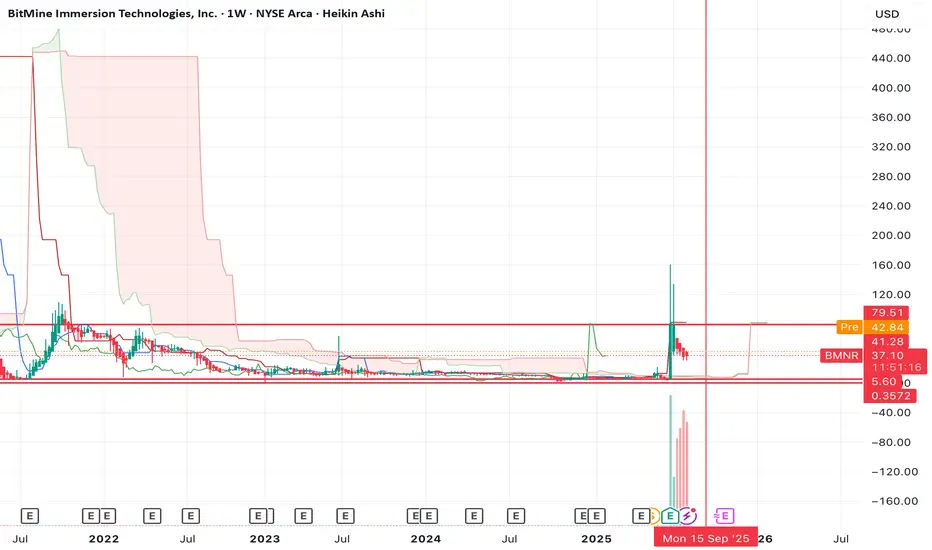
ETH is not having its "2017" moment, neither is BMNRDespite Tom Lee calling for ETH to $18k (which I happen to agree on btw), I think his timing is completely off. He's thinking that ETH is bullish here and that we're going to go to new highs this year.
I think the opposite. I think the top is already in for the year and that we're going to head to new lows first before we make our way to new highs.
BMNR doesn't look good either. The chart is bearish on the 3W and 1M timeframe with a bearish divergence on the RSI.
I think it's more likely that BMNR retests the lows before it sees any large pump.
Let's see how the chart plays out over the coming weeks/months.
EURUSD TODAYEURUSD chart 15m now waiting for a mitigation of POI above to take 15m swing low. but most probably a sideway could happen.

BTC Buy / Long SetupWait for the entry till London Session, and Hold the trade, Must use SL with proper risk management.

SEI Long / Buy Intraday SetupSEI bounced well from weekly Bullish retest, Now if sei manges to close above 0.3660 on 4hrs then it can lead to 0.48 next. For now wait for the entry , take small entry on mention point and second from dca point and tp given. Don't hold any trade must use sl.

600% falling wedge extension for VARA Network?On the above 4 day chart price action has corrected 90%. A number of reasons now exist for long entries, they include:
1) Price action and RSI resistance breakouts.
2) Support and resistance. Past resistance confirms support.
3) Point no. 2 confirms a “double bottom” in price action.
4) Notice the 4 day hammer candle?
5) The falling wedge confirmation forecasts a 600% move in price action.
Is it possible sellers keep selling? Sure, I hear their supplies are endless.
Is it probable? No.
Ww
Type: trade
Risk: small, tiny market cap.
Timeframe for long: Now
Return: 600%

AUDCAD Long Position levels
A long position is initiated on AUDCAD following a significant bullish breakout from a multi-day consolidation. This idea outlines a two-tiered take-profit strategy, targeting key psychological and structural resistance levels, while managing risk with a defined stop loss.
Entry: 0.89560
Take Profit 1: 0.9001
Take Profit 2: 0.91560
Stop Loss: 0.88808
Current Status & Outlook: The price is currently trading just above the potential entry point. The trade is based on the expectation of a sustained upward move after the recent breakout, with a clear strategy for taking profits and managing risk.
Disclaimer
This analysis is for educational and informational purposes only and does not constitute financial advice. The provided trade idea is based on technical analysis and historical price action, and past performance is not indicative of future results. Trading foreign exchange on margin carries a high level of risk and may not be suitable for all investors. Before deciding to trade, you should carefully consider your investment objectives, level of experience, and risk appetite. You could lose some or all of your initial investment. Seek advice from an independent financial advisor if you have any doubts. Any action you take upon the information on this chart and analysis is strictly at your own risk.

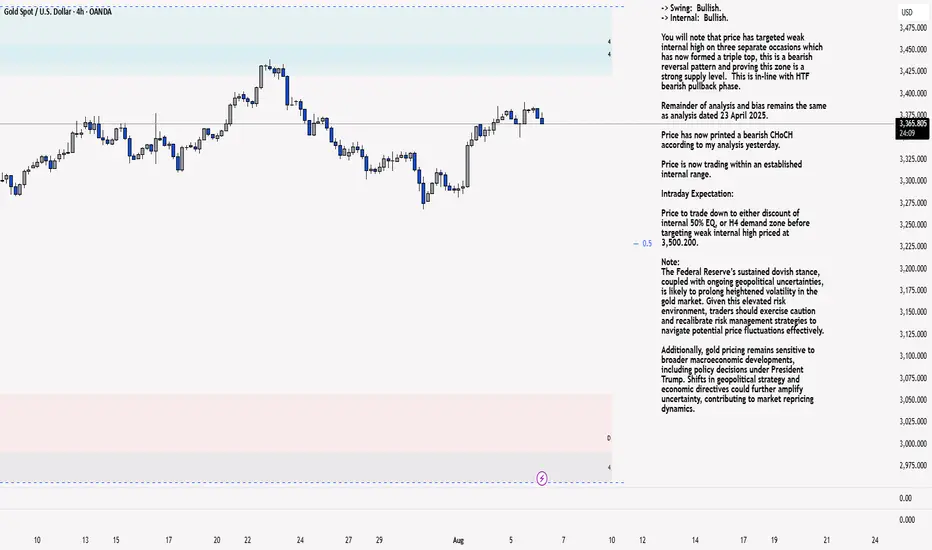
XAU/USD 07 August 2025 Intraday AnalysisH4 Analysis:
-> Swing: Bullish.
-> Internal: Bullish.
You will note that price has targeted weak internal high on three separate occasions which has now formed a triple top, this is a bearish reversal pattern and proving this zone is a strong supply level. This is in-line with HTF bearish pullback phase.
Remainder of analysis and bias remains the same as analysis dated 23 April 2025.
Price has now printed a bearish CHoCH according to my analysis yesterday.
Price is now trading within an established internal range.
Intraday Expectation:
Price to trade down to either discount of internal 50% EQ, or H4 demand zone before targeting weak internal high priced at 3,500.200.
Note:
The Federal Reserve’s sustained dovish stance, coupled with ongoing geopolitical uncertainties, is likely to prolong heightened volatility in the gold market. Given this elevated risk environment, traders should exercise caution and recalibrate risk management strategies to navigate potential price fluctuations effectively.
Additionally, gold pricing remains sensitive to broader macroeconomic developments, including policy decisions under President Trump. Shifts in geopolitical strategy and economic directives could further amplify uncertainty, contributing to market repricing dynamics.
H4 Chart:
M15 Analysis:
-> Swing: Bullish.
-> Internal: Bullish.
H4 Timeframe - Price has failed to target weak internal high, therefore, it would not be unrealistic if price printed a bearish iBOS.
The remainder of my analysis shall remain the same as analysis dated 13 June 2025, apart from target price.
As per my analysis dated 22 May 2025 whereby I mentioned price can be seen to be reacting at discount of 50% EQ on H4 timeframe, therefore, it is a viable alternative that price could potentially print a bullish iBOS on M15 timeframe despite internal structure being bearish.
Price has printed a bullish iBOS followed by a bearish CHoCH, which indicates, but does not confirm, bearish pullback phase initiation. I will however continue to monitor, with respect to depth of pullback.
Intraday Expectation:
Price to continue bearish, react at either M15 supply zone, or discount of 50% internal EQ before targeting weak internal high priced at 3,451.375.
Note:
Gold remains highly volatile amid the Federal Reserve's continued dovish stance, persistent and escalating geopolitical uncertainties. Traders should implement robust risk management strategies and remain vigilant, as price swings may become more pronounced in this elevated volatility environment.
Additionally, President Trump’s recent tariff announcements are expected to further amplify market turbulence, potentially triggering sharp price fluctuations and whipsaws.
M15 Chart:

EURJPY: Rejection Block Support Fuels Bullish momentum!Greetings Traders,
In today’s analysis of EURJPY, recent price action confirms the presence of bullish institutional order flow. As a result, we aim to align ourselves with this directional bias by seeking high-probability buying opportunities that target the long-term highs, where a significant liquidity pool resides.
Key Observations:
Weekly Timeframe Insight:
Last week, price retraced into a weekly bullish Fair Value Gap (FVG), which has acted as a strong support zone. This reaction has initiated a bullish response across lower timeframes, validating the weekly FVG as a meaningful area of institutional demand.
H4 Bullish Market Structure Shift:
Following the weekly bounce, the H4 chart presented a clear bullish Market Structure Shift (MSS), signaling the onset of upward momentum. Price then retraced into an extreme discount, where it found support at a well-defined Rejection Block—an institutional array we expect to hold as a launchpad for further bullish continuation.
Trading Plan:
Entry Strategy:
Monitor the Rejection Block zone for bullish confirmation setups on lower timeframes (M15 and below) to validate potential long entries.
Target Objective:
The draw on liquidity remains at higher premium levels, with the liquidity pool above the long-term highs serving as our primary objective.
For a detailed market walkthrough and in-depth execution zones, be sure to watch this week’s Forex Market Breakdown:
As always, exercise patience, wait for confirmation, and maintain strict risk management.
Kind regards,
The Architect 🏛️📈

EURJPY LONG After seeing price reject 170.000 monthly area of institutional support we saw a sharp push to the upside on the weekly timeframe from last week and we could see the market push to the upside not that the 4hr broke area of structure resistance

CHFJPY: Pullback From Resistance Confirmed?! 🇨🇭🇯🇵
CHFJPY may retrace from a key daily horizontal resistance.
A breakout of a support line of a consolidation range
on that on an hourly time frame provides a strong intraday confirmation.
Goal - 182.42
❤️Please, support my work with like, thank you!❤️
I am part of Trade Nation's Influencer program and receive a monthly fee for using their TradingView charts in my analysis.

GBPUSD SELL IDEA After seeing the daily timeframe reject the moving average in addition to resistance at1.33125 and also a break of 4hr structure support and also trendline area of support, we could be expecting a push into new lows.

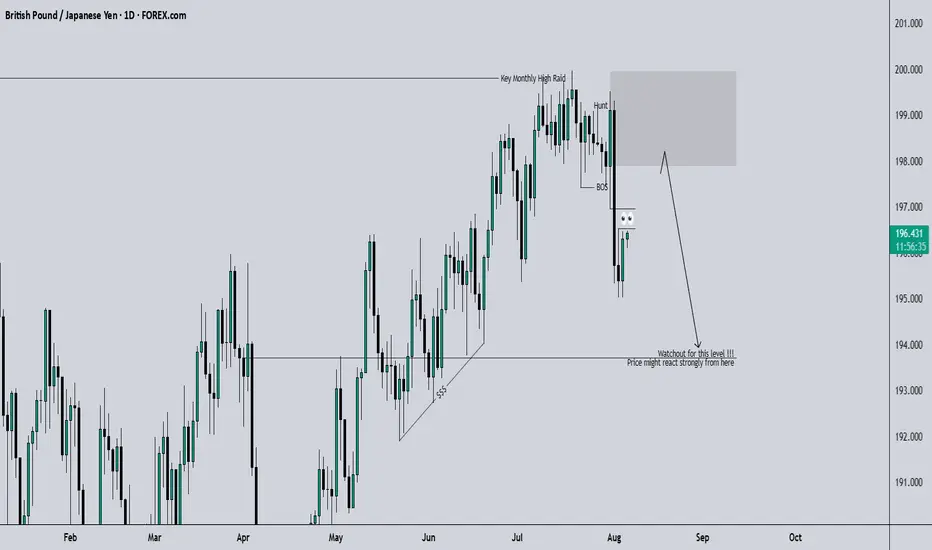
GBPJPY SWING: SHORT-TERM BEARISH OPPORTUNITYHi there,
Overall for the 3rd quarter of the year, I speculate a bullish candle close, however, for price to rally, it needs to trade lower to gather the needed liquidity. Hence, the short-term bearish move.
If you turn your chart to the 3M, you will see the wick of the last quarter's candle which translates to the Monthly OB that price is most likely to trade into after running multiple stops.
Check out my next post on CADJPY.
Cheers,
Jabari
XAU/USD 06 August 2025 Intraday AnalysisH4 Analysis:
-> Swing: Bullish.
-> Internal: Bullish.
You will note that price has targeted weak internal high on three separate occasions which has now formed a triple top, this is a bearish reversal pattern and proving this zone is a strong supply level. This is in-line with HTF bearish pullback phase.
Remainder of analysis and bias remains the same as analysis dated 23 April 2025.
Price has now printed a bearish CHoCH according to my analysis yesterday.
Price is now trading within an established internal range.
Intraday Expectation:
Price to trade down to either discount of internal 50% EQ, or H4 demand zone before targeting weak internal high priced at 3,500.200.
Note:
The Federal Reserve’s sustained dovish stance, coupled with ongoing geopolitical uncertainties, is likely to prolong heightened volatility in the gold market. Given this elevated risk environment, traders should exercise caution and recalibrate risk management strategies to navigate potential price fluctuations effectively.
Additionally, gold pricing remains sensitive to broader macroeconomic developments, including policy decisions under President Trump. Shifts in geopolitical strategy and economic directives could further amplify uncertainty, contributing to market repricing dynamics.
H4 Chart:
M15 Analysis:
-> Swing: Bullish.
-> Internal: Bullish.
H4 Timeframe - Price has failed to target weak internal high, therefore, it would not be unrealistic if price printed a bearish iBOS.
The remainder of my analysis shall remain the same as analysis dated 13 June 2025, apart from target price.
As per my analysis dated 22 May 2025 whereby I mentioned price can be seen to be reacting at discount of 50% EQ on H4 timeframe, therefore, it is a viable alternative that price could potentially print a bullish iBOS on M15 timeframe despite internal structure being bearish.
Price has printed a bullish iBOS followed by a bearish CHoCH, which indicates, but does not confirm, bearish pullback phase initiation. I will however continue to monitor, with respect to depth of pullback.
Intraday Expectation:
Price to continue bearish, react at either M15 supply zone, or discount of 50% internal EQ before targeting weak internal high priced at 3,451.375.
Note:
Gold remains highly volatile amid the Federal Reserve's continued dovish stance, persistent and escalating geopolitical uncertainties. Traders should implement robust risk management strategies and remain vigilant, as price swings may become more pronounced in this elevated volatility environment.
Additionally, President Trump’s recent tariff announcements are expected to further amplify market turbulence, potentially triggering sharp price fluctuations and whipsaws.
M15 Chart:
SOLUSD Sell Limit ordersHi everyone.
I've set 3 orders to go short on Solana.
Please consider That if the second order triggered, Risk free the first order and If the third order triggered so you need to risk free the second order too...
These TP levels are based on Fib Levels. But if you want you can set the first TPs at 1:1RR for each order.
Let's see what happen.
Good luck everyone.

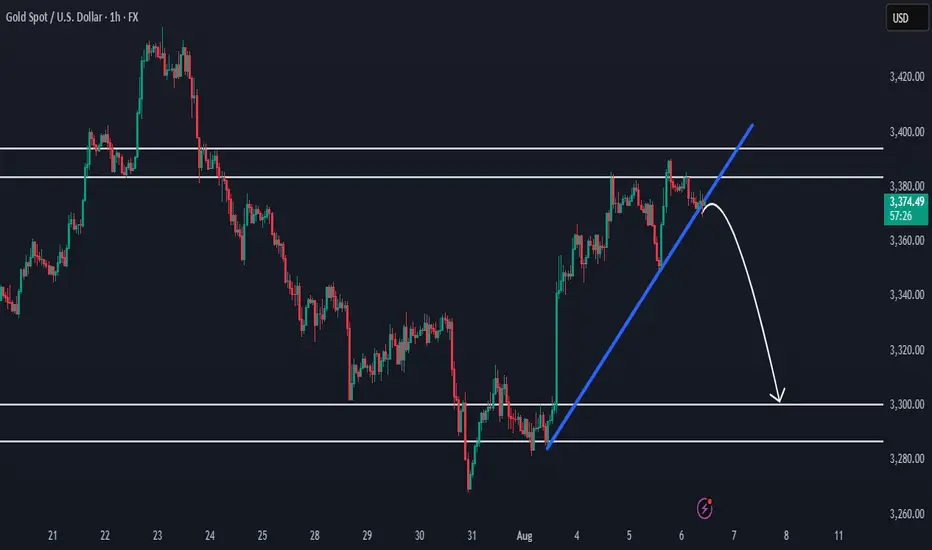
Gold Rejected from Supply - Clean Sell SetupHello traders!
This is a clean, textbook sell setup.
Gold has an overall bearish structure.
It has reached an important supply area and been rejected.
We are aiming for a sell position here upon breaking the upward trendline.
The target is around 3300.
EURUSD Sell PositionHello traders!
As we discussed in the last daily analysis, our overall view is bearish.
You can see the full analysis in the related article.
We are aiming for a short-term sell here.
Targeted price is 1.14432
Manage your risk and trade safe!

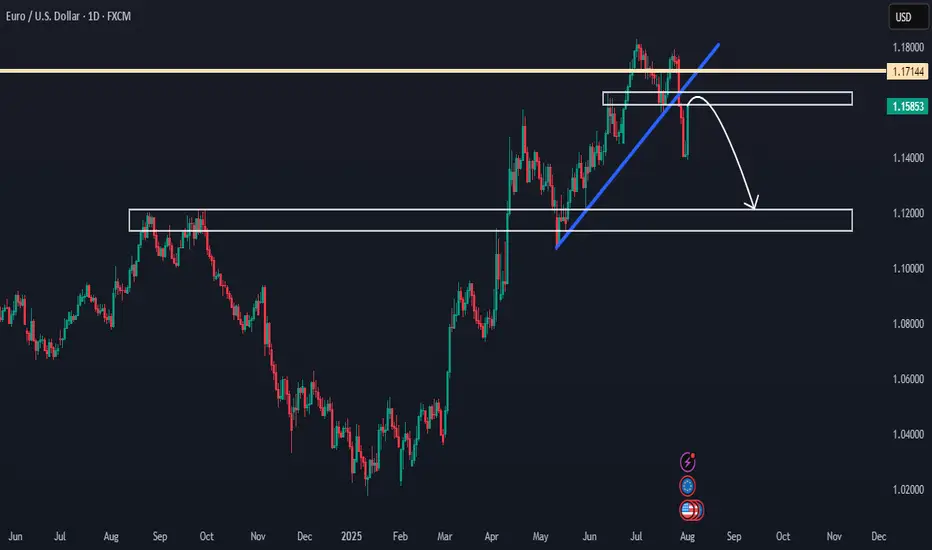
EURUSD Showing Reversal Signs After 7-Month Bullish TrendHello everybody!
After holding bullish momentum for a long time (7 months), EURUSD is starting to show signs of reversal:
1. It has been rejected from a strong resistance area.
2. It broke a support area, which is now expected to act as resistance.
3. It broke a solid upward trendline with a strong downward move.
If this area holds and price doesn't go above 1.18000, we can look to sell from here.
In that case, the most likely target will be around 1.12000.
Manage your risk and trade safe!
EurCad long term shortPatience in key in trading forex. A prime example of the EC pair where prices should rally to the upside to tap into the supply OB before shorting to the downside.

BTC_TRADING IDEA 08/01/25So we had a nice retracement. I’m now patiently waiting in a discount zone, aiming for a MTF LQ.
I have plenty of reasons to wait here:
– FVG
– OB
– OTE
If it doesn’t play out, I’ll look for another PD Array.
Let’s see!

Bitcoin Short SetupHi everyone.
In Bitcoin 1H TF we have a CHoCH followed by a BOS and a pullback, I think it is possible the price meet this area and then continue to go down...
Let's see what happens...
Good luck

EU Scalp (wrong bias) - Trump speech Came into the day with a neutral bias looking for some kind of retracement deeper into the hourly leg.
After a bearish London with bearish H1 order flow showing (H1 wicks + rejecting the Order block) we sell our liquidity shakeout right in the middle of New York session.
It's really got me interested was how close we came to the daily DOL (or so I thought) before retracing
