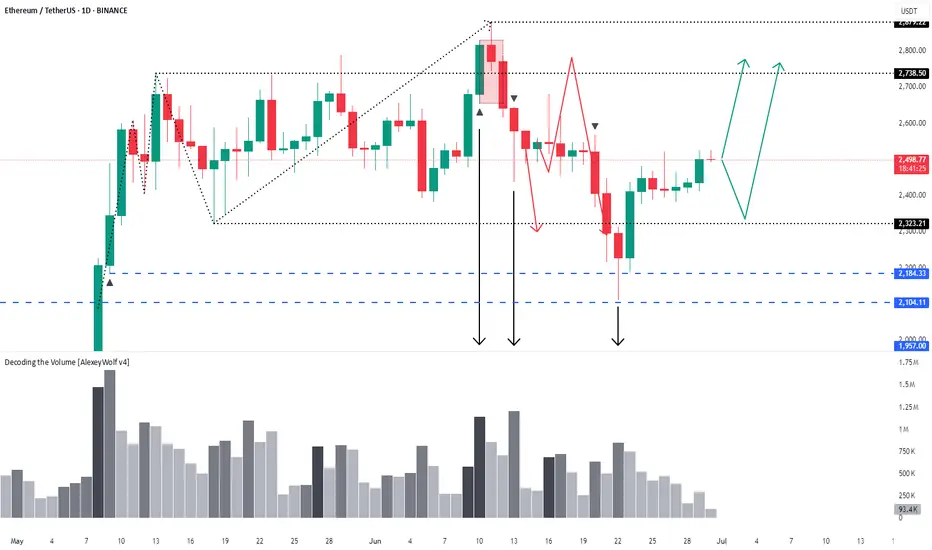
Ethereum – 1D timeframe overview with Initiative AnalysisHey traders and investors!
The seller has reached their target.
A buyer started buying from the 2184 level and now holds the initiative.
Targets are on the chart.
This analysis is based on the Initiative Analysis concept (IA).
Wishing you profitable trades!
Multiple Time Frame Analysis
$XAUTUSDt 300625 TRADE SETUPWaiting for Price to show its hand, then I'll take a Trade.
Overall 🔺BULLISH; anticipating the PWL to be souped where I will start hunting Entries to LONG.
For Entertainment. Not a Financial/Investment Advice.
What's your view❓

USDJPY 29/06/2025Weekly:
-Bearish W pattern.
-Liquidity sweep.
-Expecting a bearish weekly candle.
Daily:
-Bearish W pattern.
-IC.
4H:
-Bearish W pattern.
-IC.

Stock Index Futures - ES, NQ, YM - Weekly AnalysisS&P 500 / ESU2025
Key drivers:
Rebounding from April’s tariff-induced lows, boosted by optimism around U.S.–China trade, easing geopolitical tensions, and Fed rate‑cut expectations
Market breadth strengthened as sectors beyond mega-cap tech—especially financials and industrials—joined the rally
Nasdaq / NQU2025
Catalysts:
Continued leadership from AI/digital giants like Nvidia (which rose ~4% on Friday and regained its title as the world’s most valuable company) alongside broader tech momentum
Dow Jones / YMU2025
Highlights:
Strongest weekly performance since early April.
Corporate earnings (e.g., Nike’s better-than-expected report) provided sector-specific tailwinds.
Cross‑asset momentum: Equities rebounded strongly from April’s slump, logging back-to-back months of double-digit gains—fuelled by tariff ease, geopolitical calm, and dovish Fed signals.
Vigilance required: While sentiment is strong, potential catalysts include the July 9 deadline on tariff pauses, upcoming jobs data, Fed commentary, and the tax/spending package.
------------------------------------
I will be approaching the markets differently from now on.
Based on the feedback from past analysis, I will be compiling all related pairs into one video, giving you guys the ability to see how one asset affects the other.
This is called inter-market relationship and it's something i've been doing for years.
It gives you confidence on what pairs are 'Hot Picks' and the ones that have a high chance of not delivering the way you want.

Forex Weekly Round-Up - 30th Jun 25Dollar Index:
Dollar Index declined further, hovering near 97.0–96.9 — its weakest level since February 2022.
Key Driver: Markets digested a slightly hotter US core PCE inflation report (+2.3% YoY for May), paired with weak personal spending, reinforcing expectations that the Federal Reserve might pivot to rate cuts later this year.
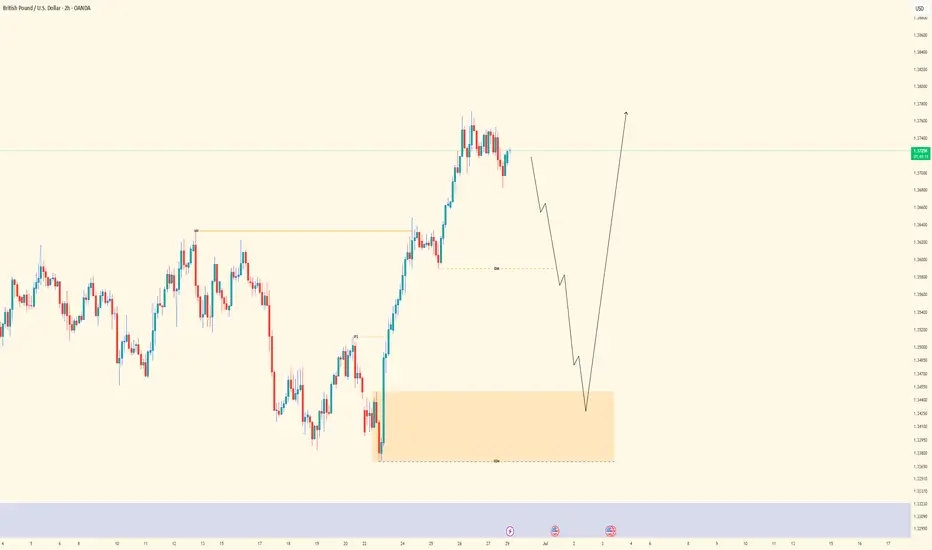
GBPUSD:
The pound surged, touching highs around 1.3770 — its strongest in nearly four years — before dipping slightly to finish the week near 1.3720
Weekly gain clocked in around +2%, the largest move since early March
Rally Fuelled By : Broader dollar weakness, easing Middle East tensions (ceasefire), and dovish Fed signals suggesting potential rate cuts.
EURUSD
The euro enjoyed a rally, peaking near 1.1754 — its highest since September 2021 — before closing the week around 1.1720
Weekly gain came to approximately +1.7% to +1.9%, driven by euro strength and broad weakness in the US dollar
Traders are eyeing upcoming US data (PCE inflation, Michigan sentiment) for next directional cues
------------------------------------
I will be approaching the markets differently from now on.
Based on the feedback from past analysis, I will be compiling all related pairs into one video, giving you guys the ability to see how one asset affects the other.
This is called inter-market relationship and it's something i've been doing for years.
It gives you confidence on what pairs are 'Hot Picks' and the ones that have a high chance of not delivering the way you want.

US10Y & ZB1! (Bonds) Weekly AnalysisUS 10‑Year Treasury Yield (US10Y)
The 10‑year yield ended last Friday (June 27, 2025) at 4.27%
After peaking above 4.46% mid‑week, yields eased late‑week as markets increasingly priced in potential Fed rate cuts—a 25 bp move in July was seen at 22.7% probability, up from ~14%
This dovish shift, alongside a softer May PCE print, supported a lull in yield increases
Still, Inflation concerns and record debt issuance continue to underpin a term premium on long-duration debt
ZB1 – 30‑Year Treasury Bond Futures
The September‑expiry T‑Bond futures (ZB1) which trade inversely to yield, saw modest price appreciation, reflecting falling yields.
Futures prices responded to the dovish Fed tone and easing global tensions, aligning with stock market gains.
The spread between 10‑ and 30‑year yields widened to ~56 bp—the largest since late 2021—illustrating increased yield curve steepening, mirrored in futures.
------------------------------------
I will be approaching the markets differently from now on.
Based on the feedback from past analysis, I will be compiling all related pairs into one video, giving you guys the ability to see how one asset affects the other.
This is called inter-market relationship and it's something i've been doing for years.
It gives you confidence on what pairs are 'Hot Picks' and the ones that have a high chance of not delivering the way you want.

NASDAQ| - Continuation Setup Fueled by Momentum📌 Pair: NAS100 (NASDAQ)
📈 Bias: Bullish
🕰 HTF View (4H):
Strong bullish momentum unfolding with structure showing clear intent to continue higher. No major signs of reversal—smart money appears to be driving price up.
🧭 MTF View (30M → 2H clarity):
Using the 2H for cleaner narrative. Waiting for a clean sweep of sell-side liquidity (SSL) into a refined OB to continue the move. 30M showing structural alignment with the bullish bias.
🎯 Entry Criteria:
LTF CHoCH → Liquidity sweep → OB mitigation
Confirm the shift and execute on the return.
🎯 Target: Structure highs above
🧠 Mindset Note:
Momentum is your ally—but don’t let speed replace structure. Follow your confirmation sequence, stay surgical, and let price do the work.
Bless Trading!

GBPUSD| - Riding the Bullish Wave with Precision📌 Pair: GBPUSD
📈 Bias: Bullish
🕰 HTF View (4H):
Major external structure (HH) broken to the upside — clear bullish intent from smart money. Strong momentum confirms continued interest in pushing price higher.
🧭 MTF View (30M → 2H clarity):
Refined bullish structure forming on 30M. Using the 2H to filter noise and spot deeper liquidity. Watching closely for a sell-side sweep into OB for cleaner, higher-probability LTF entries.
🎯 Entry Criteria:
CHoCH flip → Liquidity sweep → OB mitigation
Perfect sequence = greenlight for execution.
🎯 Target: Structure highs above
🧠 Mindset Note:
Sometimes the best entries come after everyone else gets taken out. Be the one who waits, confirms, then strikes with intention.
Bless Trading!
EURUSD| - Inducement Fueling Bullish Intent📌 Pair: EURUSD
📈 Bias: Bullish
🕰 HTF View (4H):
Clear bullish intent shown with a break above major external structure (higher high). Inducement remains intact—expecting that draw to price. Strong bullish momentum signals smart money positioning for more upside.
🧭 MTF Clarity (2H → 30M):
30M structure refined and leaning bullish, but using 2H for confirmation. Waiting on liquidity sweep into the OB zone for entry precision.
🎯 Entry Criteria:
LTF CHoCH → Liquidity Sweep → OB Mitigation
(Execution in that exact order for maximum confirmation)
🎯 Target: Structure highs above
🧠 Mindset Note:
Let the inducement play out—don’t rush it. This is where patience and clarity separate a sniper from a scalper. One clean entry > 10 reactive trades.
Bless Trading!

EURJPY ANALYSISAfter seeing the previous weekly candle close bullish confirming buying strength and it could continue into weekly highs and confluences on the daily and the 4hr suggest that too

GBPJPY| - Bullish Play with Eyes on Deeper Liquidity📌 Pair: GBPJPY
📈 Bias: Bullish
🕰 HTF View (4H):
Major external structure has been broken to the upside, showing clear bullish intent. Price hasn’t aggressively swept sell-side liquidity yet, so we stay aware of the possibility—but structure favors a continuation north.
🧭 LTF View (30M):
Refined bullish structure forming. Waiting for liquidity sweep into the 30M OB for mitigation and signs of lower timeframe shift.
🎯 Entry Criteria:
After liquidity sweep → LTF CHoCH → Return into OB
Entry off optimal zone (refined precision based on PA)
🎯 Target: Near recent structure highs
🧠 Mindset Note:
Let price come to you. Don’t chase—anticipate. We’re playing the long game through structure and flow, not emotion.
Bless Trading!

GBPUSD ANALYSIS After seeing that the previous candle closed really bullish on the week we could expect that momentum to continue since the daily and the 4hr structure are not showing any signs of reversal

XAUUSD| - liquidity Driven Buy Setup📌 Pair: XAUUSD
📈 Bias: Bullish
🕰 HTF View (4H):
Last week’s price action formed a bullish continuation structure. Internal major high taken, sweeping liquidity—confirmation of smart money interest. Expecting continuation to upside objectives.
🧭 LTF View (30M):
Waiting for clean major LH break following the sell-side liquidity sweep. Entry zones will be refined once OB mitigation confirms buyer interest.
🎯 Entry Zone:
After SSL sweep + OB tap
🎯 Target: Recent highs and continuation beyond
🧠 Mindset Note:
Trusting the flow from higher-timeframe intention down to precision entries. Patience here pays—let the structure confirm before pressing the trigger.
Bless Trading!

XAU/USD Analysis – June 30, 2025✅ Primary Scenario (Bearish Bias):
Short-term move up expected:
Price is expected to fill the Fair Value Gap (FVG) around 3,305 – 3,306.
This level aligns with a key resistance zone and also the 0.618 Fibonacci retracement, making it a strong area for a potential bearish reaction.
Downtrend continuation:
If price reacts from the resistance zone, we expect the downtrend to continue, targeting:
📍 3,256 – liquidity zone
📍 3,245 – additional liquidity below
📍 3,228 – unfilled FVG

Positioning Buy idea on Sugar (SB1!)Based on :
- Cot at extremes potential reversal
- Seasonality and quantitative analysis
- 2 Demand zones

Gala (GALA)On the above 4-day chart price action has recently corrected 50% since a sell signal in late January (ask below if you wish to see). A number of reasons now exist to be long..
1) You know why.
2) Price action finds support on the golden ratio.
3) There is a positive divergence between RSI and price action.
4) The bull flag channel, naturally a bullish pattern on confirmation of a breakout to the upper side of the channel.
5) A breakout confirmation will result in a 300% gain from current levels.
Is it possible for price action to fall further? Sure.
Is it probable? No.
Ww
Type: Trade
Risk: <= 6%
Timeframe to open: Now
Return: 300%

Is FTT token about to print a 400% move?On the above 5 day chart price action has corrected over 70% throughout 2024. A number of reasons now exist to be bullish. They include:
1) Price action and RSI resistance breakouts.
2) Trend reversal. Notice the higher low?
3) The trend reversal follows strong bullish divergence, which has now confirmed.
4) Look left. Notice where the higher low is printing? On past resistance. Excellent.
5) Lastly the bull flag, it has broken out and confirmed support. The flagpole forecasts a 400% move.
Is it possible price action continues to correct? Sure.
Is it probable? No.
Ww

Last week of June EU outlookWeekly forecast for EU. We have seen a very bullish June so far. We approached a weekly POI before starting to consolidate.
We are now entering the last week of the month where the monthly candle's upper wick needs to be formed.
In this video I have identified a potential area where we could see the pullback take place.

GOLD SHORT TRADEAronnoFX will not accept any liability for loss or damage as a result of
reliance on the information contained within this channel including
data, quotes, charts and buy/sell signals.
If you like this idea, do not forget to support with a like and follow.
Traders, if you like this idea or have your own opinion, please feel free command me.

BellRing Brands (BRBR) Weekly Gartley@ Key Levels + Kijun SignalIn March 2025, I previously took a look at this budding public company BellRing Brands, Inc. for a long-term investment horizon. It was priced around 74 at the time, then the fall of the overall market status put additional pressure on its stock, although the company itself is booming and meets my fundamental parameters. See the following:
Since then, we had an awesome and confident forward guidance from the company in the last earnings call in May 2025: bellring.com
Now, looking at BellRing Brands (BRBR) once again, on a weekly chart, key technical patterns have formed that look very promising and solid with its many confluences.
TECHNICALS:
WEEKLY:
Many weekly confluences have appeared from a technical perspective. Here is what I see:
(1) There is a clear Bullish Gartley-ish pattern in a weekly retracement to 50% followed by a retracement to 78.6% of a preceding move.
(2) The price is around 78% fib support.
(3) Horizontal area of support: The 50 - 58 area is a whole prior area of horizontal support that was a prior resistance area back in July 2024, and the price has landed back on that area. You know what we say as technicians and investors: past resistance = future support.
(4) MACD Hidden Bullish Divergence (weekly)
(5) The price tested the weekly cloud and broke through; however, bullish extremes were triggered when that happen, which is rare based on all my personal studies. In fact, the current level 55-58 marks the end of a bearish double top cycle that began around March 2025.
(6) A weekly Doji with volume support (classified as a "dVa" in my old notes of Volume Price Analysis).
Here is the weekly chart:
MONTHY:
BRBR is poised to rally Q3 and Q4 2025.
We have a potential monthly bounce of the kijun forthcoming along with good fundamentals going forward supporting the growth of the company in the long term.
** potential monthly Kijun Trend Bounce **
Here is the monthly chart:
Target:
Currently, the price is 58.54. My tentative target is around 140 by March 2026.
Thus, with all the fundamental support, good forward-looking guidance, and the technical I believe that BellRing Brands (BRBR) is at a great price right now. It is prime to continue its stretch of growth for 2025. Looking forward with investor foresight, the case for BellRing Brands and its stock (BRBR) is not only a high-probability outlook of positivity, but a high odds outcome of technical price pattern success. What a great discount.... :)

Weekly Forex Outlook Sun.June.29.2025 - Fri.July.4.2025Like and Comments would be appreciated :D Not Financial Advice, Just my outlook/opinion

Market Re-Cap and Outlook for NEXT WEEKHere I am giving you a little insight as to what trades I am currently in, taken & looking to take for the week just gone and the week coming.
1 Winning trade on EU
1 Current open position on EU
EURGPB - Breakdown
AUDUSD - Breakdown
NZDUSD - Breakdown
Gold - Breakdown
If there are any pairs you would like me to share my feedback on give me a message and I will be happy to try and do so.
Thanks
Happy Hunting

ATOM to $30On the above 6 day chart price action has corrected 90% since early 2022. A number of reasons now exist to be long, they include:
1) A trend change in RSI. In fact the first higher low to print since exiting the downtrend in June 2020.
2) Regular bullish divergence as measured over 3 months.
3) Double bottom print on legacy support.
4) The bull flag forecasts price action to the late $30 area perhaps $38.
Is it possible price action continues correcting? Sure.
Is it probable? No.
Ww
