Long trade
15
min overview
🟢 Trade Journal Entry – Buyside Trade
📍 Pair: ETHUSDT
📅 Date: Saturday, June 21, 2025
🕒 Time: 2:00 AM (Asian Session AM)
⏱ Time Frame: 15 Minutes
📈 Direction: Buyside
📊 Trade Breakdown:
Entry Price 2422.81
Profit Level 2474.60 (+2.14%)
Stop Loss 2415.04 (−0.32%)
Risk-Reward
Ratio 6.67 1
🧠 Context / Trade Notes:
BOS 5th June – 4HR Low Wick:
Break of structure observed on June 5th from a 4-hour low wick.
Observing the current NY session sweep of the liquidity from the London low wick signalled Sellside exhaustion.
Order Block & Retest:
A bullish OB formed on a prior swing, with a clean mitigation of price (Fri, 20th price range) and BOS, confirming buy-side interest.
5min TF Observation - entry:
Narrative:
Utilising DRT levels (coined by Ali Khan) to navigate the range and unfolding price action.
Target imbalance zone 1Hr.
Multiple Time Frame Analysis

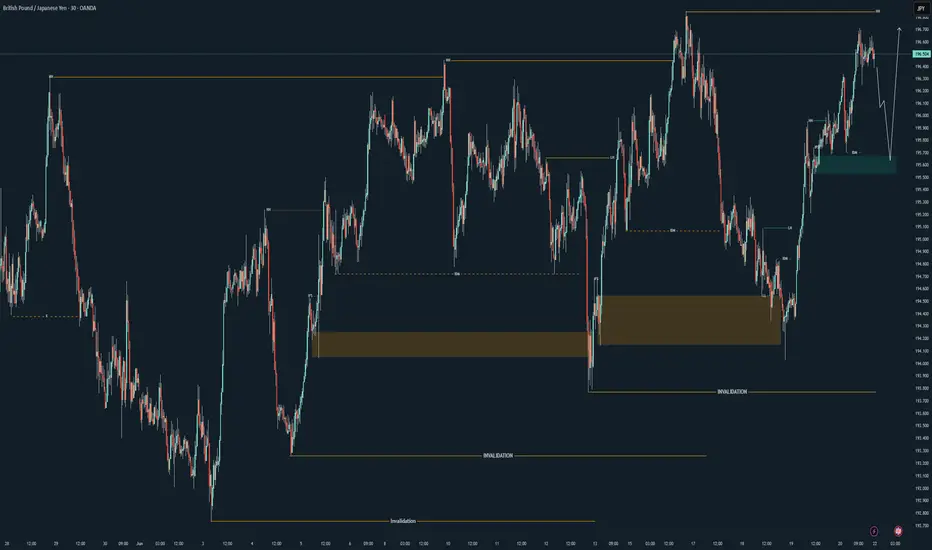
EURJPY Possible Swing Bearish Play EURJPY is shapimg up for some long-term bearish movement still to early for any plays. I will be looking to position my self in from august onwards if the fundamentals and technicals give me an indication.

GBPUSD: Bearish After Opening 🇬🇧🇺🇸
There is a high chance that GBPUSD will drop after the market opening.
I see a strong bearish confirmation after a test of a recently broken trend line.
The price formed a head & shoulders pattern and violated its neckline
on an hourly time frame.
Goal - 1.3425
❤️Please, support my work with like, thank you!❤️
I am part of Trade Nation's Influencer program and receive a monthly fee for using their TradingView charts in my analysis.

NASDAQ Bread and Butter & Turtle Soup Example XIIaight, so im gonna break down a trade i took on nasdaq today using a setup i picked out myself from the ict concepts. just my own flavor of it, ya know
before i knock out at night, i open up the charts real quick — just tryna see if there's any clean liquidity chillin’ nearby. if there aint, i shut it down and catch some solid sleep. but if there is... bingo baby
this basically means i might just wake up rich tomorrow, bro. on the daily, im seeing two strong green days back to back, and right above that boom some equal highs just sitting there, begging to get run. they are even cleaner on the 1h. bias locked in. im waking up tomorrow and hunting longs, simple as that.
i mark up the daily open first thing. if im lookin for longs, i wanna see some turtle soup under the open. if im hunting shorts, i need that setup above the open. thats just how i roll.
if there is a swing low, trend liquidity, or some equal lows carryin over from yesterday, im locked in on those levels for turtle soup. if not, im just chillin, waitin for price to build some fresh liquidity during the day and then snatch it.
in this setup, i got some leftover liquidity from yesterday plus a clean 4h fvg sittin there like a neon sign.
next, i check the time. liquidity grabs usually hit during one of the killzones depends on the pair, but im watchin asia, london, or new york sessions.
then i scope out if there is any news droppin around that time, especially stuff that could move the pair. no point in getting blindsided.
and yeah, i always peep correlated pairs too sometimes they snitch before your chart even says a word.
when all the stars and planets line up just right, that is when I drop down to the 15m and wait for a clean csd to show up. but here is the thing i dont jump in the second i see it. i wanna see price actually leave the liquidity zone.
yeah, it might lower my rr a bit, but the win rate goes way up. It keeps me outta those fake-ass turtle soups that look good at first but just wanna wreck your stop.
once im in the trade, i usually try to close out half the position the same day take profits where the chance of price reversing is damn near zero. then i let the other half ride toward my target liquidity. just lettin it breathe, do its thing.
thats it, peace out

*USDJPY| Weekly Breakdown - Bulls Took OverUJ was all bullish this week, no question about it. The chart made it clear—30M structure stayed intact, and market flow shifted heavily in favor of the buyers.
Liquidity was taken along the way, with higher lows stacking up clean, setting the stage for further continuation to the upside.
Not overcomplicating this one—bulls won the battle, and structure confirmed it. Now we look for smart ways to join that strength as price builds momentum into next week.
Stay with the flow, not against it.
Bless Trading!

*NAS100| Weekly Breakdown - Structure Is PriceWhew—Nasdaq was a wild one this week, but once you master structure, liquidity, and OBs, the chaos turns into clarity.
Price held my 30M demand zone, even after a sketchy wick-based reaction early on. First long position? Quick scalp to the highs—in and out, no burger 🍔.
Didn’t wait for a full mitigation at first—anticipated the bullish momentum by staying aligned with structure. Later, price came back and mitigated the zone with body closes, confirming the intent for another long setup into next week.
Yes, I hold trades over weekends—because here’s what I’ve figured out:
“Price is structure. Structure is price. Master that, and it flows exactly how it should.”
This week was just another example of that.
Bless Trading!

*GBPUSD | Weekly Breakdown - Patience Over PressureThis week, GU didn’t follow the original script, and that’s perfectly fine. No forced trades, no ego—we sat back and let price do what it needed to do.
Price broke straight through the 30M demand zone, showing clear bearish intent. That shift redirected my focus to the 4H demand, which held strong and gave us the real story.
Now the play is simple: I’m waiting for price to retrace back to mitigate the 30M zone, then I’ll look for continuation sales aligned with that new HTF momentum.
No stress—just adjusted bias, preserved capital, and waited for the next clean setup.
We don’t chase—we position. 😉
Bless Trading!

*GBPJPY Weekly Breakdown - Structure + PrecisionThis week, GJ moved exactly how it was supposed to—clean structure, proper mitigation, and follow-through.
Price respected the bullish flow all week, tapping into a refined 30M order block (green zone) before lifting off. That zone did its job—mitigated, held, and set the tone for the next leg up. No need to force anything here—just fundamentals and execution.
We’re still holding higher lows, and unless structure says otherwise, I’m expecting continuation next week with a clean break of those highs.
Simple reads. Clean execution.
This is how we do it. 😉
Bless Trading!
Ethereum’s Last Chance: Let Jesus Take The WheelEthereum’s price action over the course of this crypto bull run, and especially since the beginning of this year, 2025, has been nothing short of horrendous. It’s failed to hold almost every single important level that it needed to, to be able to keep pushing higher. This has caused almost all crypto investors and altcoin traders to pull their investments out, and drive the price even lower. At its current point, altcoin traders have lost all but 100% of the confidence they once had in it, and to retail investors, this is basically toxic waste once they see the losses that have been taken, it’s driving them away en masse.
With that being said, this is ETH’s final stand, it’s time to either show out, or go home with nothing to show for itself. It’s at a very critical support level right now, and if it breaks down below this, the trade will be cancelled. It’s just finished completing the ‘Jesus Take The Wheel’ pattern on the weekly & MONTHLY. This is an extremely high probability pattern, and could cause a blow-off top for Ethereum.
We also see that we got a Wykoff Pattern here, with the last one that we got around the $2k level being a fake out. The only other times it has printed aside from the last fake out, it has been the start of a bull run. ETH now has 6 weeks in total, or about 4 more weeks from now to start recovering old levels, and taking off to the moon.
I drew a bar pattern on the chart that I took from its original bullish pattern from the start of the 2013 bull run. I believe we’ll have a shortened cycle, and due to not having much time left to complete the bull run during this 4-year cycle, that’s all we will get. Thankfully, the price has been beaten down so much, that getting in now, will offer 1000% gains, in just about 6 months. This will be one of the most incredible feats in all of crypto.
Fear is at an all time high, and ETH has been teasing everyone with a bull run for months and even years now. We haven’t seen an all time high since 2021. Most investors will suffer from boredom exhaustion as well, and with the stock market also sinking, we could see a huge push once we recover some levels, for the masses to finally come into the market via Ethereum ETF’s, so they don’t have to actually risk any money moving crypto around. The boomers and traditional investors with stock accounts will be free to throw cash at these ETF’s and that’s what will give us our final pumps past all time highs, once the crypto traders all get back into the market, and get us to new ATH’s in the first place, and help us recover key levels.
One thing is clear: ETH needs to stop trying so hard to control its environment, it’s time to just let Jesus Take The Wheel 🚀

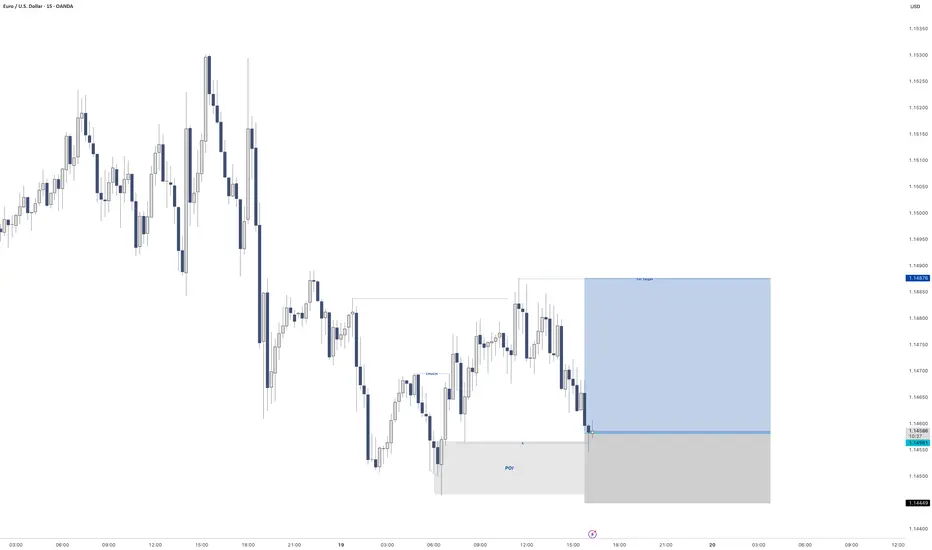
EURUSD - 2nd potential entryEvening all
Here is a still screenshot of what I am looking for the market open on EURUSD come Sunday night after the spreads have died down on the pair.
My pending order will go directly on the FVG with my stops below the manipulation of the range.
If I get tagged in great. If I don't also great if we continue to move high I mill just manage the one position.
If I am tagged in I will give you and update with a new idea and then depending on how that idea plays out win or lose I will come back and re-visit it and break it down some more.
However I have high hopes for this trade to make it up to 1.16300
Have a great weekend
and I will speak to you all soon

EURUSD - BreakdownApologies video is a bit rushed.
Wanted to get it done before the weekend arrived.
There's so much more to this video and entry reason that I have left out unintentionally like the fact we swept the Asia lows before creating a BoS. There are also a few other things like I have left out but without looking at the chart right now I cannot remember off the top of my head.
I will post the idea of this trade below so you can see that I was taking it before it played out.
Hope you all have a great weekend and a better trading week than you had this week.
Enjoy
P.S if you have any questions please do message

Long trade
🟢 Trade Journal Entry – Buyside Trade
📍 Pair: NZDUSD
📅 Date: Tuesday, June 17, 2025
🕒 Time: 3:00 PM (NY Session PM)
⏱ Time Frame: 1 Hour
📈 Direction: Buyside
📊 Trade Breakdown:
Entry Price 0.60143
Profit Level 0.60749 (+1.01%)
Stop Loss 0.60052 (−0.15%)
Risk-Reward
Ratio 6:66 1
🧠 Context / Trade Notes:
1HR OB Entry Zone:
Long trade taken off a bullish order block zone following prior mitigation and consolidation buildup.
Sweep of Internal Liquidity:
Entry positioned after a sweep of a short-term low and rejection off internal demand.

Long trade
🟢 Trade Journal Entry – Buyside Trade
📍 Pair: AUDUSD
📅 Date: Tuesday, June 17, 2025
🕒 Time: 3:00 PM (NY Session PM)
⏱ Time Frame: 1 Hour
📈 Direction: Buyside
📊 Trade Breakdown:
Entry Price 0.64738
Profit Level 0.65380 (+0.99%)
Stop Loss 0.64639 (−0.15%)
Risk-Reward
Ratio 6.48 : 1
🧠 Context / Trade Notes:
1HR TF Execution:
Entry aligned with bullish OB on the 1hr chart following a clean mitigation and rejection candle.
Stacked Confluences:
Liquidity sweep, OB retest, and session timing aligned for a high-conviction buyside setup.

Long trade
📍 Pair: EURUSD
📅 Date: Tuesday, June 17, 2025
🕒 Time: 3:00 PM (NY Session PM)
⏱ Time Frame: 1 Hour
📈 Direction: Buyside
📊 Trade Breakdown:
Entry Price 1.14816
Profit Level 1.15696 (+0.77%)
Stop Loss 1.14640 (−0.15%)
Risk-Reward
Ratio 5:1
🧠 Context / Trade Notes:
1H Structure Entry:
Trade initiated at a key bullish order block on the 1hr timeframe, following higher-timeframe trend alignment.

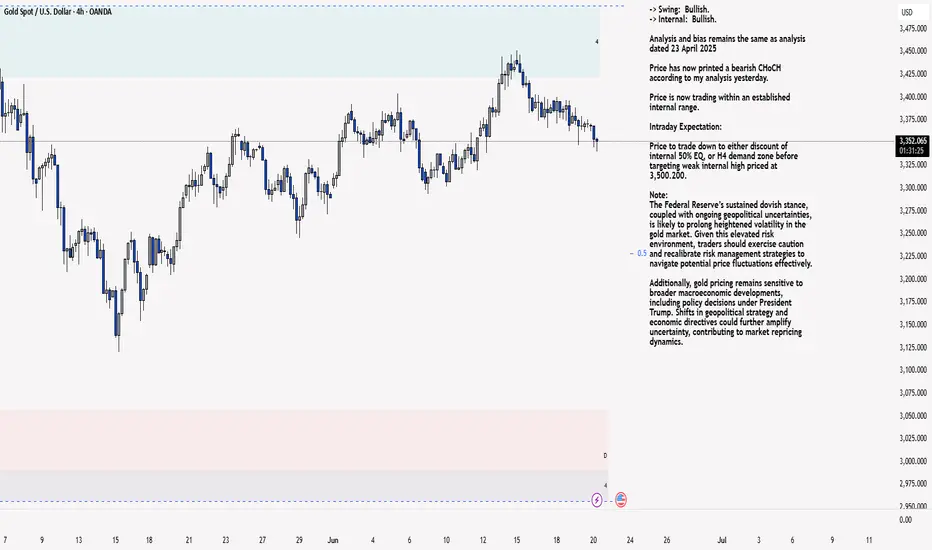
XAU/USD 20 June 2025 Intraday AnalysisH4 Analysis:
-> Swing: Bullish.
-> Internal: Bullish.
Analysis and bias remains the same as analysis dated 23 April 2025
Price has now printed a bearish CHoCH according to my analysis yesterday.
Price is now trading within an established internal range.
Intraday Expectation:
Price to trade down to either discount of internal 50% EQ, or H4 demand zone before targeting weak internal high priced at 3,500.200.
Note:
The Federal Reserve’s sustained dovish stance, coupled with ongoing geopolitical uncertainties, is likely to prolong heightened volatility in the gold market. Given this elevated risk environment, traders should exercise caution and recalibrate risk management strategies to navigate potential price fluctuations effectively.
Additionally, gold pricing remains sensitive to broader macroeconomic developments, including policy decisions under President Trump. Shifts in geopolitical strategy and economic directives could further amplify uncertainty, contributing to market repricing dynamics.
H4 Chart:
M15 Analysis:
-> Swing: Bullish.
-> Internal: Bullish.
Following previous high, and printing of bearish CHoCH, price has pulled back to an M15 supply zone, where we are currently seeing a reaction. Therefore, I shall now confirm internal high.
Price is now trading within an established internal range.
The remainder of my analysis shall remain the same as analysis dated 13 June 2025, apart from target price.
As per my analysis dated 22 May 2025 whereby I mentioned price can be seen to be reacting at discount of 50% EQ on H4 timeframe, therefore, it is a viable alternative that price could potentially print a bullish iBOS on M15 timeframe despite internal structure being bearish.
Price has printed a bullish iBOS followed by a bearish CHoCH, which indicates, but does not confirm, bearish pullback phase initiation. I will however continue to monitor, with respect to depth of pullback.
Intraday Expectation:
Price to continue bearish, react at either M15 supply zone, or discount of 50% internal EQ before targeting weak internal high priced at 3,451.375.
Note:
Gold remains highly volatile amid the Federal Reserve's continued dovish stance, persistent and escalating geopolitical uncertainties. Traders should implement robust risk management strategies and remain vigilant, as price swings may become more pronounced in this elevated volatility environment.
Additionally, President Trump’s recent tariff announcements are expected to further amplify market turbulence, potentially triggering sharp price fluctuations and whipsaws.
M15 Chart:
EURNZD: Bearish Move From Resistance 🇪🇺🇳🇿
EURNZD is going to retrace from a strong daily resistance cluster.
As a confirmation signal, I see a bearish breakout of a support line
of a rising wedge pattern on an hourly time frame.
Goal - 1.9144
❤️Please, support my work with like, thank you!❤️
I am part of Trade Nation's Influencer program and receive a monthly fee for using their TradingView charts in my analysis.

EURUSD - LongGreat set. Very close to Demand on the HTF to the left.
CHoCH on the 15min that left behind some liquidity.
Also created some liquidity to the right.
Very nice set up for me.
Triggered into the trade
Lets see how we go
USDCHF 19/06/2025Weekly:
-Bearish W pattern.
-IC.
Daily:
-Bearish W pattern.
-Previous day high liquidity sweep.
4H:
-Liquidity sweep.
-FVG.

AUDNZD: Intraday Bearish Move Ahead?! 🇦🇺🇳🇿
AUDNZD nicely reacted to a key horizontal resistance level.
The price formed a bearish CHoCH on an hourly time frame
after its test.
I expect a retracement to 1.086 level.
❤️Please, support my work with like, thank you!❤️
I am part of Trade Nation's Influencer program and receive a monthly fee for using their TradingView charts in my analysis.

SHORT ON USD/CADUSD/CAD has given a confirmation choc (change of character) from up to down on the lower timeframe (5min) from a MAJOR supply area.
I will be selling USD/CAD looking to make over 100 pips to the next demand level.

NASDAQ Analysis Stalking shorts on the Daily - nearby.
My weekly sentiment is bearish cause of technical factors.
Among the catalysts is bullish performance on the US Dollar index and price action compared to the US30 & US500.
Look to sell near 4H swing high, entry using the 15M bearish ChoCh only after three legs of bullish correction on the 1H frame into the highlighted levels of the swing high.
Anticipation is for the third leg to react bearish and the fourth leg to deliver impulse to the sell side.

GBPCAD SHORTMarket structure bearish on HTFS DH
entry at Daily AOi
Weekly Rejection at AOi
Daily Rejection at AOi
Daily EMA retest
Previous Structure point Daily
Around Psychological Level 1.85000
H4 EMA retest
H4 Candlestick rejection
Rejection from Previous structure
Levels 3.77
Entry 95%
REMEMBER : Trading is a Game Of Probability
: Manage Your Risk
: Be Patient
: Every Moment Is Unique
: Rinse, Wash, Repeat!
: Christ is King.

GBPCHF SHORTMarket structure bearish on HTFs 3
Entry at both Weekly and Daily AOi
Weekly Rejection At AOi
Daily Rejection at AOi
Previous Structure point Daily
Around Psychological Level 1.10500
H4 EMA retest
H4 Candlestick rejection
Rejection from Previous structure
Levels 4.17
Entry 110%
REMEMBER : Trading is a Game Of Probability
: Manage Your Risk
: Be Patient
: Every Moment Is Unique
: Rinse, Wash, Repeat!
: Christ is King.
