GBPUSD ANALYSISAfter seeing the previous weekly candle close bullish, and the structure on the daily and 4hr timeframes all pointing to a bullish trend we could expect the market to make a new leg to the upside.
Multiple Time Frame Analysis

XAU/USD 16 June 2025 Intraday AnalysisH4 Analysis:
-> Swing: Bullish.
-> Internal: Bullish.
Analysis and bias remains the same as analysis dated 23 April 2025
Price has now printed a bearish CHoCH according to my analysis yesterday.
Price is now trading within an established internal range.
Intraday Expectation:
Price to trade down to either discount of internal 50% EQ, or H4 demand zone before targeting weak internal high priced at 3,500.200.
Note:
The Federal Reserve’s sustained dovish stance, coupled with ongoing geopolitical uncertainties, is likely to prolong heightened volatility in the gold market. Given this elevated risk environment, traders should exercise caution and recalibrate risk management strategies to navigate potential price fluctuations effectively.
Additionally, gold pricing remains sensitive to broader macroeconomic developments, including policy decisions under President Trump. Shifts in geopolitical strategy and economic directives could further amplify uncertainty, contributing to market repricing dynamics.
H4 Chart:
M15 Analysis:
-> Swing: Bullish.
-> Internal: Bullish.
Following previous bullish iBOS and subsequent printing of bearish CHoCH, price did not pullback to either M15 supply zone, or discount of internal 50% EQ, therefore, I will not mark current iBOS but will mark it in red. The reason I am not classifying this as an iBOS is, due to relative price action, the internal range would be too narrow.
The remainder of my analysis shall remain the same as analysis dated 13 June 2025, apart from target price.
As per my analysis dated 22 May 2025 whereby I mentioned price can be seen to be reacting at discount of 50% EQ on H4 timeframe, therefore, it is a viable alternative that price could potentially print a bullish iBOS on M15 timeframe despite internal structure being bearish.
Price has printed a bullish iBOS followed by a bearish CHoCH, which indicates, but does not confirm, bearish pullback phase initiation. I will however continue to monitor, with respect to depth of pullback.
Intraday Expectation:
Price to continue bearish, react at either M15 supply zone, or discount of 50% internal EQ before targeting weak internal high priced at 3,451.375.
Note:
Gold remains highly volatile amid the Federal Reserve's continued dovish stance, persistent and escalating geopolitical uncertainties. Traders should implement robust risk management strategies and remain vigilant, as price swings may become more pronounced in this elevated volatility environment.
Additionally, President Trump’s recent tariff announcements are expected to further amplify market turbulence, potentially triggering sharp price fluctuations and whipsaws.
M15 Chart:

EURNZD Break & Retest of Double Bottom Neckline (BUY)(WEEKLY) - Price is in Strong Uptrend.
(WEEKLY) - Price formed Double Bottom Equal Lows at ( 1.88915 - 1.88078).
(WEEKLY) - Weekly Breakout Candle Closing above DB Neckline at (1.91570 - 1.91145).
(DAILY) - Double Bottom Neckline at (1.91570 - 1.91145).
(4H) - Price is forming rising higher lows inside DB Neckline.
Trade Management.
Stop loss - 1.91145
Take Profit - Previous Swing High at 1.95791.

long trade
🟢 BTCUSDT – Buyside Trade
Date: Sunday, 15th June 2025
Session: NY Session PM
Time: 5:00 PM
Entry Timeframe: Precision Intraday Entry
Trade Parameters
Entry: 104,502.89
Take Profit: 105,567.08 (+1.02%)
Stop Loss: 104,377.60 (−0.12%)
Risk-Reward Ratio (RR): 8.49
🧠 Trade Reasoning
BTCUSDT showed a textbook liquidity sweep and recovery during the NY PM session, grabbing lows below 104,400 before swiftly reversing. The entry at 104,502.89 was taken on confirmation of short-term bullish structure reclaiming the range low.

Long trade
🟢 DOGEUSDT – Buyside Trade
Date: Sunday, 15th June 2025
Session: Asia Session AM
Time: 6:30 AM
Entry Timeframe: 15min TF
Trade Parameters
Entry: 0.17421
Take Profit: 0.17838 (+2.39%)
Stop Loss: 0.17361 (−0.34%)
Risk-Reward Ratio (RR): 6.95
🧠 Trade Reasoning (Buyside)
DOGEUSDT printed a bullish market structure shift during the early Asia session after a sweep of short-term liquidity beneath the 0.17360 level.

Long trade
🟢 PEPEUSDT – Buyside Trade
Date: Sunday, 15th June 2025
Session: Asia Session AM
Time: 6:15 AM
Entry Timeframe: Short-term (scalp entry)
Trade Parameters
Entry: 0.00001112
Take Profit: 0.00001158 (+4.14%)
Stop Loss: 0.00001101 (−0.99%)
Risk-Reward Ratio (RR): 4.18
🧠 Trade Reasoning
Price action on PEPEUSDT was consolidating within a tight range following a liquidity sweep beneath the 0.00001100 handle. Entry was taken after observing bullish confirmation at a micro demand zone, with the price reclaiming a short-term range low.

Long trade
15min ~ TF
🟢 ETHUSDT – Buyside Trade
Date: Saturday, 14th June 2025
Session: Asia Session AM
Time: 8:30 AM
Entry Timeframe: Intraday (short-term confirmation)
Trade Parameters
Entry: 2518.88
Take Profit: 2554.89 (+1.43%)
Stop Loss: 2515.56 (−0.13%)
Risk-Reward Ratio (RR): 10.85
🧠 Trade Reasoning
This entry was taken after ETHUSDT displayed strong bullish intent early in the Asia session, with price forming a liquidity sweep below local lows, quickly followed by a reversal candle and bullish order block on the lower timeframes.

GBPAUD 15/06/2025Weekly:
-Bullish M pattern.
-Inverse H&S pattern.
-IC.
Daily:
-Inverse H&S pattern.
4H:
-Bullish M pattern.

BTC update!!Good day traders, here is another update on BTC and I have adjusted my narrative but my overall bias is still remaining bearish…

NZDUSD - LongWhen the market opens and the spreads die down. Will definitely be entering this trade to the upside.
We are still in a HTF bullish orderflow.
This is a great buy set up as we are at a very discounted price.
Lets see how It plays out

XAU/USD 16-20 June 2025 Weekly AnalysisWeekly Analysis:
Swing Structure -> Bullish.
Internal Structure -> Bullish.
Analysis and bias remains the same as analysis dated 16 March 2025.
In my analysis dated 27 October 2024 I mentioned (below) that price could potentially print higher-highs in order to reposition CHoCH. This is exactly how price printed. CHoCH positioning has been brought significantly closer to current price action. CHoCH positioning is denoted with a shortened blue dotted horizontal line.
The remainder of my analysis and bias remains the same as analysis dated 09 February 2025.
Price has printed a further bullish iBOS.
Price is currently trading within an internal low and fractal high. CHoCH positioning is denoted with a blue dashed line.
Price Action Analysis:
In my analysis dated 27 October 2024, it was noted that the first sign of a pullback would be a bearish Change of Character (CHoCH), indicated by a blue dotted line. Price's consistent upward momentum had repositioned previous CHoCH much closer to recent price levels as expected for weeks. Current CHoCH positioning is quite a distance away from price, therefore, it would be viable if price continued bullish to reposition ChOCH.
Note:
It is highly unlikely price will "crash" as many analysts are predicting. My view is this is merely a corrective wave of the primary trend.
Given the Federal Reserve's dovish policy stance alongside heightened geopolitical risks, market volatility is likely to remain elevated, influencing intraday price swings.
Price could also be driven by President Trump's policies, geopolitical moves and economic decisions which are sparking uncertainty and potential repricing of Gold.
Weekly Chart:
Daily Analysis:
Swing -> Bullish.
Internal -> Bullish.
Analysis and Bias remains the same as Analysis dated 11 May 2025.
Since my last weekly analysis price has finally printed a bearish CHoCH.
This is the first indication, but not confirmation of bearish pullback phase initiation.
Price is now trading within an established internal range.
Price should now technically trade down to either discount of 50% internal EQ, or Daily demand zone before targeting weak internal high, priced at 3,500.200.
Note:
The Federal Reserve’s continued dovish stance, coupled with escalating geopolitical uncertainties, is expected to sustain elevated market volatility, influencing both intraday and broader trend developments.
Additionally, price action may be further shaped by U.S. policy decisions, including measures enacted under President Trump. Shifts in geopolitical strategy and economic policymaking could introduce further uncertainty, contributing to the ongoing repricing dynamics within the gold market.
Daily Chart:
H4 Analysis:
-> Swing: Bullish.
-> Internal: Bullish.
Analysis and bias remains the same as analysis dated 23 April 2025
Price has now printed a bearish CHoCH according to my analysis yesterday.
Price is now trading within an established internal range.
Intraday Expectation:
Price to trade down to either discount of internal 50% EQ, or H4 demand zone before targeting weak internal high priced at 3,500.200.
Note:
The Federal Reserve’s sustained dovish stance, coupled with ongoing geopolitical uncertainties, is likely to prolong heightened volatility in the gold market. Given this elevated risk environment, traders should exercise caution and recalibrate risk management strategies to navigate potential price fluctuations effectively.
Additionally, gold pricing remains sensitive to broader macroeconomic developments, including policy decisions under President Trump. Shifts in geopolitical strategy and economic directives could further amplify uncertainty, contributing to market repricing dynamics.
H4 Chart:

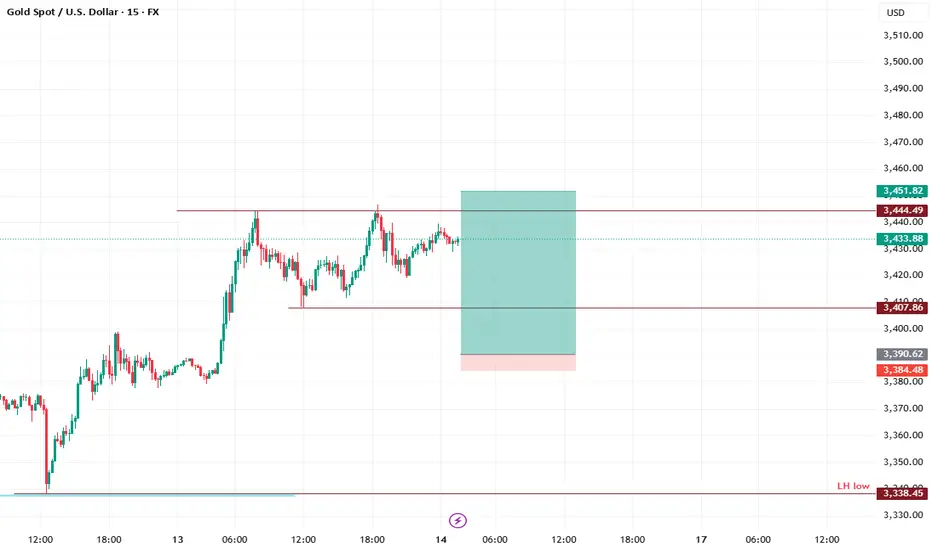
Sniper XAU/USD🎯 Setup Overview
Instrument: XAU/USD
Timeframes: Entry analyzed on M15, confirmation on M5–M1
Structure: Bullish — price making higher lows into the liquidity zone (equal highs)
📌 Entry Levels
Level Price (approx.) Notes
Sniper Entry 3,390.50 At the last higher low (HL) before reaching the liquidity zone (~3,445–3,450)
Stop Loss 3,384.50 Just below the HL — 6 pips (~$6), tight risk buffer
Take Profit 1 3,445 (liquidity sweep) First target at the sweep zone
Take Profit 2 3,500 (breakout extension) Additional profit zone if momentum continues
🛠 Entry Routine
M15 Chart: Observe the ascending HLs — last HL is our key area (~3,390.50).
Drop to M5: Watch for a bullish candle (e.g., bullish engulfing or rejection wick) forming near 3,390.50.
Enter Long once you see that bullish confirmation.
Set SL just below the HL at 3,384.50.
Scale Out / Take Profit:
Exit 50–75% at 3,445.
Move SL to breakeven.
Let the rest ride to 3,500 as momentum extends.
Short trade
Pair: SOLUSDT
Trade Type: Sell-side trade
Date: Sunday, 15th June 2025
Time: 1:00 AM
Session: Tokyo Session
Entry Timeframe: 15min TF
📍 Trade Details
Entry Price: 147.33
Profit Level: 144.54 (1.89%)
Stop Level: 148.19 (0.58%)
Risk-to-Reward Ratio (RR): 3.19
🧠 Context / Trade Notes
Trade executed during the Tokyo session, known for lower liquidity and often used to fade exaggerated price moves from the prior sessions. Price tapped into a minor supply zone formed during the late NY session, showing early signs of sell-side intent.
1Hr TF Overview

USDJPY| Bull vs Bear at Key ZoneUpdated the chart and noticed both bullish and bearish order blocks near current price — classic tug-of-war setup, and USDJPY does this often.
Structure is still developing, and the direction will be confirmed through how price reacts on the entry timeframes. Whichever side mitigates first with intent gives the trade.
Until then, it’s observation mode — watching closely and letting price reveal the path.
— Inducement King 👑
Bless Trading!

USDJPY| Bearish Structure in FocusUSDJPY broke a major lower high on the 4H, creating new external liquidity that has yet to be swept. This shift opened the door for potential bearish continuation.
On the 30-minute, I confirmed bearish intent with a major low taken. Structure aligns, but patience is key — I’m only interested in entries within premium pricing.
Now watching for buy-side liquidity to be swept into my marked order block. That reaction will be the signal for possible downside continuation.
Setup is clear. Execution comes with precision.
— Inducement King 👑
Bless Trading!

NAS100\ Bullish Play DevelopingNasdaq holds a strong bullish structure on the 4H, so I moved down to the 15-minute for a cleaner bird’s-eye view of price action. Liquidity was swept directly into a refined order block — a precise tap that validated the zone.
Price is now hovering around a 5-minute OB. Just observing and letting the market unfold.
Discipline and patience — that’s where the edge is.
— Inducement King 👑
Bless Trading!

GBPUSD| Bullish Structure HoldingGBPUSD continues to map out a bullish structure. While higher timeframe liquidity remains untouched, I’m anticipating a potential continuation on the lower timeframes.
Refined the 30-minute structure and confirmed bullish intent is intact. Now focused on price taking short-term liquidity and mitigating into the marked order block before considering any execution.
The setup is developing — staying patient and letting price come to me.
— Inducement King 👑
Bless Trading!

GBPJPY| Bullish Shift in ProcessGBPJPY broke its major lower high on the 4H, signaling a shift in directional intent to the upside. While external liquidity remains intact, I’m monitoring for a potential continuation setup.
On the 30-minute timeframe, price broke a significant high and internal structure is now aligned with bullish order flow. I’ve marked a near-term zone where price may pull back into — specifically watching for a sweep of short-term liquidity within an internal order block.
No rush. Just waiting for price to offer a high-probability entry aligned with refined structure and flow.
— Inducement King 👑
Bless Trading!

XAUUSD| Bullish Momentum Building with CLean StructureGold continues to show strong bullish momentum, with price steadily climbing and maintaining upward pressure.
I dropped to the 30-minute chart to refine structure, and the bullish narrative remains intact.
At this point, I’m allowing price to develop — waiting patiently for a potential liquidity sweep that aligns with my criteria.
No chasing, no guessing — just reading the market and executing when the story aligns.
Refined structure. Momentum confirmed.
Patiently waiting to act — as always, precision is key.
— Inducement King 👑
Bless Trading!
EU Loading the Next Leg Up| Bullish Bias in MotionEU gave that clean 4H high break — strong bullish intent locked in.
Zoomed into the 30M and spotted that refined structure doing what it does.
Now just sitting tight, waiting on market open to see if price wants to bless the kid with that next leg up.
High timeframe bias is bullish.
Mid-timeframe structure aligned.
It’s patience time — sniper mentality 🧠🎯
Bless Trading!

Short trade Pair: PEPEUSDT
Trade Type: Sell-side trade
Date: Saturday, 14th June 2025
Time: 6:30 AM
Session: London to New York Session AM
Entry Timeframe: 15min
📍 Trade Details
Entry Price: 0.00001111
Profit Level: 0.00001064 (4.23%)
Stop Level: 0.00001121 (0.90%)
Risk-to-Reward Ratio (RR): 4.70
🧠 Context / Trade note: Sell-side trade idea
Trade positioned during the London to NY session overlap, a high-volume window with strong directional momentum. Observed volume imbalance as price pushed into a minor supply zone — signs of liquidity sweep and exhaustion.
15min TF entry

Short trade Sell-side trade
ETHUSDT
Sat 14th June 25
7.30 am
Asia Session AM
Entry 2531.42
Profit level 2498.58 (1.30%)
Stop level 2547.18 (0.62%)
RR 2.08
Reason: Observing a previous failed sell-side trade, I decided to take another sell-side trade on this occasion. To add the trade was executed during the early Asia session, typically marked by lower liquidity and increased sensitivity to order flow.

Ethereum. Daily Timeframe. Seller initiativeHey traders and investors!
📍 Context
• Market phase: Sideways range
• Current control: Seller initiative
📊 Key Price Action:
The price broke above the upper boundary of the range (2738) with a buyer KC candle, touching the 50% retracement level (2874) of the last weekly seller initiative (1).
However, the seller absorbed the buyer’s candle and pushed the price back inside the range (2), forming an IKC candle (3) — the highest volume candle within the seller’s initiative.
This sequence presents three bearish signals that support a potential continuation to the downside.
🎯 Trade Idea
Likely scenario: price tests the lower boundary of the range at 3,323.
🔸 In the meantime, it’s reasonable to look for short setups on lower timeframes within the current seller initiative.
🔸 If price reaches 3,323 and valid buyer patterns appear, this zone may offer a good opportunity for long entries.
This analysis is based on the Initiative Analysis concept (IA).
Wishing you profitable trades!
