Caught EU clean today. Waited patiently for that textbook 30M liquidity sweep, then stalked the LTF entry like a sniper. No rushing—just letting price do its thing until it stopped running. Then we pounced. 💥
Execution was sharp. Setup was smooth.
This is how we trade over here—precision, patience, and purpose.
📉 Stay tuned for the breakdown and upcoming analysis.
Would love to hear y’all thoughts on this one 👀👇
#SMC #Forex #InducementKing #EUTrade #SmartMoneyFlow
Bless Trading!
Multiple Time Frame Analysis

POTENTIAL SHORT OPPORTUNITY NZDUSD...SWING TRADE OPPORTUNITYHey hey TradingView fam! Hope you are all doing amazingly well! I just wanted to make another post on here for another currency pair that I see potential opportunity on for the upcoming weeks/months here. So let's dive in!
OK so NZDUSD as you can see has been trending higher on the hourly and daily timeframes for some time now. After a long move to the downside price got exhausted and has shown us some relief over the last 6 months or so! BUT...when doing my analysis I had seen a couple things that grabbed my attention for a potential trade
NOW to be 100% honest with you guys and just so you are prepared I'm seeing this as a reaction trade not continuation trade. Basically what I mean without going into to many details is the fact that I see this REACTING from the weekly supply I have marked, making a higher low, then actually continuing to the upside RATHER than coming all the way down to take out the 0.55000 lows that it created. You may ask..."Well what makes you think that?" and the simple answer is that 0.5500 was multi-year lows...usually when price comes off of those lows and shows that buying interest (unless it is on of the rare times) it usually doesn't revisit or make new lows beyond that for some time. Economies have to rebalance, rework & renew. So for any currency to be in multi-year extremes is just not sustainable for their economy.
OK so with that explanation done let's look for shorts starting around 0.61700-0.62500 reason for that range is that it is a higher timeframe zone so price may need some time to develop and breathe before moving to downside. But as you can see it is a decent sized supply zone so let it do it's thing. But as you can see there is a fib alignment based on the downward leg from years before aligning so that is a good zone to see a "bounce".
For targets I myself personally am aiming for 0.56500 since that is the last "strong demand" zone that I can see from that buyer push. So that is the next threat so to speak if we are shorting
Alright guys that is all I have for this hope this provides some value to you guys and you can pull some nuggets or even a trade from it! Trade at your own risk understanding that this is just speculative.
Cheers! Please boost this post & follow my page for more accurate trade breakdowns!

The hell is this garbage?So, Tradingview asks to provide a meaningful analysis of my idea. Okay, here ya go....stay away from this sh!t coin. Come on, folks.....really? Where is the demand from this mofo, except when it is in the climb to the top? Answer: No fawking where....that's where! Either people don't know what the nature of this coin is, or most just know better to gamble with this brand instead of well established coins (BTC, ETH, SOL, etc.). Look, just steer away from this money pit until shown otherwise (volume increase due to demand). Personally, looking at this coin brings about as much excitement as looking at my smear of excrement on the toilet paper after a healthy phat dump. Yeah.....you know what I mean.

EUR/USD 1H Analysis – Bullish Reversal Setup
After a strong bearish push from the 1.16000 supply zone, price tapped into a high-probability demand zone (highlighted in grey) near the 1.15000 psychological level. The price action shows multiple bullish rejections from this zone, suggesting the presence of institutional buying interest.
Key observations:
Bullish Order Block: Price respected a bullish order block within the demand zone.
Liquidity Sweep: Sell-side liquidity was taken just below the recent lows, indicating a potential manipulation before a move higher.
Market Structure: Although the immediate structure is bearish, the reaction from demand shows early signs of a possible bullish reversal.
Entry Concept: A long setup is anticipated from the current zone with potential continuation toward the previous high at 1.16000 (marked target).
Risk Management: Stops can be placed just below the demand zone, targeting the imbalance and previous supply zone above.
The dotted red arrow reflects the projected bullish move based on the smart money concept—buying from demand after liquidity sweep and targeting inefficiencies.
This setup aligns with a smart money concept (SMC) approach: demand zone respect, liquidity grab, and a potential BOS (break of structure) forming.
Would you like me to generate hashtags and a short caption for posting as well?
📈 EUR/USD 1H – Smart Money Precision Entry
Liquidity swept ✅
Tapped into demand ✅
Institutional footprints spotted ✅
Now waiting for that bullish reversal to send us flying to 1.16000 🚀
#SmartMoneyConcepts #SMC #EURUSD #ForexTrading #OrderBlock #LiquidityGrab #PriceAction #FXTradingClub #MarketStructure #ReversalSetup #ForexSniper #TradingView #ForexAnalysis

XAU/USD 13 June 2025 Intraday AnalysisH4 Analysis:
-> Swing: Bullish.
-> Internal: Bullish.
Analysis and bias remains the same as analysis dated 23 April 2025
Price has now printed a bearish CHoCH according to my analysis yesterday.
Price is now trading within an established internal range.
Intraday Expectation:
Price to trade down to either discount of internal 50% EQ, or H4 demand zone before targeting weak internal high priced at 3,500.200.
Note:
The Federal Reserve’s sustained dovish stance, coupled with ongoing geopolitical uncertainties, is likely to prolong heightened volatility in the gold market. Given this elevated risk environment, traders should exercise caution and recalibrate risk management strategies to navigate potential price fluctuations effectively.
Additionally, gold pricing remains sensitive to broader macroeconomic developments, including policy decisions under President Trump. Shifts in geopolitical strategy and economic directives could further amplify uncertainty, contributing to market repricing dynamics.
H4 Chart:
M15 Analysis:
-> Swing: Bullish.
-> Internal: Bullish.
As per my analysis dated 22 May 2025 whereby I mentioned price can be seen to be reacting at discount of 50% EQ on H4 timeframe, therefore, it is a viable alternative that price could potentially print a bullish iBOS on M15 timeframe despite internal structure being bearish.
Price has printed a bullish iBOS followed by a bearish CHoCH, which indicates, but does not confirm, bearish pullback phase initiation. I will however continue to monitor, with respect to depth of pullback.
Intraday Expectation:
Price to continue bearish, react at either M15 supply zone, or discount of 50% internal EQ before targeting weak internal high priced at 3,444.495.
Note:
Gold remains highly volatile amid the Federal Reserve's continued dovish stance, persistent and escalating geopolitical uncertainties. Traders should implement robust risk management strategies and remain vigilant, as price swings may become more pronounced in this elevated volatility environment.
Additionally, President Trump’s recent tariff announcements are expected to further amplify market turbulence, potentially triggering sharp price fluctuations and whipsaws.
M15 Chart:

NZDCHF: Another Pullback Trade 🇳🇿🇨🇭
I see one more pullback opportunity on NZDCHF.
My confirmation is an ascending triangle pattern
formed on a key horizontal support.
Goal - 0.4896
❤️Please, support my work with like, thank you!❤️
I am part of Trade Nation's Influencer program and receive a monthly fee for using their TradingView charts in my analysis.

$SUI heading back to $1.50 or belowAll of crypto is about to fall significantly, most people just don't realize it yet. Many alts will fall 50%+, and coins like SUI and XRP that people feel safe in, won't escape the bearish move.
Just looking at the chart, we can see that SUI broke upwards in August of last year and topped in January, and has since retested resistance at $4.05 and rejected-- forming a large lower high.
It makes the most sense to me that we will now see price retest the lows that price broke out from as they never got tested on the way up.
We should see price fall down to the lower support levels over the coming weeks.

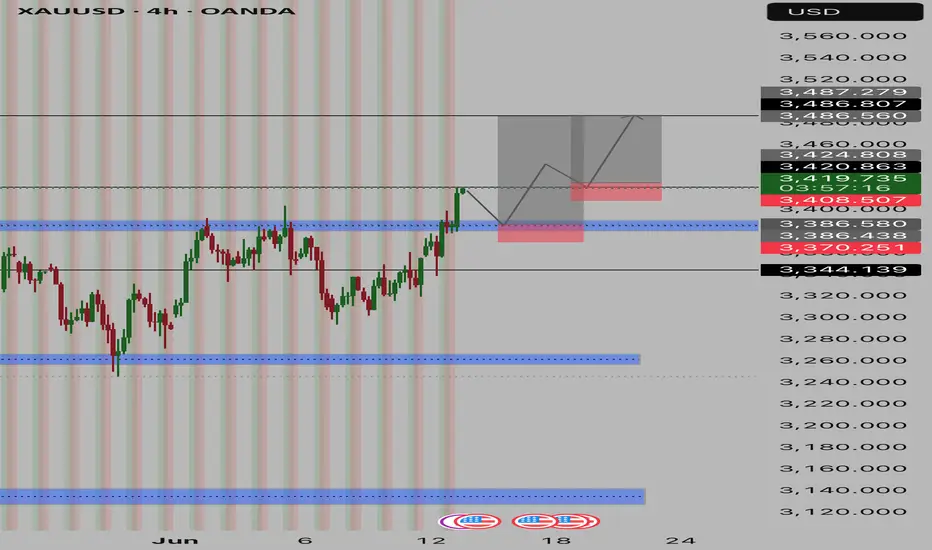
MY VIEW ON XAUUSDPrice should come back to the previous broken support on the 4hr time frame , but my entry would be on 15min that’s where I will be looking out for bullish momentum to take it up ….
EURUSD, GBPUSD & EURGBP analysisHere's my outlook on the 3 pairs mentioned in the title. Looking for more upside momentum after we have some sort of pullback into the premium discount prices.
Once we get some15min bearish internal orderflow on the lower Time Frames I will look to enter short term sell positions before looking to take longer term buys on the way back up.
Again, if I can be of any assistance please do let me know and I will be happy to help where I can.

CADJPY 12/06/2025Weekly:
-Bearish W pattern.
-IC.
-Liquidity sweep.
-Expecting a bearish reaction.
Daily:
-H&S pattern.
-IC.
4H:
-H&S pattern.

Stock Of The Day / 12.06.25 / GME06.12.2025 / NYSE:GME
Fundamentals. Decrease on the news of a $1.75 billion bond issue
Technical analysis.
Daily chart: Wide sideways trend.
Premarket: Gap Down on increased volume.
Trading session: The initial impulse from the opening of the session was stopped at 22.90. Then there was an attempt to reverse the downtrend, but it was unsuccessful and the price tested the 22.90 level at 10:30 a.m. After that, the price continued to smoothly tighten to the level, forming pullbacks, each of which was smaller than the previous one. Please note that after 11:00 a.m. the pullbacks become very weak, which indicates the strength of sellers. We are considering a short trade to continue the downward movement.
Trading scenario: #breakdown (#break of the base) of level 22.90
Entry: 22.87 aggressive entry when the candle closes below the level. Breaking the base is usually accompanied by a strong impulse movement, so we do not expect a retest.
Stop: 23.01 we hide it behind the high of the last pullback
Exit: We observe an impulse non-pullback movement. Cover part of the position when RR 1/3 is reached, cover the remaining part of the position when the stop is moved to RR 1/3
Risk Rewards: 1/3
P.S. In order to understand the idea of the Stock Of The Day analysis, please read the following information .

ISRG Daily Chart: Anticipating a Bounce from Key Demand Zone Overview:
ISRG has been in a recovery phase since its lows in early April, establishing an upward trend. However, after hitting significant resistance in May, the stock has entered a corrective pullback. This chart outlines a potential long setup, waiting for a strategic entry at a confluent demand zone.
Key Observations & Levels:
1. Post-April Recovery: Following a sharp decline, ISRG initiated a strong recovery in early April, demonstrating clear higher highs and higher lows (represented by the initial green zig-zag line).
2. Supply/Resistance Zones (Red Boxes):
o Upper Resistance (600 - 620): This zone represents a significant overhead supply from previous highs in February/March. It is the primary target for any significant bullish move. The chart specifically highlights "Target 600" (601.23).
o Intermediate Resistance (550 - 570): This zone acted as strong resistance in May/early June, leading to the current pullback. Price failed to sustain above this level, signaling a need for a deeper correction before a sustained push higher.
3. Demand/Support Zone (Green Box: ~480 - 500):
o This is the critical "buy zone" highlighted on the chart. It aligns with previous support levels and a potential area where strong buying interest emerged. The chart specifies an entry point around 488.77. This is where we anticipate buyers to step in and reverse the current short-term bearish momentum.
4. Current Price Action & Potential Path (Dotted Line):
o ISRG is currently trading around 512.82, in a clear pullback from the intermediate resistance. The dotted line indicates a possible path where the price might consolidate or even attempt a small bounce before ultimately heading lower to tag the key demand zone. This suggests a patient approach, waiting for the price to reach the optimal entry area.
Trade Plan:
This setup is based on the anticipation of a strong bounce from the defined demand zone:
• Entry Zone: Wait for price to enter the 480 - 500 demand zone. The chart's proposed entry is precisely at 488.77.
• Stop-Loss: A tight stop-loss is placed below the demand zone at 457.71. This level represents a clear invalidation point for the bullish thesis, as a break below it would indicate further downside pressure.
• Target: The primary target for this long setup is the 600 - 620 overhead resistance zone, specifically marked at 601.23. This offers a favorable risk-to-reward ratio.
Scenario:
The most probable scenario outlined is that ISRG will continue its current correction, potentially with some minor bounces, until it reaches the strong demand zone between $480 and $500. From there, we anticipate a significant rebound, aiming to challenge the $600 target.
Invalidation:
A sustained daily close below $457.71 would invalidate this bullish setup, suggesting that the current downtrend is stronger than anticipated and could lead to further significant declines.
Conclusion:
ISRG presents a compelling long opportunity if it continues its pullback to the robust demand zone around
480−500. Patience is key to capturing this potential reversal for a move towards the $600 target. Always manage your risk accordingly.
Disclaimer:
The information provided in this chart is for educational and informational purposes only and should not be considered as investment advice. Trading and investing involve substantial risk and are not suitable for every investor. You should carefully consider your financial situation and consult with a financial advisor before making any investment decisions. The creator of this chart does not guarantee any specific outcome or profit and is not responsible for any losses incurred as a result of using this information. Past performance is not indicative of future results. Use this information at your own risk. This chart has been created for my own improvement in Trading and Investment Analysis. Please do your own analysis before any investments.


Buy Idea on Us Dollar Index (Dxy)Based on :
- Demand zone
- Pin bar Reversal
- Changing of correlation between dxy and zb1!
- cot report

EURGBP: Overbought Market & Pullback🇪🇺🇬🇧
EURGBP nicely respected a key daily horizontal resistance.
After a liquidity grab above that, the price formed
a strong bearish imbalance candle on an hourly time frame.
I think that the pair will retrace to 0.85
❤️Please, support my work with like, thank you!❤️
I am part of Trade Nation's Influencer program and receive a monthly fee for using their TradingView charts in my analysis.

EU| Workflow - End of Week but Still in SyncPrice still pushing with strong bullish conviction, so I’m just flowing with it and waiting on that precision entry — nothing forced, just discipline and patience.
Even though we’re nearing the end of the week, the workflow and higher timeframe analysis still align, so I’m staying ready. I’ve got my zones mapped out and I’m watching for price to pull back into that green zone POI. Once that mitigation happens, I’ll drop to the 1M for the structure shift and look for that 5M LH break to confirm my entry.
Just letting the setup mature and keeping emotions out of the way. 📊
Always open to hearing how others are viewing EU right now — let’s elevate the convo while we wait on the market to give us the greenlight. 🎯
#SMC #EU #SmartMoney #TopDownPrecision #InducementKing #JuicemannnStyle #ForexFlow #EndOfWeekExecution
Bless Trading!
Global M2 Money SupplyWith more money than ever before in circulation available. Asset prices should go up..
Do you agree or disagree?

SHORT ON EUR/JPYOn the 1 min Timeframe EJ has given us a choc (change of character) to the downside with a nice break and retest to a major supply area.
The JPY index is bullish which should cause EJ to fall.
I will be selling EJ to the next level of demand looking to catch 100-200 pips.

EUR/USD: Weekly PAT + VPA 5/11/2025Trading Analysis EUR/USD - Price Action and Volume Price Analysis
Weekly Structure Analysis: At present, we find ourselves within a bullish weekly range. The lower boundary of this range is 1.07330, established during the week of March 24, 2025, while the upper boundary is at 1.15734, reached the week of April 21, 2025. The price movement from 1.073 to 1.157 has surpassed a swing high, which we will identify as our initial resistance point as we aim to return to 1.15734.
Weekly Price Action Analysis: Analyzing structure and price action reveals similarities. Our confidence in a bullish trend is the anchored weekly bar. The weekly candle from the week of April 7, 2025 serves as this anchor. Following the inside bar, we observed a bearish pin bar, which acts as a Bullish Reacher since its wick exceeded the high of the anchor bar's wick (Wick on Wick). The market shows signs of wanting to rise, but it must first hit a demand zone that weekly traders are keen to engage with.
Volume Price Analysis: The last four weekly candles have demonstrated limited strength in driving the market lower, with support holding at 1.11927 (1.12). As the price declines, trading volume is decreasing, following a sharp upward movement, likely due to profit-taking or repositioning. Volume analysis indicated we should retest 1.15734.
Good luck and happy trading!
OANDA:EURUSD TVC:DXY

CRUDE OIL (WTI): Pullback From Key Level
WTI Crude Oil looks overbought after a test of key daily horizontal resistance level.
A violation of a minor horizontal support on an hourly time frame after its test
provides a strong intraday confirmation.
I expect a retracement to 66.33 level.
❤️Please, support my work with like, thank you!❤️

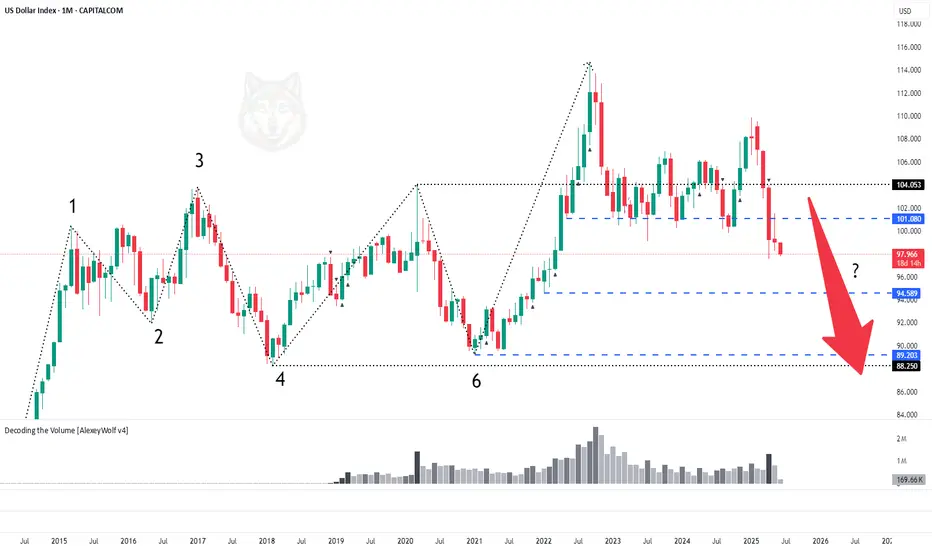
DXY. Midterm Analysis of the US Dollar IndexHey traders and investors!
📍 Context
On the monthly timeframe, the market was in a range. The price broke above the upper boundary and was long supported around the 101.080 level. This level was repeatedly tested by sellers and now appears to have been broken.
📊 Monthly targets: 89.20 and 88.300.
🔎 Analysis
Why might the downward movement continue?
Daily TF
On the daily chart, we can see that on the day buyers returned to the 101.080 level, the main volume was accumulated in a buyer candle right at and slightly above the level. This suggests the level was defended by sellers. This indicates they are currently in control, and the decline may continue. Let’s look at the nearest potential buyer activity levels.
11-day TF
The price has once again broken downward out of the range. Below, there is a small consolidation area formed during the previous upward movement. Its boundaries are: upper boundary — 97.385, lower boundary — 94.589.
🎯 Trade Idea: Rebounds from the upper boundary at 97.385 are possible, but overall the priority remains with a move into this range and towards the 95.00–94.589 zone.
This analysis is based on the Initiative Analysis concept (IA).
Wishing you profitable trades!
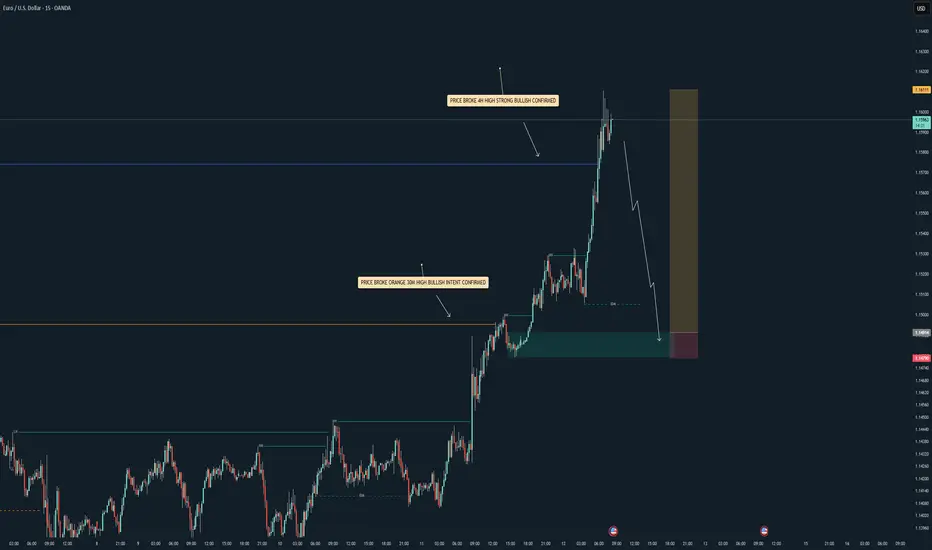
EURUSD| Riding the Real FlowInitially waited for price to return to my first POI — didn’t happen. Instead, price BOS’d and unlocked fresh liquidity. No panic. I’m not here to force old zones — I follow structure.
Now we’ve got:
✅ 4H bullish momentum still active
✅ Fresh BOS creating new intent + liquidity
✅ 30M heavy bullish push showing strength
✅ Top-down alignment from 4H → 30M → 5M
✅ Mitigation + sweep + OB entry on deck
That clean demand zone is holding value — I’m just staying patient, letting price do its thing. As always: “We sit. We wait. We strike.”
When it aligns — I’m in. Until then, I’m chilling like the sniper I am.
#SMC #JuicemannnFlow #TopDownMastery #ForexSniper #StructureTalks #InducementKing #EURUSD #RideTheMomentum #4HTo5M #LiquidityReads #FundedTraderMoves
Bless Trading!

