EURAUD 02/06/2025Weekly:
-Bullish M pattern.
-Expecting a weekly bullish candle.
Daily:
-Bullish M pattern.
-IC.
4H:
-Bullish M pattern.
-Inverse H&S pattern.
Multiple Time Frame Analysis

XAUUSD Bullish Signal | Technical + Custom AlgoSmart Trend Signal | Technical Analysis + Custom Algorithm
This signal is the result of a combination of classic technical trend analysis and a proprietary software I personally developed.

EURUSD Bullish Signal | Technical + Custom AlgoSmart Trend Signal | Technical Analysis + Custom Algorithm
This signal is the result of a combination of classic technical trend analysis and a proprietary software I personally developed.

EURUSD Sell – June 2, 2025 (Re-entry)Still maintaining the same HTF bearish bias – daily OB + D trend direction, with liquidity above W/D highs already swept.
After initial stop-out, price offered a cleaner entry: reacting from a 15m POI, followed by a clear BOS on the 1m timeframe.
Plan is to enter on the retest of the 1m OB left behind after the break.
First TP at 1:3 RR, with extended targets below Asia lows if momentum continues.

Nasdaq giving hints of bearishness failing to close above rangePlease review what I think I'm seeing. If you have any comments in regard to these potential levels they are always welcome.
I believe we may be actually bearish from here but without a daily close below the highest block, my decided choice must be neutral. Purely mechanical analysis will save your portfolio 💎
Don't forget to subscribe & share this with someone who is learning 🙏🏾

EURCAD BUYPrice is in a Weekly Uptrend.
Price attempted to reverse with head & shoulders but failed instead making new higher low at (1.54797).
Price is making rising higher lows and higher highs as it approaches head & shoulders neckline.
Key Support & Resistance level that is tested multiple times at (1.56981 - 1.56659) the more a level is tested 80% chance it breaks.
Rising trendline in H4.that price has respected.
If price breaks and closes above 1.57608 the B.O is confirmed.
For more conservative entry wait for the retest to confirm the BO and enter the trade

Capture SwingPrice broke head & shoulders neckline and retested it.
Price formed new lower low and lower high all bearish market structure.
Strong rejection with shooting star at the neckline.

EURUSD Short June 2, 2025EURUSD Sell – June 2, 2025
Bearish narrative across the board. HTF aligned with daily OB + D trend, plus clear liquidity sitting at previous weekly and daily highs.
On LTF, we had clean 15m bearish structure forming during Asia, and price tapped into the HTF OB during London open, rejecting from session high.
Entry was based on tap (0.5% Risk) and will reenter with another 0.5% after 1m BOS.
Partials taken at 1:3 RR, with final TP set at Asia low for full move.

DXY Update..PWL takenGood day traders I’m back yet again with another update but this this it’s DXY(dollarindex)).
Price has taken previous week’s low, and for me that’s the manipulation phase in the power of 3 because my bias is bullish on the dollar and bearish on foreign currencies. Price has taken the PWL in a zone/area where we saw price react higher in that BPR zone/area. For the rest of the week I personally believe we can expect higher prices on DXY, Atleast till the midpoint of that gap above price. ICT teaches more on the importance of that halfway/midpoint of gaps and other PD arrays.
Since we are in a discount zone we can expect price to move higher into the premium range of the daily TF dealing range and our first liquidity (internal) is also inside the premium zone.

SHORT ON EUR/USDEUR/USD has just swept a previous high and has plenty of liquidity to the downside to capture.
I will be selling EU to the next swing low looking to catch 80-100 pips.

XAUUSD - Gold is on the verge of a very important week!Gold is trading above the EMA200 and EMA50 on the four-hour timeframe and is trading in its ascending channel. I predict the path ahead for gold to be upward and if the resistance level is broken, we can look for buying opportunities. If gold corrects, we can also buy it with a reward at an appropriate risk.
Gold prices experienced a mild decline over the past week, with market sentiment shaped less by fundamental shifts and more by mixed messages and scattered commentary around tariffs.Despite the noise, many traders chose to rely on data and technical charts rather than reacting emotionally—data that painted a more subdued picture than the headlines suggested.
Rich Checkan, CEO of Asset Strategies International, responded confidently in a recent survey, predicting further gains in gold. “The trajectory for gold is clearly upward. Prices have stabilized around the $3,300 level and appear ready for a new rally, especially if the appellate court’s ruling on tariffs is upheld,” he said.
Checkan also pointed to another macroeconomic factor that could support gold: “A new tax bill, described as large and costly, is set to be voted on in the Senate soon. If passed, it will likely widen the budget deficit, which historically leads to increased liquidity and rising inflation—a favorable environment for gold.”
On Friday, the PCE inflation report showed easing price pressures, though not enough to put the Federal Reserve at ease. Core PCE (excluding food and energy) rose by 0.1% month-over-month and 2.5% year-over-year in April—matching expectations and slightly down from 2.7% the previous month. The headline PCE also increased 2.1% annually, just below the forecast of 2.2%.
The key point: these data reflect the first month in which Trump’s new tariffs were active, yet there’s little evidence so far that they’ve caused inflation to rise. Still, the disinflationary trend remains sluggish and distant from the Fed’s 2% target. In its latest minutes, the Fed warned that inflation may prove more persistent than previously thought.
Nick Timiraos of The Wall Street Journal, despite the seemingly positive PCE numbers, issued a cautionary note with four key insights:
• The inflationary impact of tariffs is expected to begin showing up from May and be fully reflected in June’s data. This could accelerate goods price increases and disrupt the path of disinflation.
• Last year’s monthly PCE figures were particularly weak (May: 0%, June: 0.1%, July: 0.2%). As these drop out of the annual calculation, even if monthly gains remain steady, YoY rates could rise mathematically.
• The three-month average for Core PCE from May to October 2024 was only 0.1%. If upcoming monthly figures hit 0.2%, annual disinflation could stall or even reverse.
• While the latest report is encouraging, the effects of tariffs and the removal of last year’s weak data could complicate the inflation trajectory.
Looking ahead, market attention will focus heavily on a suite of crucial U.S. labor market indicators. The Job Openings and Labor Turnover Survey (JOLTS) is due Tuesday, private sector employment data (ADP) on Wednesday, and jobless claims on Thursday. However, the most anticipated release will be Friday’s Non-Farm Payrolls (NFP) report for May—widely viewed as a key factor influencing rate expectations.
Alongside labor data, markets will also watch other critical economic reports. The ISM Manufacturing PMI on Monday and the ISM Services PMI on Wednesday will offer broader insight into U.S. business activity. In the realm of monetary policy, interest rate decisions from the Bank of Canada (Wednesday) and the European Central Bank (Thursday) are expected to trigger notable movements in the currency and gold markets.

NZDCAD ENTRY CHART On this pair,we will be looking at more bearish movements,as it's trend is still Bearish, also we had a valid supply zone with SNR Confluence, MTF analysis also Included. We will be watching out for this pair today, update will be given in the comment session as price plays forward. THANK YOU

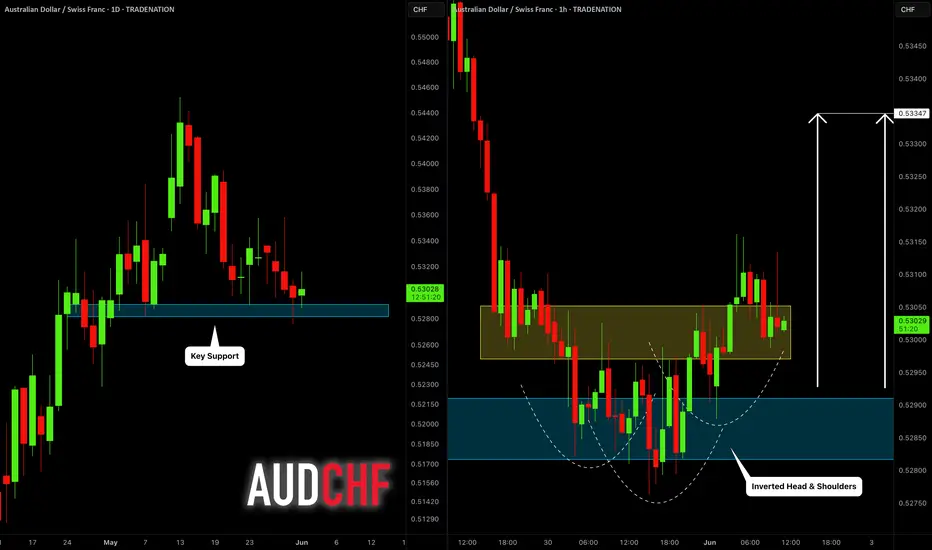
AUDCHF: Bullish Move From Support 🇦🇺🇨🇭
AUDCHF is going to bounce from a key daily horizontal support.
Our confirmation signal is a formation of an inverted head and shoulders
pattern on an hourly time frame and a violation of its neckline.
Goal - 0.5335
❤️Please, support my work with like, thank you!❤️
I am part of Trade Nation's Influencer program and receive a monthly fee for using their TradingView charts in my analysis.
AUDUSD Bullish Signal | Technical + Custom AlgoSmart Trend Signal | Technical Analysis + Custom Algorithm
This signal is the result of a combination of classic technical trend analysis and a proprietary software I personally developed.

EURAUD BUYSH4 resistance got broken and retest is being made. Price is above 50EMA. Looking at 1.77500 as target.

INVERSE HEAD AND SHOULDER PATTERNWe wait for the break and close on the daily time frame then we can start talking about entry

Inverse head and shoulders chart pattern We have to wait for the daily to close before we can talk about entry

Everybody loves Gold Part 2A good start to Gold Journey
In Part 2, we highlight a cluster of levels around close of Week 21. Price could however gap up or down and that will determine next moves.
At the moment though, we expected price to follow the arrow path for a down week.

FIRST TRADE OF JUNE AUDJPY 01/06/2025Weekly:
-Bearish W pattern.
-IC.
-Previous week high liquidity sweep.
Daily:
-Bearish W pattern.
-IC.
-H&S pattern.
4H:
-H&S pattern.
-IC.
-FVG.

The double top chart patternThe claim boss breaking the neckline show strength of sellers coming into the market structure on the neckline is building a structure on the 15m building a head of shoulder chart pattern so watch out for the momentum that breaks the neckline and the pullback into the neckline once you see the exhaustion pullback coming in Play please begin by clicking tothe sell button

On the RisePrice of the support level on the daily time frame creating an inverse head and shoulder pattern on the 1H let's get ready

FOMO & An Inside Bar Entry Into A Larger Head & Shoulder PatternAn handful of lessons in this video so hang on.
1) We take a look at the dangers that come with entering a trade too early & what you should do if you ever find yourself in that situation.
2) A discussion ion inside bars, what they are, how to trade them and an indicator that will help you spot them.
3) How to use that inside bar as an entry reason into a bigger head and shoulders pattern on the larger timeframe.
Please leave any questions or comments below!
Akil

AUDUSD Support & Resistance LevelsThese zones have been generated using a custom-built software tool, developed and refined over an extended period of time. The tool is the result of dedicated effort and research, aiming to identify high-probability support and resistance areas with precision.
