EURUSD Support & Resistance LevelsThese zones have been generated using a custom-built software tool, developed and refined over an extended period of time. The tool is the result of dedicated effort and research, aiming to identify high-probability support and resistance areas with precision.
Multiple Time Frame Analysis

USD/CAD downhill from here?C$1.3945 was made short work of in April and retested as resistance in May, following a fourth consecutive month in the red. Technically speaking, the scope to explore deeper water is evident on the monthly scale until C$1.3534, followed by another layer of support from C$1.3242.
In view of this, as well as the lack of bullish intent evident from trendline support on the daily chart last week, extended from the low of C$1.2007, a breakout lower here could trigger further downside towards a daily support area between C$1.3550 and C$1.3601.
Written by FP Markets Chief Market Analyst Aaron Hill

Final BTCUSD update..Good day traders, here is my final update on BTCUSD and I like how price has been respecting our PD arrays. Keep in mind traders price moving in waves and what again😂😂🏃🏾♂️, point is today is the last trading day for the week and my thoughts is that we can expect BTCUSD to start going higher today and tomorrow maybe till Tuesday …sorry I’m being too sure but if you focus on time and price you start to KNOW(ledge) things or maybe I should say secrets?!🤨🤔
I always expect price to manipulate higher if my bias is shorts, ICT’s power of 3 works wonders when it come to this thought process.
Watch how price reacts to the FVG where price is trading now, it’s not a signal just watch out price moves always from it for the rest of today.
We only going high to shoot lower…keep that in mind!!🤯

GOLD FORCAST FOR NEXT WEEK
AronnoFX will not accept any liability for loss or damage as a result of
reliance on the information contained within this channel including
data, quotes, charts and buy/sell signals.
If you like this idea, do not forget to support with a like and follow.
Traders, if you like this idea or have your own opinion, please feel free command me.

GBPJPY update!!Good day traders, I’m back with yet another beautiful setup on GJ and I really wish we can all monitor how price plays out and learn more about price signature.
For this setup I’ll explain more about it after the fact because it’ll help me make my point clearer and easily understandable.
Yet another gift..🎁🧧

Short trade
1Hr overview
📘 Trade Journal Entry — DOGEUSDT (Sell-side Trade)
🗓 Date: Friday, 30th May 2025
⏰ Time: 3:00 PM
📍 Session: Tokyo to London PM
📈 Timeframe: 1hr (intraday/swing)
📊 Market Structure Tool: Price Action — Lower Highs + Liquidity Sweep
🧠 Confirmation Tool: Bearish structure break + Premium pricing zone
🔹 Trade Details:
Entry Price: 0.20466
Take Profit: 0.18205 (−11.05%)
Stop Loss: 0.20691 (+1.10%)
Risk-Reward Ratio: 10.05
🔹 Market Structure:
Bearish price action is evident, characterised by a sequence of lower highs and lower lows.
Entry aligned with price returning to the premium zone before resuming its downward trend.
Liquidity Sweep & Confirmation:
Entry followed a sweep of local highs, indicating engineered liquidity.
Immediate rejection at the sweep point and entry at the confirmation candle.
Momentum:
Strong bearish momentum post-entry, with volume confirming sell-side intent.

GBPAUD SellsI'm seeing that price has broken out of its' buyer induction. It has now aggressively pulled away from the highs that have been set in the last month. I'm looking for a bullish pullback followed by a continuation of sells. I see price at least coming back to the lows it set this week.

WTI Support & Resistance LevelsThese zones have been generated using a custom-built software tool, developed and refined over an extended period of time. The tool is the result of dedicated effort and research, aiming to identify high-probability support and resistance areas with precision.

XAUUSD Support & Resistance LevelsThese zones have been generated using a custom-built software tool, developed and refined over an extended period of time. The tool is the result of dedicated effort and research, aiming to identify high-probability support and resistance areas with precision.

ETHEREUM Bearish Signal | Technical + Custom AlgoSmart Trend Signal | Technical Analysis + Custom Algorithm
This signal is the result of a combination of classic technical trend analysis and a proprietary software I personally developed.

DOGECOIN Bearish Signal | Technical + Custom AlgoSmart Trend Signal | Technical Analysis + Custom Algorithm
This signal is the result of a combination of classic technical trend analysis and a proprietary software I personally developed.

DOGECOING Bearish Signal | Technical + Custom AlgoSmart Trend Signal | Technical Analysis + Custom Algorithm
This signal is the result of a combination of classic technical trend analysis and a proprietary software I personally developed.

BTCUSD Bearish Signal | Technical + Custom AlgoSmart Trend Signal | Technical Analysis + Custom Algorithm
This signal is the result of a combination of classic technical trend analysis and a proprietary software I personally developed.

BITCOIN Bearish Signal | Technical + Custom AlgoSmart Trend Signal | Technical Analysis + Custom Algorithm
This signal is the result of a combination of classic technical trend analysis and a proprietary software I personally developed.

Short trade
Entry: Day TF
Trade Type: Sell-side Trade — SOL/USDT
Date: Friday, May 30, 2025
Time: 4:36 PM — London Session PM
Observed Timeframe: 15min
Entry: 163.099
Take Profit (TP): 147.229 (−9.73%)
Stop Loss (SL): 164.373 (+0.78%)
Risk-Reward Ratio (RR): 12.46
Entry Rationale: The entry at 163.099 was based on a confirmed breakdown below a key support level, signalling potential for further downside movement. The take profit level at 147.229 was determined based on the next significant support zone, aligning with a previous consolidation area.

Short trade Trade Type: Sell-side Trade — ETH/USDT
Date: Friday, May 30, 2025
Time: 4:30 PM — London Session PM
Observed Timeframe: 15min
Entry Day TF
Entry: 2,616.40
Take Profit (TP): 2,508.56 (−4.12%)
Stop Loss (SL): 2,631.81 (+0.59%)
Risk-Reward Ratio (RR): 7.0
📓 Context / Trade Notes:
Market Structure: The trade was initiated following a bearish structure, with price action forming lower highs and lower lows, indicating a downtrend.
Technical Indicators: The RSI on the 15-minute chart displayed a bearish crossover of moving averages, reinforcing the short position.
The take profit level at 2,508.56 was determined based on the next significant support zone, aligning with a previous consolidation area.

AUDCAD SHORTMarket structure bearish on HTFs DW
Entry at Both Daily and Weekly AOi
Weekly Rejection at AOi
Previous Structure point Weekly
Daily Rejection at AOi
Previous Structure point Daily
Around Psychological Level 0.89500
H4 EMA retest
H4 Candlestick rejection
Levels 5.54
Entry 100%
REMEMBER : Trading is a Game Of Probability
: Manage Your Risk
: Be Patient
: Every Moment Is Unique
: Rinse, Wash, Repeat!
: Christ is King.

USDJPY SHORTMarket structure bearish on HTFs 3
Entry at both Weekly and Daily AOi
Weekly entry at AOi
Daily entry At AOi
Previous Structure point Daily
Around Psychological Level 144.000
H4 EMA retest
H4 Candlestick rejection
Rejection from Previous structure
Levels 4.72
Entry 110%
REMEMBER : Trading is a Game Of Probability
: Manage Your Risk
: Be Patient
: Every Moment Is Unique
: Rinse, Wash, Repeat!
: Christ is King.

NZDCAD SHORT Market structure structure bearish on HTFs DH
Entry at Both Weekly and Daily AOi
Weekly Rejection at AOi
Daily Rejection At AOi
Previous Structure point Daily
Around Psychological Level 0.82500
H4 EMA retest
H4 Candlestick rejection
Rejection from Previous structure
Levels 3.72
Entry 100%
REMEMBER : Trading is a Game Of Probability
: Manage Your Risk
: Be Patient
: Every Moment Is Unique
: Rinse, Wash, Repeat!
: Christ is King.

My Thoughts #012The pair is in a bearish trend on the weekly time
In the bearish trend the pair seems to be making a LH
Meaning we are currently moving up and currently on the lower time frame we are in bullish trend.
The pair still has equal highs open on the weekly time frame.
It further sweeped equal lows on the daily time to fuel for the next move up.
The pair broke out, retested and after that it's been trying to gain more momentum for the upside.
Sells could still happen just use proper risk management
let's do the most

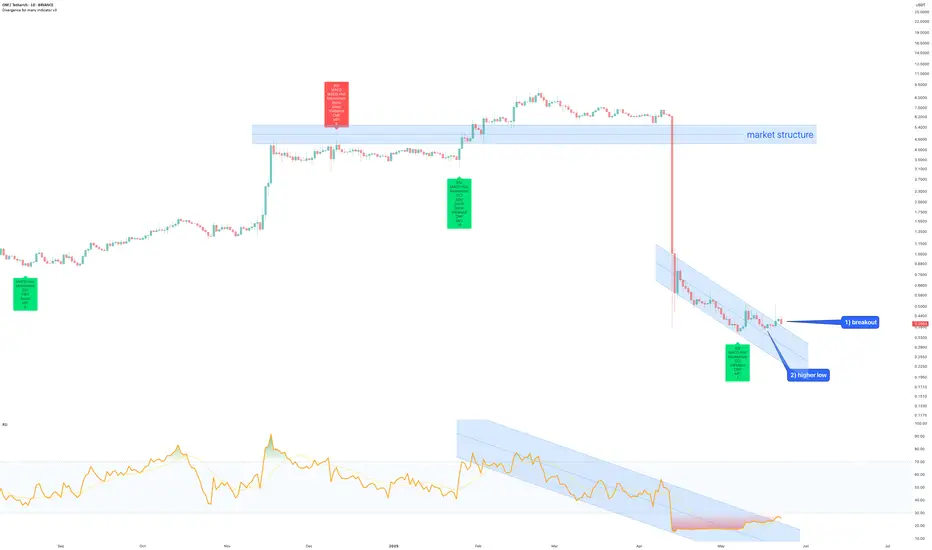
Mantra token (OM) to $4 on return to market structure40 days ago on April 13th price action corrected 95% (if this is not enough convince you the Crypto tokens are a Ponzi scheme I don’t know what is), a number of reasons now exist for traders to open a long position into the remaining sell orders of the once project faithful. The reasons?
1. Price action and RSI resistance breakouts.
2. Trend reversal, price action prints a higher low.
3. A rally followed on the same bullish divergence configuration that printed throughout the history of this token. That positive divergence has printed once more.
4. The forecast is formed on the idea price action returns to market structure before continuing the downtrend. Was about to say nothing goes down in a straight line ;-)
Is it possible price action continue to correct? Sure.
Is it probable? No.
Ww
NASDAQ Markup- Not in the Trade, But the Lesson's ClearDidn’t take this one—not trading NASDAQ right now—but I still mapped it out from the 30M perspective just to stay sharp.
4H gave bullish intent after breaking the major macro LH, so I followed the flow.
Saw a clean 30M inducement sweep, price then mitigated internal structure OB, and I marked exactly where I would’ve entered with LTF confirmation.
Didn’t trade it, but the logic’s there—and if you’ve been watching… you already know what it’s doing now. 🧠📈
Every setup teaches something.
– Inducement King
Bless Trading!

XAUUSD| Bullish Flow Still In PlayGold’s been moving with bullish intent since last week on the 4H—clean, controlled, and no signs of slowing yet.
Now I’m focused on 30M continuation structure, just waiting for the LTF to line up for my next move.
No need to force it—just staying patient and letting price unfold.
Setups come to the disciplined. 🎯
– Inducement King
Bless Trading!
