GBPAUD: Short From Resistance 🇬🇧🇦🇺
GBPAUD may retrace from a key daily horizontal resistance.
As a confirmation, I see a double top pattern formation
on that on a 4H time frame and a breakout of its neckline.
I expect a bearish move to 1.0858
❤️Please, support my work with like, thank you!❤️
I am part of Trade Nation's Influencer program and receive a monthly fee for using their TradingView charts in my analysis.
Multiple Time Frame Analysis

GOLD POSSIBLE DROPGood day traders, it's been a while since I shared my analysis but here's my take on GOLD
There's a high chance Gold will drop as we can see bears are already in control of the trend (Downtrend confirmed), I won't go into much details but this is the possible move that might occur, be ready for anything

XAUUSD Bearish Signal | Technical + Custom AlgoSmart Trend Signal | Technical Analysis + Custom Algorithm
This signal is the result of a combination of classic technical trend analysis and a proprietary software I personally developed.

Skeptic | Gold (XAU/USD): Breakout Triggers Set to Pop?Hey everyone, Skeptic here! Let’s fire up this Thursday morning with a fresh Gold (XAU/USD) analysis! 😊 We’re diving into the Daily Timeframe to spot the trend, then zooming into the 4-Hour Timeframe for juicy long and short triggers. Stay with me—let’s get to it! 📊
Daily Timeframe: The Big Picture
Gold’s been on a tear, climbing to a high of 3416.19 (it went higher, but I’m using the candle close for faster triggers when we hit those levels :)). Now, we’re in a correction phase, forming a downward channel . This correction has been solid, dropping to the 0.5% Fibonacci retracement. What’s cool about this channel is how cleanly it’s reacting to the ceiling, floor, and midline, making it super valid for us. A break of either the ceiling or floor could give us some killer triggers. But since we’re in a correction, it’s smart to dial back risk on all positions. Lowering risk can mean taking profits quicker, shrinking position sizes, tighter stop losses, or a mix of these to keep your account safe.
4-Hour Timeframe: Long & Short Setups
Now, let’s get to the 4-hour chart for our long and short triggers.
📈 For longs, we’ve got two setups. The first is a bit risky since we haven’t confirmed the downward channel breakout yet—it’s a preemptive move. You can go long after breaking the resistance at 3366.71 . Our main long trigger, though, is a break above 3416.19 , which also cracks the channel’s ceiling and sets us up for new all-time highs. If you catch this one, don’t rush to take profits too fast—let it run!
📉 For shorts, a break below support at 3249.68 opens the door, with RSI hitting oversold as a solid confirmation. But since this goes against the major uptrend, it’s risky—take profits early and keep position sizes small to stay safe. :)
💬 Let’s Talk!
If this analysis sparked some ideas, give it a quick boost—it means a lot! 😊 Got a pair or setup you want me to dive into next? Drop it in the comments, and I’ll tackle it. Thanks for joining me—see you in the next one. Keep trading smart! ✌️

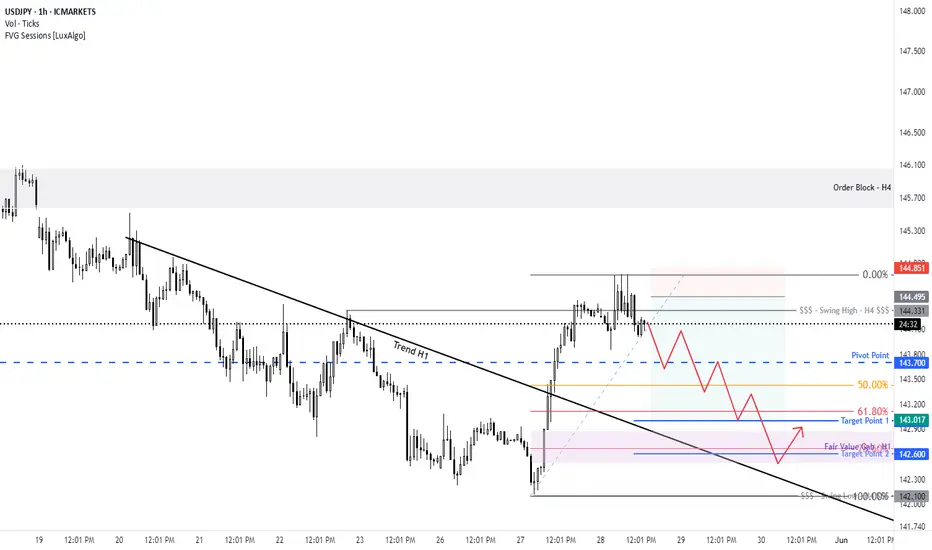
Skeptic | USD/JPY Analysis: Bearish Momentum Fuels Short Setups!Hey everyone, Skeptic here! I know some of you might’ve missed our last USD/CHF short signal that hit a sweet 3:1 R/R—no worries! 😊 The market’s always here, so missing a trade isn’t the end of the world. I’m not here to push FOMO; my goal is to take you on a long-term trading journey, and I’m stoked to have you along for the ride! :))) Let’s get back to USD/JPY and break down the latest action. 📊
Daily Timeframe: The Big Picture
First, let’s zoom out and talk about the DXY (US Dollar Index), which recently broke the 99.005 support and turned bearish. This puts USD-based pairs like USD/JPY in the spotlight for short opportunities this week. Here’s what’s happening with USD/JPY:
Trend Context: The major trend is bearish. Last week, sellers showed no mercy to buyers, and with DXY’s bearish move, we’re likely to see more of the same this week.
Key Level: We’re currently reacting to a major daily support at 142.305. Expect a range or reaction here, so we must wait for confirmation before shorting.
Recent Correction: The prior correction reached the 0.50% Fibonacci retracement and seems to have resumed the major bearish trend.
With this in mind, let’s zoom into the 4-Hour Timeframe to hunt for long and short setups.
4-Hour Timeframe: Long & Short Setups
The 4-hour chart is giving us some clear signals to work with. Here’s the plan:
Short Setup:
Key Level: The 142.338 level is critical, as it formed a ceiling at 148.569 in the past and acted as support before.
Trigger: If we form a lower high and then break below 142.305, open a short position.
Confirmation: Use RSI to back up the breakout, ensuring momentum aligns.
Why It Works: A lower high signals increasing weakness in this support, making a break more likely.
Long Setup:
My Take: I personally don’t have a long trigger right now. Both the major and minor trends are downtrends, so going long doesn’t make sense in these conditions.
If You Insist: If you’re set on a long, wait for a break above 144.125. But keep it tight—low risk, small stop loss, and take profits quickly once you hit a decent R/R.
💬 Let’s Talk!
If this analysis sparked some ideas, give it a quick boost—it really helps! 😊 Got a pair or setup you want me to dive into next? Drop it in the comments, and I’ll tackle it. Thanks for joining me—see you in the next one. Keep trading smart! ✌️

Nasdaq analysis: 29-May-2025Good morning, everyone! Today's Nasdaq analysis is designed to educate and empower. Use these insights to refine your price action trading strategy.

Skeptic | SPX 500 Update: Bullish Breakout Brewing?Hey everyone, Skeptic here! It’s been a while since we’ve checked in on the SPX 500 , but the market’s now flashing a killer long opportunity with a high R/R—don’t miss this one! 😊 Stay with me to the end for the full breakdown. Let’s dive into the Daily Timeframe to set the stage. 📊
Daily Timeframe: The Big Picture
The SPX 500 pulled off a deep correction , dropping from a high of 6154.64 to lows around 4810.39 with some wild shadows that caught everyone off guard. But now, it’s firing up with fresh momentum, carving out higher highs and higher lows that scream bullish strength. The corrections in this new uptrend are super shallow and flow with the trend—exactly what we want to see! After hitting resistance at 5961.82 , we’ve had a slight pullback, but it looks like this correction is wrapping up, and we’re on the verge of the next big uptrend leg. Let’s zoom into the 4-Hour Timeframe to hunt for long and short triggers.
4-Hour Timeframe: Long & Short Setups
On the 4-hour chart, the correction shaped up as a descending trendline . We broke it, pulled back, and now we’re primed to crack 5895.39. A breakout above this level is our main long trigger. To get more precise, let’s check the 1-Hour Timeframe.
For the long setup , a clean break above 5896.34 gets us in the game. This move also busts through P.P. Level 1, giving us solid confirmation, and we could ride the wave up to P.P. Levels 3 or 4, targeting 5930.83 to 5956.97 . Those are prime spots to lock in some profits, but don’t close the whole position—since we’re trading with the trend, we can hold for more upside. For shorts, I’ve got nothing. Going against this bullish momentum would be pure madness! I’d wait for a sharp drop below support at 5849.67 before even considering short triggers, but right now, there’s zilch.
💬 Let’s Talk!
If this update sparked some ideas, give it a quick boost—it means a lot! 😊 Got a pair or setup you want me to tackle next? Drop it in the comments. Thanks for hanging out— let’s grow together and remember: Weathermen forecast. We trade! :))) ✌️

Gold trading zones: 29-May-2025Good morning! Find today's Gold trading zones and enhance your market analysis.

With Bullish bias into new Week - 2025/05/26Last week, I published my idea for a whole week with daily updates for the first time. You can read about it here:
🎯 The target of $3348 was reached on Friday due to the announcement of new tariffs against the European Union.
💡 Here is my idea for the week from May 26-30, 2025.
First things first, the Friday session last week ended with bullish momentum. Even though the gold price consolidated more at the $3366 mark, it was obviously to allow time to pass and calm down stressed values like EMA or MACD. This is a very good sign for the start of the week because if the Asia timezone takes the invite, the gold price has a good chance to rise. My expectation is a bullish GAP right at the beginning; if so, it's a clear sign for the rest of the day, in my opinion. These thoughts would support my goal from above $3500 during the week.
📰 Geopolitical News Landscape
India / Pakistan
The ceasefire from May 10 remains tense but intact. Both sides claim victory, while Pakistan strengthens ties with China. Cross-border attacks have ceased, but mutual distrust persists.
➡️ Situation remains fragile; renewed escalation is possible.
Gaza Conflict
Israel intensifies "Gideon’s Chariot" with ground forces in Khan Younis. Mass evacuations and high civilian casualties worsen the humanitarian crisis. Peace talks have stalled as the offensive continues.
➡️ No relief in sight; humanitarian conditions are deteriorating further.
Russia / Ukraine
On May 24, Russia launched its largest air assault yet with 367 missiles and drones—13 civilians were killed. Just before, both sides exchanged 1,000 prisoners. Peace talks remain suspended.
➡️ Violence is escalating; a ceasefire remains out of reach.
U.S.–China Trade War
The 90-day tariff pause triggered a rush to import from China. Shipping bottlenecks and high freight rates are straining businesses. Structural issues remain unresolved.
➡️ Short-term easing; long-term tensions persist.
Trade War on global view
The global trade war has escalated in May 2025, with the U.S. imposing a 50% tariff on EU imports and a 25% levy on foreign-made smartphones, citing trade imbalances. The EU has condemned these moves, warning of potential retaliation. In response to U.S. tariffs, China has restricted rare earth exports, impacting global supply chains. ASEAN nations, heavily affected by U.S. tariffs ranging from 10% to 49%, are urging deeper regional integration to mitigate economic disruptions. The IMF has downgraded global growth forecasts to 2.8% for 2025, citing trade tensions and policy uncertainty. Supply chains are being restructured, with companies shifting production to countries like Vietnam and Mexico. Financial markets are volatile, with increased inflationary pressures and investor anxiety.
➡️ Emerging markets face currency volatility and economic instability due to the ongoing trade conflicts.
⚖️Trump vs. Powell
President Trump increases pressure on Fed Chair Powell to cut rates. The Fed holds interest rates at 4.25–4.5% and warns of inflation. A 10% staff reduction is planned to boost efficiency.
➡️Political interference is increasingly destabilizing markets.
U.S. Inflation – April 2025
Inflation dropped to 2.3%, the lowest since February 2021. However, consumer inflation expectations remain high at 7.3%. The University of Michigan Consumer Sentiment Index fell to 50.8—a historic low.
➡️A clear gap is emerging between official data and public perception.
🔋 Technical Analysis – Short-Term
📊 Analysis: May 19–24, 2025
Weekly Low: $3,204 (May 20)
Weekly High: $3,366 (May 23)
Weekly Close (May 23): approx. $3,358
Total Gain: +5%
🟢 Trend: A clear uptrend is evident. After hitting a low of $3,204 on May 20, gold experienced a strong rally, forming consistently higher highs and higher lows. A brief pullback on May 22 was quickly bought up.
📈 Structure: A series of bullish flag patterns developed, each resolving to the upside. The high at $3,366 currently marks the most significant resistance level.
🔮 Outlook from May 26, 2025
Resistance: $3,366 (recent high)
Support: $3,310 (last local low), below that $3,280 (breakout zone)
Bias: Bullish as long as price holds above $3,310
📌 Scenario 1 – Bullish Breakout: A sustained breakout above $3,366 could unlock further upside potential toward the $3,390–$3,410 area. When Asia session starting with bull GAP the Scenario is the one i preffer.
📌 Scenario 2 – Pullback: A retracement to the $3,310–$3,280 zone would be a healthy correction within the trend, provided this zone holds.
🧭 Conclusion:
Gold remains in a steady uptrend. As long as support levels hold, a continuation toward $3,500 is likely. RSI may be overbought on higher timeframes, so short-term consolidations are possible, but structurally the setup remains bullish.
Anything to ad? Feel free to tell your thoughts.
-------------------------------------------------------------------------
This is just my personal market idea and not financial advice! 📢 Trading gold and other financial instruments carries risks – only invest what you can afford to lose. Always do your own analysis, use solid risk management, and trade responsibly.
Good luck and safe trading! 🚀📊

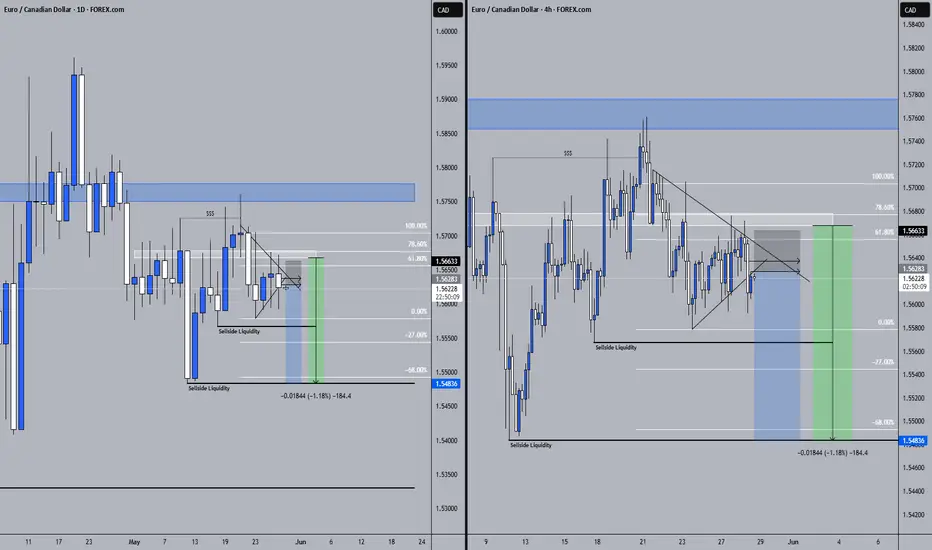
EURCAD 28/05/2025Weekly:
-Weekly highs.
-Liquidity sweep
Daily:
-H&S pattern.
4H:
-Bearish W pattern.
-FVG.
SHORT ON SPY (SPX/USD)Spy has given us bearish divergence at a major supply zone.
I will be selling spy to the next support level.
Today is FOMC and I expecting it to influence spy move to the downside.

EUSDUSD Bearish Signal | Technical + Custom AlgoSmart Trend Signal | Technical Analysis + Custom Algorithm
This signal is the result of a combination of classic technical trend analysis and a proprietary software I personally developed.

USDJPY Bullish Signal | Technical + Custom AlgoSmart Trend Signal | Technical Analysis + Custom Algorithm
This signal is the result of a combination of classic technical trend analysis and a proprietary software I personally developed.

AUDUSD Bearish Signal | Technical + Custom AlgoSmart Trend Signal | Technical Analysis + Custom Algorithm
This signal is the result of a combination of classic technical trend analysis and a proprietary software I personally developed.


CAD/JPY For Bearish as pull-backyou can go short now
general trend is up trend
current phase is pull-back
have fun :)

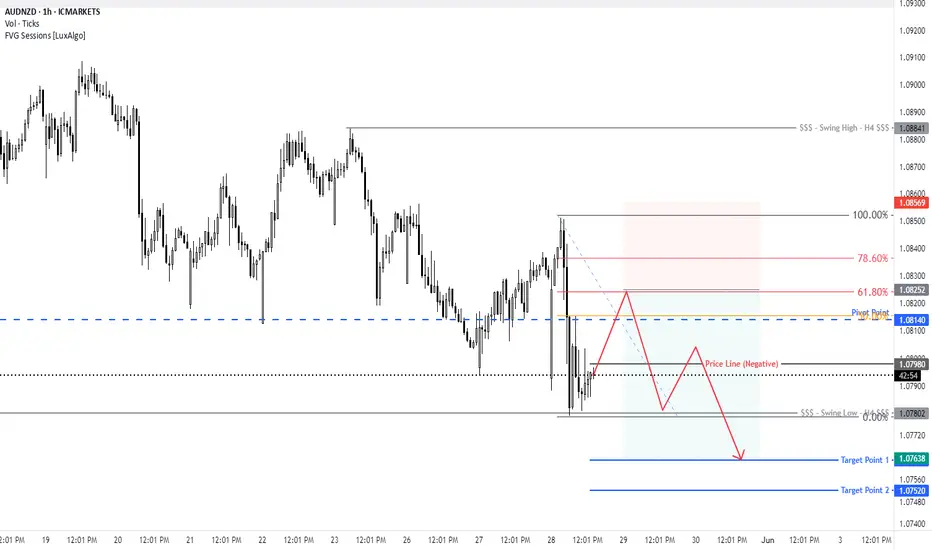
AUD/NZD For Bearishwait for pull-back near by entry point and then go short
general trend is down trend
have fun :)
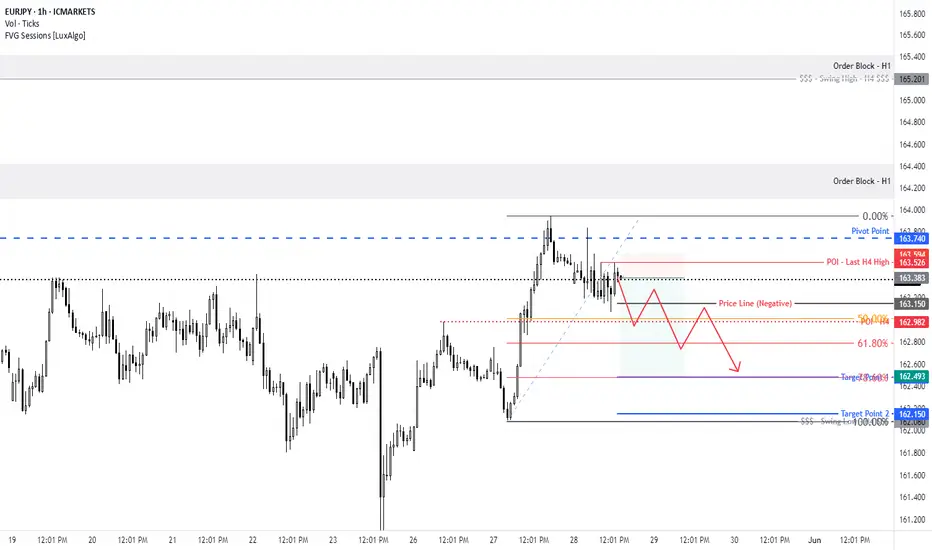
EUR/JPY For Bearish as pull-backyou can go short now
general trend is up trend
current phase is pull-back
have fun :)

GBP/CAD For Bullishwait for break the current resistance and go bullish with retest that area
general trend is up trend
have fun :)

NZD/USD For Bullishyou can go long now
or
wait for pull-back near by entry point and then go long
general trend is up trend
have fun :)

Why I Think Gold May Buy This Week...Technical AnalysisHey Rich Friends,
I think Gold will continue to buy today and potentially for the rest of the week. This is only my technical analysis, so please check the news and cross-reference the indicators on your chart. Here is what I am looking at:
- The market has been pushing up since it hit a swing low at 3285
- Bullish candles are picking up momentum with Bullish engulfing on H1. This is a bullish confirmation for me
- The STOCHASTIC is facing up, the orange line (slow) is below the blue line (fast), both have crossed above 50%.
These are all bullish confirmations for me. I will setting buy stops as marked on my chart. I will set my SL at the previous low and use previous highs as my TPs. Good luck if you decide to take this trade. Let me know how it goes in the comments below.
Peace and Profits,
Cha
