BTC multi-timeframe: bullish momentum and strong support zones__________________________________________________________________________________
Technical Overview – Summary Points
__________________________________________________________________________________
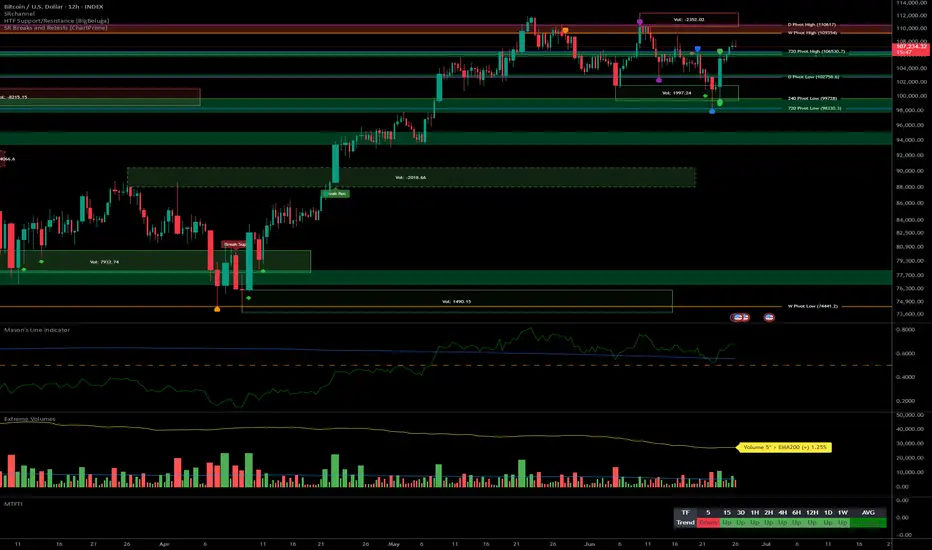
Momentum: Clear bullish bias across all timeframes (MTFTI Up everywhere except 5min). Weak selling pressure, no distribution or capitulation signals.
Support/Resistance: Key resistances: 110647–109554 (HTF). Major supports: 102756 (D Pivot Low), 98330 (720 Pivot Low). Multiple buy zones on retracement.
Volume: Recent volumes below "extreme" threshold, no euphoria/capitulation detected.
Multi-TF Behavior: Global bullish alignment, volatility present intraday, but no confirmed reversal risk. Risk On / Risk Off Indicator shows no major anomaly.
__________________________________________________________________________________
Strategic Summary
__________________________________________________________________________________
Strategic Bias: Structurally bullish market. Prioritize tactical buys on pullback, active risk management.
Opportunities: Reinforce long positions on $106k/$103k/$100k retrace. Partial targets below 110–111k.
Risk Zones: Rejection under 106500–107000 with extreme volume spike = short-term top signal. Invalidation if H1 < 106k or H4 < 102.7k.
Macro Catalysts: US calendar (GDP, durable goods, jobless claims), geopolitics (Russia/Ukraine). No systemic alert, but caution required.
Action Plan: Filter entries on technical supports, exit on extreme sell volume or macro shock.
__________________________________________________________________________________
Multi-Timeframe Analysis
__________________________________________________________________________________
1D: Compression below historical resistances (109–111k), solid momentum, potential buy zone 102750–98330.
12H: Multiple resistances, uptrend, support confluence 102756–106530 pivot key.
6H: Price under resistance cluster (106530), possible profit-taking on rejection, strong support 102756.
4H: High-range structure, reinforced supports, next breakout could trigger acceleration with volume.
2H: Pivot zone 106500–107200, caution below close, buy zone on correction.
1H: Support stacking structure, no clear breakdown, critical node, aggressive buy 106100–105800.
30min: Compression at range high, caution on buying resistance, key spots 106000/104500.
15min: Possible buyer exhaustion under 108k, tactical buy on support 106000–106500 if confirmed.
Summary: Strong bullish alignment, same key supports, no panic. Risk On / Risk Off Indicator neutral, controlled market, possible whipsaw on short-term TFs but no major reversal sign.
__________________________________________________________________________________
Macro, News & On-Chain Analysis
__________________________________________________________________________________
Macro: Fed and traditional markets calm, no monetary alert. Israel/Iran ceasefire, increased volatility in Europe (Russia/Ukraine). Moderate risk-on sentiment.
Calendar: June 26: US durable goods/GDP/jobless claims (potential volatility).
On-chain: BTC range $100–110k, fundamental support $93–100k, no panic/capitulation. Low spot volumes, bullish digestion phase.
__________________________________________________________________________________
Conclusion
__________________________________________________________________________________
Dominant bias: Up/moderately bullish in short term, focus on retracement buying.
Risk management: Stop H4 < $102.7k, H1 < $106k, scalping: break of 106k with extreme volumes.
Action zones: Reinforce on $106k/$103k/$100k retrace, partial TP below 110–111k, extension if confirmed breakout.
Monitor: Volume, support reactions, macro catalysts.
Summary:
Technical and on-chain context remains bullish; best approach is tactical buying on pullback with dynamic stops. Stay agile in case of extreme selling volume or macro shocks. Act on signals, protect capital.
__________________________________________________________________________________
Multi
BTC 15M APEX ENTRY Confirmed by 1H TrendThis 15-minute Apex Entry aligned with the 1H trend, avoiding fakeouts and confirming direction.
The Tenoris Apex Suite uses real-time support/resistance detection and multi-timeframe logic to identify breakout entries with zero lag.
I use this method to focus only on trades that align across key timeframes.
Not financial advice – just sharing how I trade.
For access, see profile bio.

How To Customize The 1 Minute Scalping IndicatorThis tutorial explains each setting of the 1 Minute Scalping Indicator in detail so you understand exactly how to adjust your settings to get the results you would like from the indicator.
Here is a list of the details we discuss:
How to fix loading errors
Tooltips that explain each setting for your reference
Trade modes and how they are affected by other settings
Average candle size rejection parameters
Higher timeframe candle filters, settings and levels
External indicator trend filtering capabilities and how to set them up correctly
Stoploss and take profit calculations and settings you can adjust
Signal arrow customization options
Candle coloring adjustments
Visual/styling options
Make sure to watch the whole video so you fully understand how each setting affects the indicator for best results.

YM / Dow Jones - long term perspectiveOn the CBOT_MINI:YM1! weekly/monthly/quarterly chart, nothing is looking out of the ordinary as of right now.
No matter what timeframe you're looking at, all timeframes have to go through cycles of rise and fall, and this current panic is just a normal red candle on the quarterly/monthly charts.
After this monthly/quarterly pullback, I'm still expecting a push higher to reach at least 48k before any longer term weakness should set in, if at all.
I see $34k-$38k as a mid-term discount zone, with 42-48k as a mid-term premium zone, with 48k as a magnet of sorts for price to draw toward.
I have 2 scenarios I'm currently watching for:
MID-TERM PULLBACK: Bull market stays intact, Trump ISN'T actually Hitler :-), price sweeps under $38k and sets up bounce back toward 48k from there.
LONG-TERM PULLBACK: World falls apart, Trump IS actually Hitler :-), bear market commences, multiple quarterly red candles, price does a deep pullback to $27.5k before rebounding from there.
SCENARIO 1 (seems most likely):
SCENARIO 2 (seems very unlikely):
Mostly, I would just counsel people to have a plan. "If bull market stays intact, do XYZ. If bear market develops, do ABC."

GBP/USD: Selling into the reboundThe setup is similar in EUR/USD & GBP/USD - because of the dollar in both major pairs!
The GBP price is testing the broken uptrend line on the weekly- and could break above it.
On the daily chart, a downtrend line has already broken and so has critical resistance at 1.25, suggesting a break above the weekly uptrend line
Should the breakout follow-through it faces resistance at 1.28 from the December high and 30 week (150 day) moving average.
However, should the breakout fail - it sets up a likely continuation of the longer term downtrend.

[Strategy] Trend Re-Entry Strategy using a Stoch and Zero Lag MATrend re-entries can be hard. The difficult part is knowing if price will continue to pull back or will it shift back into the original direction.
This is a strategy with some extra notes to help you understand
1. The Original entry
2. The Re-Entry
3. Is my trend ending
For this you'll need two indicators:
The Zero Lag Multi Timeframe Moving Average
and The Stocashi + Caffeine Crush
In the video I show you how to adjust the settings for a 5 minute chart on both indicators.
Long Entry rules:
You have 3 MAs. The longest one is your support and resistance
The other two are your "trading" and "trending" MAs
If price is above your support and resistance, your trading and trending should be right side up.
If price close in between trading and trending, the stocashi should be at a low point.
It needs to arrive at this low point by previous crossing down through its midline.
**If it did not cross down through its midline, there is no entry here**
Once price closes above the trading MA, you should have a rising stocashi from its valid low point.
During this uptrend, each time price pulls back in between the trading and trending MAs, the Stocashi should be at a valid low point.
Re-enter your long trade as long as:
Stocashi made a valid low
Price is closing above the trading MA
Trading MA is above Trending MA
Trending MA is above Support and Resistance MA.
You can reverse all of these instructions for taking short trades.
Potential Market Flip
If you are getting consistent invalid lows on Stocashi while price is in a correct position, this means you are losing your trend, and you should wait for your price to close below the Support and Resistance MA.
At this point your Trading and Trending MAs should be upside down. They do not always have to be BELOW the Support and Resistance MA.

Rolling Correlations and Applications for Traders and Investors1. Introduction
Markets are dynamic, and the relationships between assets are constantly shifting. Static correlation values, calculated over fixed periods, may fail to capture these changes, leading traders to miss critical insights. Rolling correlations, on the other hand, provide a continuous view of how correlations evolve over time, making them a powerful tool for dynamic market analysis.
This article explores the concept of rolling correlations, illustrates key trends with examples like ZN (10-Year Treasuries), GC (Gold Futures), and 6J (Japanese Yen Futures), and discusses their practical applications for portfolio diversification, risk management, and timing market entries and exits.
2. Understanding Rolling Correlations
o What Are Rolling Correlations?
Rolling correlations measure the relationship between two assets over a moving window of time. By recalculating correlations at each step, traders can observe how asset relationships strengthen, weaken, or even reverse.
For example, the rolling correlation between ZN and GC reveals periods of alignment (strong correlation) during economic uncertainty and divergence when driven by differing macro forces.
o Why Rolling Correlations Matter:
Capture dynamic changes in market relationships.
Detect regime shifts, such as transitions from risk-on to risk-off sentiment.
Provide context for recent price movements and their alignment with historical trends.
o Impact of Window Length: The length of the rolling window (e.g., 63 days for daily, 26 weeks for weekly) impacts the sensitivity of correlations:
Shorter Windows: Capture rapid changes but may introduce noise.
Longer Windows: Smooth out fluctuations, focusing on sustained trends.
3. Case Study: ZN (Treasuries) vs GC (Gold Futures)
Examining the rolling correlation between ZN and GC reveals valuable insights into their behavior as safe-haven assets:
o Daily Rolling Correlation:
High variability reflects the influence of short-term market drivers like inflation data or central bank announcements.
Peaks in correlation align with periods of heightened risk aversion, such as in early 2020 during the onset of the COVID-19 pandemic.
o Weekly Rolling Correlation:
Provides a clearer view of their shared response to macroeconomic conditions.
For example, the correlation strengthens during sustained inflationary periods when both assets are sought as hedges.
o Monthly Rolling Correlation:
Reflects structural trends, such as prolonged periods of monetary easing or tightening.
Divergences, such as during mid-2023, may indicate unique demand drivers for each asset.
These observations highlight how rolling correlations help traders understand the evolving relationship between key assets and their implications for broader market trends.
4. Applications of Rolling Correlations
Rolling correlations are more than just an analytical tool; they offer practical applications for traders and investors:
1. Portfolio Diversification:
By monitoring rolling correlations, traders can identify periods when traditionally uncorrelated assets start aligning, reducing diversification benefits.
2. Risk Management:
Rolling correlations help traders detect concentration risks. For example, if ZN and 6J correlations remain persistently high, it could indicate overexposure to safe-haven assets.
Conversely, weakening correlations may signal increasing portfolio diversification.
3. Timing Market Entry/Exit:
Strengthening correlations can confirm macroeconomic trends, helping traders align their strategies with market sentiment.
5. Practical Insights for Traders
Incorporating rolling correlation analysis into trading workflows can enhance decision-making:
Shorter rolling windows (e.g., daily) are suitable for short-term traders, while longer windows (e.g., monthly) cater to long-term investors.
Adjust portfolio weights dynamically based on correlation trends.
Hedge risks by identifying assets with diverging rolling correlations (e.g., if ZN-GC correlations weaken, consider adding other uncorrelated assets).
6. Practical Example: Applying Rolling Correlations to Trading Decisions
To illustrate the real-world application of rolling correlations, let’s analyze a hypothetical scenario involving ZN (Treasuries) and GC (Gold), and 6J (Yen Futures):
1. Portfolio Diversification:
A trader holding ZN notices a decline in its rolling correlation with GC, indicating that the two assets are diverging in response to unique drivers. Adding GC to the portfolio during this period enhances diversification by reducing risk concentration.
2. Risk Management:
During periods of heightened geopolitical uncertainty (e.g., late 2022), rolling correlations between ZN and 6J rise sharply, indicating a shared safe-haven demand. Recognizing this, the trader reduces exposure to both assets to mitigate over-reliance on risk-off sentiment.
3. Market Entry/Exit Timing:
Periods where the rolling correlation between ZN (Treasuries) and GC (Gold Futures) transitions from negative to positive signal that the two assets are potentially regaining their historical correlation after a phase of divergence. During these moments, traders can utilize a simple moving average (SMA) crossover on each asset to confirm synchronized directional movement. For instance, as shown in the main chart, the crossover highlights key points where both ZN and GC aligned directionally, allowing traders to confidently initiate positions based on this corroborative setup. This approach leverages both correlation dynamics and technical validation to align trades with prevailing market trends.
These examples highlight how rolling correlations provide actionable insights that improve portfolio strategy, risk management, and trade timing.
7. Conclusion
Rolling correlations offer a dynamic lens through which traders and investors can observe evolving market relationships. Unlike static correlations, rolling correlations adapt to shifting macroeconomic forces, revealing trends that might otherwise go unnoticed.
By incorporating rolling correlations into their analysis, market participants can:
Identify diversification opportunities and mitigate concentration risks.
Detect early signs of market regime shifts.
Align their portfolios with dominant trends to enhance performance.
In a world of constant market changes, rolling correlations can be a powerful tool for navigating complexity and making smarter trading decisions.
When charting futures, the data provided could be delayed. Traders working with the ticker symbols discussed in this idea may prefer to use CME Group real-time data plan on TradingView: www.tradingview.com - This consideration is particularly important for shorter-term traders, whereas it may be less critical for those focused on longer-term trading strategies.
General Disclaimer:
The trade ideas presented herein are solely for illustrative purposes forming a part of a case study intended to demonstrate key principles in risk management within the context of the specific market scenarios discussed. These ideas are not to be interpreted as investment recommendations or financial advice. They do not endorse or promote any specific trading strategies, financial products, or services. The information provided is based on data believed to be reliable; however, its accuracy or completeness cannot be guaranteed. Trading in financial markets involves risks, including the potential loss of principal. Each individual should conduct their own research and consult with professional financial advisors before making any investment decisions. The author or publisher of this content bears no responsibility for any actions taken based on the information provided or for any resultant financial or other losses.

Silver AnalysisThe chart is in a bearish phase on the daily timeframe. Given the price movement, support around the 29.140 level is not unexpected. With proper risk management, a buy position can be considered in this area.
This analysis is based on price action, multi-timeframe analysis, and ICT (Inner Circle Trader) methodology.
This analysis is brought to you by the FXonbit Traders Team

Timeframes and Correlations in Multi-Asset Markets1. Introduction
Understanding correlations across timeframes is essential for traders and investors managing diverse portfolios. Correlations measure how closely the price movements of two assets align, revealing valuable insights into market relationships. However, these relationships often vary based on the timeframe analyzed, with daily, weekly, and monthly perspectives capturing unique dynamics.
This article delves into how correlations evolve across timeframes, explores their underlying drivers, and examines real-world examples involving multi-asset instruments such as equities, bonds, commodities, and cryptocurrencies. By focusing on these key timeframes, traders can identify meaningful trends, manage risks, and make better-informed decisions.
2. Timeframe Aggregation Effect
Correlations vary significantly depending on the aggregation level of data:
Daily Timeframe: Reflects short-term price movements dominated by noise and intraday volatility. Daily correlations often show weaker relationships as asset prices react to idiosyncratic or local factors.
Weekly Timeframe: Aggregates daily movements, smoothing out noise and capturing medium-term relationships. Correlations tend to increase as patterns emerge over several days.
Monthly Timeframe: Represents long-term trends influenced by macroeconomic factors, smoothing out daily and weekly fluctuations. At this level, correlations reflect systemic relationships driven by broader forces like interest rates, inflation, or global risk sentiment.
Example: The correlation between ES (S&P 500 Futures) and BTC (Bitcoin Futures) may appear weak on a daily timeframe due to high BTC volatility. However, their monthly correlation might strengthen, aligning during broader risk-on periods fueled by Federal Reserve easing cycles.
3. Smoothing of Volatility Across Timeframes
Shorter timeframes tend to exhibit lower correlations due to the dominance of short-term volatility and market noise. These random fluctuations often obscure deeper, more structural relationships. As the timeframe extends, volatility smooths out, revealing clearer correlations between assets.
Example:
ZN (10-Year Treasuries) and GC (Gold Futures) exhibit a weaker correlation on a daily basis because they react differently to intraday events. However, over monthly timeframes, their correlation strengthens due to shared drivers like inflation expectations and central bank policies.
By aggregating data over weeks or months, traders can focus on meaningful relationships rather than being misled by short-term market randomness.
4. Market Dynamics at Different Frequencies
Market drivers vary depending on the asset type and the timeframe analyzed. While short-term correlations often reflect immediate market reactions, longer-term correlations align with broader economic forces:
Equities (ES - S&P 500 Futures): Correlations with other assets are driven by growth expectations, earnings reports, and investor sentiment. These factors fluctuate daily but align more strongly with macroeconomic trends over longer timeframes.
Cryptocurrencies (BTC - Bitcoin Futures): Highly speculative and volatile in the short term, BTC exhibits weak daily correlations with traditional assets. However, its monthly correlations can strengthen with risk-on/risk-off sentiment, particularly in liquidity-driven environments.
Safe-Havens (ZN - Treasuries and GC - Gold Futures): On daily timeframes, these assets may respond differently to specific events. Over weeks or months, correlations align more closely due to shared reactions to systemic risk factors like interest rates or geopolitical tensions.
Example: During periods of market stress, ZN and GC may show stronger weekly or monthly correlations as investors seek safe-haven assets. Conversely, daily correlations might be weak as each asset responds to its unique set of triggers.
5. Case Studies
To illustrate the impact of timeframes on correlations, let’s analyze a few key asset relationships:
o BTC (Bitcoin Futures) and ES (S&P 500 Futures):
Daily: The correlation is typically weak (around 0.28) due to BTC’s high volatility and idiosyncratic behavior.
Weekly/Monthly: During periods of broad market optimism, BTC and ES may align more closely (0.41), reflecting shared exposure to investor risk appetite.
o ZN (10-Year Treasuries) and GC (Gold Futures):
Daily: These assets often show weak or moderate correlation (around 0.39), depending on intraday drivers.
Weekly/Monthly: An improved correlation (0.41) emerges due to their mutual role as hedges against inflation and monetary uncertainty.
o 6J (Japanese Yen Futures) and ZN (10-Year Treasuries):
Daily: Correlation moderate (around 0.53).
Weekly/Monthly: Correlation strengthens (0.74) as both assets reflect broader safe-haven sentiment, particularly during periods of global economic uncertainty.
These case studies demonstrate how timeframe selection impacts the interpretation of correlations and highlights the importance of analyzing relationships within the appropriate context.
6. Conclusion
Correlations are not static; they evolve based on the timeframe and underlying market drivers. Short-term correlations often reflect noise and idiosyncratic volatility, while longer-term correlations align with structural trends and macroeconomic factors. By understanding how correlations change across daily, weekly, and monthly timeframes, traders can identify meaningful relationships and build more resilient strategies.
The aggregation of timeframes also reveals diversification opportunities and risk factors that may not be apparent in shorter-term analyses. With this knowledge, market participants can better align their portfolios with prevailing market conditions, adapting their strategies to maximize performance and mitigate risk.
When charting futures, the data provided could be delayed. Traders working with the ticker symbols discussed in this idea may prefer to use CME Group real-time data plan on TradingView: www.tradingview.com - This consideration is particularly important for shorter-term traders, whereas it may be less critical for those focused on longer-term trading strategies.
General Disclaimer:
The trade ideas presented herein are solely for illustrative purposes forming a part of a case study intended to demonstrate key principles in risk management within the context of the specific market scenarios discussed. These ideas are not to be interpreted as investment recommendations or financial advice. They do not endorse or promote any specific trading strategies, financial products, or services. The information provided is based on data believed to be reliable; however, its accuracy or completeness cannot be guaranteed. Trading in financial markets involves risks, including the potential loss of principal. Each individual should conduct their own research and consult with professional financial advisors before making any investment decisions. The author or publisher of this content bears no responsibility for any actions taken based on the information provided or for any resultant financial or other losses.

How I Use Multi Timeframe Analysis to Capture LARGE Price SwingsDISCLAIMER: This is not trade advice. Trading involves real risk. Do your own due diligence.
TUTORIAL:
Today, I demonstrate the thought process and mechanical steps I take when trading my Multi-Timeframe strategy. We take a look at US Treasuries, which have offers a classic lesson in how to apply this approach.
As you will see, throughout the year, this approach took some losses prior to getting involved in the "real" move which we anticipated. No strategy is perfect, and I do not purport this to be perfect. It is a rules based and effective way to read price. This strategy is great for people who don't have a lot of time to spend at the charts. I would classify this more as an "investing" strategy when utilizing the 12M-2W-12H timeframe.
If you have questions about anything in this video, feel free to shoot me a message.
I hope you have all had a great week so far.
Good Luck & Good Trading.

Multi-Timeframe Live TradingThis strategy follows a multi-timeframe approach, using the 4-hour (H4), 1-hour (H1), and 15-minute (M15) charts.
We start with the H4 timeframe, which gives us the overall market direction. It’s important to trade in line with this timeframe whenever possible.
If there’s no change in direction on the H4, we move to the H1 to guide our next trade decision. If both the H4 and H1 show no change, we continue to follow the H4 trend.
For the Tokyo session, we're focusing on CAD/JPY, which has shifted into a short-term uptrend, despite the H4 and H1 remaining in a downtrend.
The potential trade for the London session is GBP/USD, aiming to trade the end of a bearish wave on the 15-minute chart.
Happy Trading!

Gold's Explosive Breakout: Is $2,550 the Next Stop?Updated Technical Analysis: XAUUSD (Gold Spot)
1. Market Structure and Key Patterns
Weekly Flag Pattern (Higher Time Frame)
Formation: On the 4H chart, we observe a textbook weekly flag pattern where the price consolidated in a downward-sloping channel (flag) after a strong bullish move (flagpole). This consolidation usually represents a temporary pause in the overall bullish trend, with a potential breakout to the upside signaling a continuation.
Breakout Confirmation: The price has broken out of this flag, aligning with the broader market's bullish sentiment. This is a key signal for continuation traders, suggesting that the previous consolidation phase is complete, and the market may be resuming its upward trend.
Ascending Channel (Lower Time Frame)
Channel Dynamics: On the 15M and 1H charts, the price has been moving within an ascending channel, which indicates a series of higher highs and higher lows—a sign of a bullish trend. This channel has been respected multiple times, indicating that the market participants are recognizing and trading off this structure.
Channel Breakout: The breakout above the channel’s upper boundary is critical, as it suggests that the bullish momentum is accelerating. This breakout aligns with the breakout from the weekly flag, adding confluence to the bullish outlook.
2. Key Levels and Liquidity Zones (LQZ)
Resistance Zone (Broken)
Previous Resistance: The blue rectangle on the chart marks a significant resistance level where the price previously struggled to break above. After several attempts and consolidations near this zone, the recent breakout indicates that the sellers have been overwhelmed by buyers.
Potential Retest Area: The broken resistance could now serve as a support level. A retest of this zone could provide a high-probability entry for traders looking to join the trend. This area is crucial for validating the strength of the breakout.
Liquidity Zones (LQZ)
LQZ at $2,485 and $2,477: These zones, identified on the 15M chart, are areas of high trading activity, often leading to significant price reactions when revisited. The price did not retrace deeply into these zones before the breakout, indicating strong bullish momentum.
3. Implications of the Breakout
Momentum Shift:
The breakout above the resistance zone at approximately $2,509-$2,510, followed by a rapid upward move to $2,520, indicates a shift in market sentiment. The rapidity of this move suggests a possible short squeeze or significant buying interest pushing the price higher.
Potential Targets:
Short-Term Targets: Immediate resistance can be anticipated near psychological levels like $2,525 and $2,530. These levels often act as short-term hurdles where some profit-taking might occur.
Longer-Term Targets: Given the alignment with the weekly flag breakout, the price could aim for more distant targets around $2,550 or higher, depending on how momentum sustains.
4. Risk Management and Trade Execution
Entry Strategy:
Reduced Risk Entry: Awaiting a pullback to the broken resistance zone around $2,509-$2,510 for a long entry. This approach reduces the risk by confirming that the previous resistance has turned into support.
Aggressive Entry: Traders could enter on any minor pullbacks within the ongoing momentum, with stops placed just below the breakout zone or recent swing lows. This is riskier but capitalizes on the strong momentum.
Stop Loss Placement:
Below Breakout Zone: Stops should be placed just below the $2,509 level to protect against a false breakout. Alternatively, more conservative stops could be placed below the previous swing low around $2,497-$2,500, depending on risk tolerance.
Trailing Stops: As the price moves in your favor, consider trailing the stop loss below higher lows on lower time frames (15M or 1H) to lock in profits while allowing the trade to breathe.
5. Momentum and Volume Analysis
Volume Confirmation: Look for volume spikes accompanying the breakout. Higher volume supports the legitimacy of the breakout, whereas a lack of volume could suggest a potential for a pullback.
6. Mass Psychology and Sentiment
Sentiment Dynamics:
The breakout could be driven by a shift in market sentiment, with traders and investors who were previously on the sidelines now entering the market. This FOMO (Fear of Missing Out) can fuel further buying.
Contrarian Signals: While the breakout is bullish, be wary of excessive euphoria. A sudden surge in buying could be followed by a sharp pullback as early buyers take profits. Monitoring sentiment indicators and social media trends can offer additional insights into potential sentiment extremes.
Conclusion
The current technical setup for XAUUSD is strongly bullish, with the breakout confirming the potential for further upside. However, risk management remains crucial, particularly in ensuring that stop losses are placed appropriately and that any pullback is closely monitored for signs of support. The alignment of the weekly flag breakout with the shorter-term ascending channel breakout adds significant weight to the bullish case, making this a high-probability setup for continuation trades.

AUDUSD 0.65718 -0.31% SHORT IDEA MTF ANALYSISHELLO TRADERS
Hope everyone is doing great
📌 A look at AUSSIE from HTF - MULTI TIME-FRAME ANALYSIS
AUDUSD DAILY TF
* Thursday saw strong bullish momentum coming into play, But friday closed within the range.
* The weekly & daily TF show we are still showing signs of a bullish move.
* But seems we may see a reversal before continuation with the bears.
* AUDUSD took External range LQ Mon. the 5th, looking for that internal range LQ to be taken.
* We are trading in discount of the move,This is where I would be looking for long entries.
* With PO3 looking to open bearish this week to confirm a move higher into premium PD ARRAYS.
AUDUSD 4H TF
* Looking for the week to open BULLIS into the 4h -OB because our HTF BIAS (PO3) Is bullish .
* WEEK open I will probably be looking for long positions OPPORTUNITIES.
* We will see what does the market dish.
* 4H lookin for a push into the -OB (po3) to sell intraday .
AUDUSD 1H TF
* We saw a rally with the bulls, strong momentum to the upside 1H DEFINITELTELY bullish.
* Looking at the 1H -OB, this is where I would look for LONG entries this week.
* Should this PD ARRAY hold will be Short for the AUDUSD.
* BASED on the price action served this week.
HOPE YOU ENJOYED THIS OUT LOOK, SHARE YOUR PLAN BELOW,🚀 & LETS TAKE SOME WINS THIS WEEK.
SEE YOU ON THE CHARTS.
IF THIS IDEA ASSISTS IN ANY WAY OR IF YOU ENJOYED THIS ONE
SMASH THAT 🚀 & LEAVE A COMMENT.
ALWAYS APPRECIATED
____________________________________________________________________________________________________________________
Kindly follow your entry rules on entries & stops. |* Some of The idea's may be predictive yet are not financial advice or signals. | *Trading plans can change at anytime reactive to the market. | * Many stars must align with the plan before executing the trade, kindly follow your rules & RISK MANAGEMENT.
_____________________________________________________________________________________________________________________
| * ENTRY & SL -KINDLY FOLLOW YOUR RULES | * RISK-MANAGEMENT | *PERIOD - I TAKE MY TRADES ON A INTRA DAY SESSIONS BASIS THIS IS NOT FINACIAL ADVICE TO EXCECUTE ❤
LOVELY TRADING WEEK TO YOU!

Gold’s Next Big Move: Critical Levels You Can’t Afford to Miss!Hey Traders, welcome back to my channel! 🚀
Today, we're diving deep into the latest XAUUSD analysis, and trust me, you don't want to miss this one. With gold prices poised for a significant move, understanding these key levels could make all the difference in your trading strategy.
Let's get started with the 1-hour chart (shown below). 📊
Chart 1: XAUUSD 1-Hour Time Frame Analysis (July 21, 2024)
Key Observations:
Daily Bull Flag Formation:
The chart highlights a daily bull flag pattern, which indicates a continuation pattern following a strong uptrend. On the daily TF sometimes this can take a bit longer to see due to how big this flag is on the (LTF)
The price has been consolidating within this flag formation.
Reversal Structure (Lower High - LH):
There is a reversal structure where the price made a lower high (LH), suggesting a potential bearish reversal in the short term.
Structure LTF (Lower Time Frame):
The price structure on the lower time frame indicates an area where price could pull back and reject off of this area indicating the continuation of the Overall move.
The second way this could play off of this area is we could get a clear impulsive move above this structure and then a rejection looking for higher moves in the Shorter Time Frame.
15-Minute Time Frame:
The 15-minute time frame shows a detailed view of the consolidation and break down from the flag formation. where you could see how close we are to the LQZ shown on the 1HR
1HR Liquidity Zone (LQZ):
Identified at 2,390.966, this zone may act as a significant support area and also our first Take Profit we gave last week.
4HR Liquidity Zone:
Marked at 2,349.179, another major support area that aligns with the daily LQZ. If price end up breaking the 1HR LQZ impulsively then we could look for this area as Take Profit and then once we get down to this area we could potentially see a pullback.
Daily LQZ:
The daily liquidity zone is at 2,286.809, a crucial support level for the longer-term perspective.
Recommendations:
Watch for Reactions at Support Levels:
Monitor the price action around the 1HR, 4HR, and daily LQZs for potential entry points.
Set Alerts:
Set alerts for breakouts above the recent highs and breakdowns below the key support levels.
Manage Risk:
Ensure proper risk management by setting stop-losses below support levels and taking profits at resistance levels.

Gold Price Set to Explode? Must-See Analysis Inside! [Update]Trade Update: XAUUSD Analysis
Date: July 17, 2024
In our previous post and video, we discussed how to approach XAUUSD given the current market conditions. Let's dive into the latest developments and analyze the chart for further insights.
Key Observations:
Break Above HTF Trendline:
We observed a significant break above the Higher Time Frame (HTF) trendline. This move indicates a strong bullish momentum, suggesting that buyers are in control.
After the breakout, the price pushed back into the structure, which is a common retracement behavior. This retracement offers a potential entry point for those looking to capitalize on the upward momentum.
Support Zone Tested on LTF:
The price action tested a support zone on the Lower Time Frame (LTF). This support zone held well, providing a solid foundation for the next leg up.
This test reinforces the strength of the support level and can be seen as a bullish signal.
Current Market Conditions:
Currently, XAUUSD is displaying a textbook play back into an area where we might see signs of either reversal or continuation.
Traders should watch for key signals at this level to determine the next move. A strong bullish reaction could indicate continuation, while a bearish signal might suggest a potential reversal.
Liquidity Zones and Reversal Points:
The chart highlights two significant liquidity zones (LQZ) and potential reversal points:
1HR LQZ/Reversal at 2429.940
4HR LQZ/Reversal at 2391.394
These zones are critical levels to monitor as they can provide valuable insights into market sentiment and potential turning points.
Conclusion:
As the price approaches these key levels, traders should remain vigilant for confirmation signals.
If the price respects the support zone and breaks higher, it could provide a good opportunity for a long position.
Conversely, if the price shows signs of weakness, it might be prudent to consider short positions or wait for further confirmation before making a move.
Stay Updated:
We will continue to monitor the price action closely and provide updates as the situation evolves.

Revealing My Top Gold Trading Secrets for Huge Profits!In this video, I reveal my top trading secrets for making huge profits in gold trading (XAU/USD). This educational content will cover key technical analysis techniques and strategies that I frequently use in my charts, as well as valuable insights into trading mindset and proper risk management. Let's unlock the potential of your trading skills together!
Technical Approach:
In this educational segment, we'll focus on the core technical analysis principles that I use to make informed trading decisions. Here's a detailed breakdown of my approach:
Identifying the Trend:
Uptrends and Downtrends: Learn how to recognize market trends using higher highs and higher lows for uptrends, and lower highs and lower lows for downtrends.
Trendlines: Use trendlines to connect the highs and lows of price movements, helping to identify the direction of the trend and potential reversal points.
Support and Resistance Levels:
Support Levels: Identify areas where the price tends to find support as it falls, acting as a floor preventing further decline.
Resistance Levels: Identify areas where the price tends to find resistance as it rises, acting as a ceiling preventing further ascent.
Historical Price Action: Use past price movements to pinpoint key support and resistance levels that the market respects.
Liquidity Zones (LQZ):
Definition: Liquidity zones are areas on the chart where there is a high concentration of trading activity, often leading to significant price movements.
Identification: Learn how to spot these zones using volume profiles, order flow analysis, and historical price action.
Trading Strategy: Use liquidity zones to identify potential entry and exit points, as they often precede major price moves.
Volume Analysis:
Volume Spikes: Understand how volume spikes can indicate strong buying or selling interest, confirming the validity of price movements.
Volume Trends: Analyze volume trends to gauge the strength of a price trend and anticipate potential reversals.
Entry and Stop Loss Strategies:
Breakouts and Pullbacks: Enter trades on confirmed breakouts above resistance or below support, or on pullbacks to key levels within a trend.
Trailing Stop Loss: Implement a trailing stop loss to lock in profits as the trade moves in your favor, adjusting the stop loss level as the price progresses.
Mini Lessons: Mindset:
Patience and Discipline:
Patience: Wait for the right trading setups that meet your criteria, avoiding impulsive decisions.
Discipline: Stick to your trading plan and rules, even when the market becomes volatile or unpredictable.
Emotional Control:
Stay Calm: Keep your emotions in check to avoid making irrational decisions based on fear or greed.
Mindfulness: Practice mindfulness techniques to remain focused and calm, especially during stressful trading situations.
Proper Risk Management:
Position Sizing:
Risk Per Trade: Limit the amount of capital you risk on any single trade, typically 1-2% of your trading account.
Position Size Calculation: Calculate your position size based on the distance to your stop loss and your risk tolerance.
Risk-Reward Ratio:
Target Ratio: Aim for a risk-reward ratio of at least 2:1, meaning your potential profit should be at least twice your potential loss.
Trade Evaluation: Evaluate each trade based on its risk-reward ratio before entering, ensuring it aligns with your trading strategy.
By incorporating these technical strategies and mindset principles, you can enhance your trading performance and increase your chances of success in the gold market. Stay tuned for more educational content and trading insights!

Market Overview Part 22Me Going Over My Full Robin Trap Strategy In Deep Detail. And What Trades Im Looking To Get In Soon!

Market Open Overview Part 19Me Going Over My Full Robin Trap Strategy In Deep Detail Must Listen Close To Get All The Nuggets

FCPO : A CONFLUENCE OF MULTI FACTORS, WHEN AND WHEREMTF-Trend & SnR is based on two measurement instruments namely Multi-timeframe Average True Range (ATR) to analyze market trends while Multi-timeframe Pivot Low High to know supply and demand (support & resistance). Exactly, it answers the confluence of "when" and "where" as a factor for traders.
5 minutes chart
5 minutes combination with GCOV5 & TCD osc
get more clearly confirmation and SnR

Market Overview Me Going Over My Full Robin Trap Strategy In Deep Detail. And What Trades I Will Get Into This Week!

Wave structure Multi timeframe analysis - CAD/JPY & GBP/USDCAD/JPY
The outlook of the CADJPY is very bearish, based on the Multi-timeframe waves structure count we should be expecting more downside in the pair. The bearish wave structure (4) on the H4 timeframe is not complete yet, we have seen a bearish 0, 1, 2, and 3 wave structures on the M15 timeframe. Having seen the 3 waves, we now have a more than 70% probability that the trend will complete the cycle which means we will see the momentum low 5.
GBP/USD
We have seen two trend-changing patterns in the GBP/USD. On Friday we have also seen a strong rejection from the high and this move down has created a potential 3rd structural failure, this means the current secondary trend is about to change to the downside.
Our short will be valid when the price trades below 1.2538; this will be a final confirmation of the trend change

#SARDAENProduct Portfolio
The Co. offers a wide range of products that include Wires Rods, HB Wires, Ferro Alloys, Pellets, Sponge Iron, and Billets.
Ongoing Capex Projects
Minerals: 1 Gare Palma IV/7 Coal Mine Chhattisgarh: Capacity enhanced from 1.2 MTPA to 1.44 MTPA in May-23, and increasing further to 1.68 MTPA in FY24 and seeking approvals for enhancement to 5.2 MTPA which will be carried out in phases. Also, setting up dedicated Railway Siding for more efficient coal transportation.
2 Coal Washery: Capacity expansion from 0.96 MTPA to 1.8 MTPA is under process.
3 Shahpur West Coal Mine : Extractable reserves of 13.4 MT and Production capacity of 0.6 MTPA – EC, CTE and Stage 1 Forest clearance received.
4 Surjagad 1 unexplored Iron Ore Block in Maharashtra: Declared as Preferred Bidder with 126.35% revenue share in May-23.
Energy
1 Hydro Power: 24.9 MW plant on the Rehar river in Chhattisgarh - construction has started; Expected to achieve CoD in FY25.
2 Solar Power: 50 MW plant to be installed at Chhattisgarh facility for captive consumption, replacing costly grid power; Contract awarded
Steel :
1 Wire Rod Mill: Received consent for capacity expansion from 180,000 MT to 250,000 MT, in FY23.
2 Iron Ore Pellet Plant: Received consent for capacity expansion from 8,00,000 tonnes p.a to 9,00,000 tonnes p.a., on 22-Dec-23.
Waste :
1 Setting up a new project for manufacturing Mineral Fibre with an estimated outlay of Rs. 70 Crores. The project is expected to be
operational by FY25.

Bullish or Bearish...? Multi Time Frame Analysis
Hey guys!
Over the past 2 weeks, we have seen the EURUSD pair go deep down. The beautiful part is that it played out well according to our analysis and prediction. So let's try again.
This time, we see this pair switch like a flipped coin from a long bearish to a steep bullish climb. Will this be the end of the bearishness, and are the Bulls to resume taking prices higher?
Or is this just one of those usual bullish pullbacks within a larger timeframe Bearish swing?
Watch this short Multi Time Frame Analysis to find out.
Please share your thoughts on this pair's price movement. Dont forget to Boost and to share with other traders
