Bitcoin Daily Update (day 258)I believe that it is possible to beat the market through a consistent and unemotional approach. This is primarily achieved through preparing instead of reacting. Click here to learn more about how I use the indicators below and Click here to get my complete trading strategy! Please be advised that I swing trade and will often hold onto a position for > 1 month. What you do with your $ is your business, what I do with my $ is my business.
My recent Bitcoin Bubble Comparison - 3 Day Chart led to the following calls: < $5,750 by 11/15/2018 & my prediction for the bottom is $2,718 by 1/20/19 | My Bitcoin Bubble Comparison - Monthly Chart closely mirrored my price and time targets | Calling for $35 ETH before the end of 2018.
Previous analysis : Reiterated views from previous post and warned about alts pumping before falling off a cliff
Position: Short BTC:USD from $6,353 | Short ETH:USD from $205.20 & $196.32
Patterns: 4h bear pennant with $4,557 target
Horizontal support and resistance: S: $5,200 | R: $5,518
BTCUSDSHORTS: Pulling back hard from shooting star
Funding Rates: Shorts pay longs 0.0263% | Was not expecting to see that based on the BTCUSDSHORT’ chart. Makes me wonder where all these shorts are? According to blockchainwhispers.com the long:short ratio is 54:46 therefore I cannot understand why shorts are paying longs. If anyone knows please leave a comment!
Looking at 4h trends today
Short term trend (3 day MA): Price recently closed below
Medium term trend (8 day MA): Recent sell signal with 3 crossing 8
Long term trend ( 34 day MA): Angled down sharply, will be apart of resistance cluster if we bounce to $6,000
Overall trend: bear
Volume: Volume has died down following the spike, another volume spike should be following soon.
FIB’s: High of Feb 20th and low of Feb 6th') 1 = $5,863 | 1.272 = $4,262 | 1.4140 = $3,426 | 1.618 = $2,224
Candlestick analysis: Failing to bounce off high volume dragonfly is very bearish
Ichimoku Cloud: Thick 1 hour cloud shows strong resistance at $5,570 - $5,780
TD’ Sequential: Daily red 9
Visible Range: If price can’t support $5,200 then I expect us to fall right through $5,000 due to the gap in volume
Price action: 24h: -0.75% | 2w: -12.97% | 1m: -14.42%
Bollinger Bands: Watching for price to stick to bottom band after closing outside
Trendline: Bear pennant
Daily Trend: Bearish
Fractals: After breaking all of the down fractals in 2018 we found support above the next one down ($5,122)
RSI: All time low on daily. Watching closely for divergence
Stochastic: Daily looks like it is recrossing bearish
Summary: The first consolidation after a move is often redistribution (or reaccumulation) and it is starting to look like BTC’ will following that pattern instead of bouncing to retest $6,000 for resistance.
The 4h chart is forming a bear pennant with a $4,350 target. That will confirm with a close below the previous candle ($5,410 on USD exchanges).That would also give the daily chart a chance to form the bull div’ that I have been watching for.
That also lines up very nicely with my prediction that $5,000 will breakdown without providing a bounce due to the gap in volume. If that happens then $4,200 - $4,500 would be very likely to provide support.
If all goes according to plan then I will be closing my shorts in that area and looking to open small longs. In the meantime I am stalking alt’s looking for short positions. EOS’, LTC’, XRP’ and TRX’ are at the very top of my list and I think the next 1-2 days will provide some prime entries.
Multi-timeframe
EURCAD 60 Cloud BreakoutMonthly direction is down
Daily is in the Sell zone
All requirements are met for a cloud breakout;
1. Have a cloud breakout
2. Have a TK cross
3. The Chikou is below price
4. Future kumo is bearish
2 Potential entries:
First, the breakout entry is 6 pips below the breakout candle (however, since the next candle was a little lower I used that low of 1.4916);
Breakout Entry = 1.4910
Stop = 10 pips + 2 for spread above the Senkou B at 1.4965 = 1.4977
Risk = 67 pips
Second, Pullback trade:
Their is a very strong Resistance level at 1.4956 (blue line) which is a great place to place a limit order
Entry = 1.4956
Stop = 1.4977
Risk = 21 pips

Bitcoin Daily Update (day 256)I believe that it is possible to beat the market through a consistent and unemotional approach. This is primarily achieved through preparing instead of reacting. Click here to learn more about how I use the indicators below and Click here to get my complete trading strategy! Please be advised that I swing trade and will often hold onto a position for > 1 month. What you do with your $ is your business, what I do with my $ is my business.
My recent Bitcoin Bubble Comparison - 3 Day Chart led to the following calls: < $5,750 by 11/15/2018 & my prediction for the bottom is $2,718 by 1/20/19 | My Bitcoin Bubble Comparison - Monthly Chart closely mirrored my price and time targets | Calling for $35 ETH before the end of 2018.
Previous analysis / Death cross with 9 and 34 MA’s, close below symmetrical triangle and a breakdown of horizontal support triggered a full entry
Position: Short BTC:USD from $6,353 and short ETH:USD from $205.20
Patterns: $5,600 target from symmetrical triangle was hit within 48 hours of breakdown
Horizontal support and resistance: S: $5,522 | R: $5,875 - $6,150
BTCUSDSHORTS: Bouncing hard and fast but still plenty of room to go before resistance
Funding Rates: Shorts pay longs 0.224% (wow!)
Short term trend (3 day MA): bearish
Medium term trend (8 day MA): bearish
Long term trend ( 34 day MA): bearish
Overall trend: Death cross provided an ideal short entry yesterday evening.
Volume: Finally!!!! If anyone tries to say that this is a bear trap / shakeout before breakout then refer them to the daily volume. When using a combo of the 5 major USD exchanges this is the highest we have seen in ~ 3 months.
FIB’s: (High of Feb 20th and low of Feb 6th')
Candlestick analysis: 1 = $5,863 | 1.272 = $4,262 | 1.4140 = $3,426 | 1.618 = $2,224
Ichimoku Cloud: 4h appears to be lining up with my horizontal resistance at $5,868
TD’ Sequential: Today closed a red 7 and we just opened a red 8
Visible Range: Gap in volume at $5,000 makes me think there will not be the support there that most expect
Price action: 24h: -10.24% | 2w: -10.59% | 1m: -9.28%
Bollinger Bands: Dat' bulge we have all been waiting for : )
Trendline: Connect top of May 5th to top of July 24th. I expect this to be the top of the down trend.
Daily Trend: Bearish
Fractals: Took out every last down fractal from 2018
RSI: Record low! High alert for bearish divergence. One one other time daily RSI was < 19.6 and a 18.32% bounce followed. If that happens again then price would rally to $6,332 (probably while alts have a flight to safety) and that would create a very similar bear trap that we saw in 2014 - 2015.
Stochastic: Monthly is falling into oversold territory. Monthly buy signal + RSI < 45 will be strong indicators of the bottom. Should be combined with weekly RSI < 30. All things to pay close attention to.
Summary: Already took profit on 25% of my BTC’ and ETH’ shorts due to RSI reaching record lows along with the daily TD 8 opening (will often get a 1-4 candle correction on a 7 or an 8 instead of a 9).
Now I am preparing for three options: a bounce that retests $5,868 - $6,150 for resistance. If that happens then I will be considering it the highest probability entry of the year. I expect there to be so big volume waiting to exit their longs at that price range.
Nevertheless I am paying close attention to the bear trap that followed the support breakdown in the 2014 - 2015 bubble (see charts above). The markets have a strong propensity to rekt both bulls and bears whenever possible. A short term bounce back to $6,300 would do exactly that and it is something to prepare for.
The main catalyst that could cause that is a flight from safety out of alts and back into BTC’. Could also see another pump caused by traders exiting Tether. That premium is back to 5% and has been inflating the price on USDT exchanges.
The last option I am watching for is a divergence in the daily RSI like the one that followed the last time it reached < 19.6. If that happens then I plan on exiting 80% - 100% of my position with the intention to re open at 10% - 18% higher.

NZDUSD - long again to finish wave 5 Elliot- two targets Elliot wave 3 is reached.
- Symmetry wave is at the wave (3) wait he drop wave (4) for buy
- I predict NZDUSD will up again to Elliot wave 5

EURJPY Potential Cloud BreakoutPotential cloud Breakout
The Monthly direction is down
Pair is in the Sell zone on the Daily
and is at major resistance levels
Since this trade is several hours away from a
set-up I can not provide specific order details
That said there is 2 ways to enter this trade:
First, on a 60 min close below the Daily Kejun Sen (blue line)
Second would be a cloud breakout satisfying all the criteria;
1) a Cloud breakout
2) A TK cross
3) The Chikou is below price
4. A future Kumo twist
** Also the close of the breakout candle must close below the Daily Kejun Sen

CHFJPY 60 Cloud BreakoutMonthly and Daily direction is down and have met a ll the requirements for a Cloud Breakout:
1. Have a break below the Cloud.
2. Have a TK cross
3. The Chikou is below price
4. The future Kumo is bearish
2 Potential entries for this trade:
First; The Breakout trade. Entry is 4 pips below the low of the Breakout candle (in this case we have to adjust for round number support)
Entry = 112.98
Stop = 113.45
Risk = 47 pips
PT = 3xR = 141 pips = 111.57
Second: a Pullback to the 60 Kejun Sen at 113.31 (turquise line on chart) This entry while providing better risk/reward decreases the probability of success.
Entry: 113.31
Stop 113.45
Risk = 14 pips
PT = 10xR = 140 = 111.91
** The Blue line on the chart is the Daily Kejun Sen and represents a major Support/Resistance level

S&P 500 Speculation My goal is to create an edge. After Multi-Time Frame analysis, I have concluded that the S&P 500 is currently in a downtrend. When the market corrects, I will look for a short entry here.

Gold Futures Speculation My goal is to create an edge. After Mutli-Time frame analysis, I've determined the Larger Picture trend is bullish. When the market corrects, I will look for an entry into the trend here.

Bitcoin Daily Update (day 243)I believe that it is possible to beat the market through a consistent and unemotional approach. This is primarily achieved through preparing instead of reacting. Click here to learn more about how I use the indicators below and Click here to get my complete trading strategy! Please be advised that I swing trade and will often hold onto a position for > 1 month. What you do with your $ is your business, what I do with my $ is my business.
My recent Bitcoin Bubble Comparison - 3 Day Chart led to the following calls: < $5,750 by 11/15/2018 & my prediction for the bottom is $2,718 by 1/20/19 | My Bitcoin Bubble Comparison - Monthly Chart closely mirrored my price and time targets | Calling for $35 ETH before the end of 2018.
Previous analysis / position: “If you are not in a position then opening a short at $6,300 - $6,315 provides favorable risk:reward. A stop loss slightly above $6,400 makes a long of sense” / Short USDT:USD from 0.0968 (order set at 0.97 to exit at a nominal loss) | Short ETH:USD from $197.81 & Short ADA:BTC from 0.00001129
Patterns: Symmetrical triangle with $5,492 target if it breaks to the downside and $7,101 target if it breaks to the upside
Horizontal support and resistance: Prior support is expected to become resistance from $6,345 - $6,385 | S: $6,300
BTCUSDSHORTS: Pulling back hard, will it find support above 28,500? | Could this be the last squeeze before the trend starts?
Funding Rates: Longs pay shorts 0.01% | Do not think funding has been this out of balance towards longs in all of 2018
Short term trend (3 day MA): Price above and angling up = bullish | Trying to make bullish crossover with 8 MA (signals medium term trend along with 3 week)
Medium term trend (3 week MA): 3 & 8 MA’s are angling up but price is below = neutral
Long term trend ( 34 Week): bear
Overall trend: If 3 day crosses 8 that will make me short term bullish (although I will wait for much more confirmation before looking for a bullish entry). Definitely don’t like being against the trend with my shorts
Volume: gfy
FIB’s: Broke through 0.618 at $6,312 and 0.5 at $6,345 | Next up is 0.382 at $6,378
Candlestick analysis: Just took out daily shooting star. I was really hoping that the top of that wick would hold as resistance
Ichimoku Cloud: 4h cloud is fatting up after a bearish kumo twist. Shows thick resistance from $6,340 - $6,478 unless we can breakthrough the thin cloud before | Broke through 1h cloud on this last move | Daily cloud is right above the down trend line. This has saved me before, the area between the cloud and the bear trendline indicates a potential area for a bull trap
TD’ Sequential: D g1 | 4h g5 | Had a small 1 candle correction after the g9 on the hourly, now g2 > g1
Visible Range: Testing point of control for 2018. There should be a ton of built of resistance in this area
Price action: 24h: +0.088% | 2w: -1.66% | 1m: -11.52%
Bollinger Bands: Testing MA right now. MA is angling up which indicates that it is less likely to act as resistance
Trendline: Bear trend: $6,475 | Bull trend: $6,200
Daily Trend: bull
Fractals: Created new down fractal at $6,300
RSI: One hour RSI is very overbought (> 80) while we are trading at major resistance. Very strong indication of a reversal
Stochastic: 4h is overbought, agrees with 1h RSI
Summary: I rarely put any emphasis on the 1h hour chart. However I have the 1h & 10m RSI's to be very helpful for recognizing when we are overbought or oversold on a short term basis. After the price broke through the daily shooting star as well as the 4h shooting star from the prior candle I was very worried that we would pump right back through $6,400. Now I am feeling cautiously optimistic. Being overbought at major resistance is generally a very strong sign of a short term reversal.
If you took the position that I outlined yesterday then your stop should still be safe (for now) and I don't see any reason why that should be adjusted now. If you are still on the sidelines then this could be a great opportunity to build a short and use a tight stop loss. We are at a very significant resistance cluster and this was the original area where I suggested an entry from two days ago . Setting a stop loss anywhere from $6,450 - $6,550 makes a lot of sense based on horizontal and trend resistance.

Bitcoin Daily Update (day 242)I believe that it is possible to beat the market through a consistent and unemotional approach. This is primarily achieved through preparing instead of reacting. Click here to learn more about how I use the indicators below and Click here to get my complete trading strategy! Please be advised that I swing trade and will often hold onto a position for > 1 month. What you do with your $ is your business, what I do with my $ is my business.
My recent Bitcoin Bubble Comparison - 3 Day Chart led to the following calls: < $5,750 by 11/15/2018 & my prediction for the bottom is $2,718 by 1/20/19 | My Bitcoin Bubble Comparison - Monthly Chart closely mirrored my price and time targets | Calling for $35 ETH before the end of 2018.
Previous analysis / position: “Bounce to $6,385 | selloff to $6,000 | bounce to $6,150 and then breakdown $6,000” & warned against selling bear flag breakdown due to underlying support / Short USDT:USD from 0.968 | Short ETHUSD' from $197.81
Patterns: Coil
Horizontal support and resistance: S: $6,300 | R: $6,312
BTCUSDSHORTS: Closed below triangle
Funding Rates: Longs pay shorts 0.01%
Short term trend (4 day MA): Above MA, but it has not starting turning up - neutral
Medium term trend (4 week MA): bear
Long term trend ( 32 Week): bear
Overall trend: bear
Volume: Lowest monthly volume since Oct 2017
FIB’s: Selloff found support at 0.786 ($6,210) | Breaking down 0.618 ($6,327) is very significant | 1.618 extention is at $5,630
Candlestick analysis: Daily was a bit of a darth maul | Interested to see how we react from the 4h doji
Ichimoku Cloud: 1h cloud called the area of resistance on this last pump. Watch for price to close below the kumo at ~$6,300
TD’ Sequential: With monthly close the setup in continued with a r3 | Daily r5 | Weekly r4
Visible Range: Looking back to Feb 2018 (when this range started) and the POC is at $6,339 with the bottom of the highest volume node at $6,162.
Price action: 24h: +0.63% | 2w: -1.37% | 1m: -4.42%
Bollinger Bands: Daily MA at $6,364 has just starting angling up which is very interesting. Haven’t seen this angle up for weeks and that indicates that it is less likely to act as resistance
Trendline: Bear trend is at $6,500 | Bull trend line (phase 2 hyperwave) is at $6,195
Daily Trend: bull
Fractals: Busted two down fractals on last move, next one waits at $6,055
RSI: 4h resisted 50 | 1h no longer oversold and is pulling back from overbought territory
Stochastic: Daily buy signal | 4h entering overbought territory | 1h sell
Summary: Everything is still going according to plan. I was closely watching the monthly close today for a couple reasons. First of all I was really wanting the TD’ setup to continue with a red 3 as outlined in my most reason Bitcoin Bubble Comparison . The second reason was a close below $6,390 (Bitstamp) gave us the lowest monthly close since September 2017.
Now I am watching for resistance to hold strong below $6,385 over the next 24 - 48 hours. If that happens then I will be feeling confident in a $6,000 retest,. I still expect that area to provide one last dead cat bounce before the price breaks down the yearly support.
If you are not in a position then opening a short at $6,300 - $6,315 provides favorable risk:reward. A stop loss slightly above $6,400 makes a long of sense based on horizontal support and resistance along with the visible range volume profile.


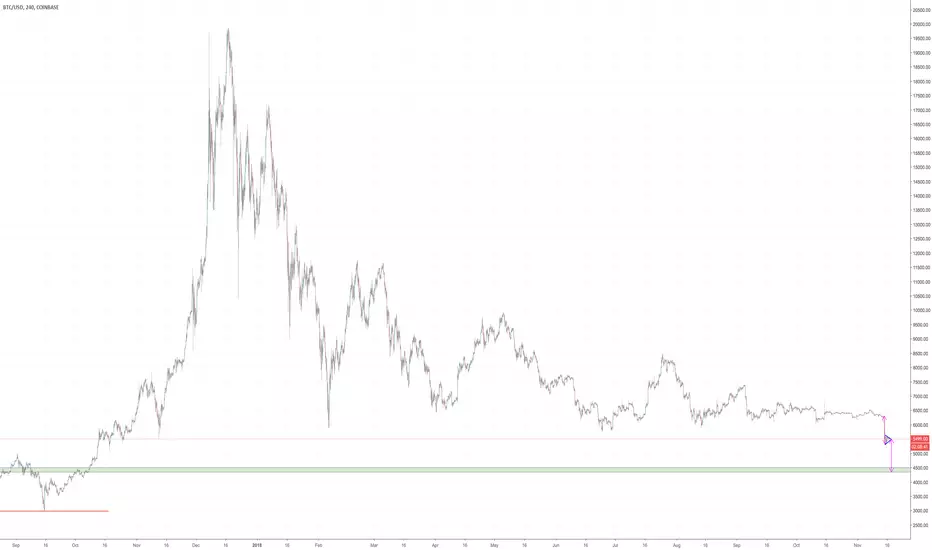
BTCUSD H4For today
We modify our green channel somewhat.
Considering the energy from the demand area
The price can go up to the supply area.

USDCAD - short at H4Wait for USDCAD reached reversal for short
3 targets are calculated by Elliot waves rule
Like, Comment, follow me. Thanks for watching my idea!

CADJPY - LONG AGAIN2 group waves for buy.
H4 (1)(2)(3)... buy from the wave (4) to (5)
Daily I, II, III... buy from the wave IV to V
Targets are calculated buy Elliot Waves rule.
* Update chart *
Like, comment, follow me. Gook lucks.

EURCAD - short again at Wave 4 Elliot- Symmetry wave is the Wave (3) to wave (4)
- Elliot waves are the Wave 3 to 4
Entry 1: Sell limited at 1.49657
Stop loss: 1.50700 + 0.02 = 1.50900
Entry 2 : Sell limited at 1.50183
Stop loss: 1.51800 + 0.02 = 1.5200
Target is at wave 5 Elliot: 1.45599

NZDJPY - short at Daily (symmetry wave rule)Look left, finding a rule wave for Entry.
There are 2 Zone for Sell:
1. The Group wave Weekly (I)(II)(III)... is at the 'Wave (III) to Wave (IV).
2. The Group wave Daily I, II, III.. is at the Wave V to VI. I want to sell in the zone of this group (price is from 75.537 to 76.362).
When NZDJPY reached The zone for Sell and down (break trendline at the Smaller timeframe).
Therefore, I predict he will drop again.
* Entry 1: Sell now
Target 1 is at 73.841.
Target 2 is at 73.167.
Stoploss is at above the Wave VI 20 bibs 76.363+.0.200 = 76.563
* Entry 2: Sell limited at 76.362
Stop loss is at 77.167 + 0.20 = 77.367
Target is the Same.

EURJPY - LongMonitor 1 Weekly (I), (II) (III): UP, Wave (II) to (III).
Monitor 2 Daily I, II, III: Down, is The wave II.
Monitor 3 H4 (1), (2), (3): Up, is the wave (2) to (3). Follow Monitor 1.
Monitor 4 H1 1, 2, 3: Up, is the wave 4. Follow Monitor 1.
* Therefore I predict EURJPY will go accord Monitor 1.
Entry 1: Group wave H1 from 130.216 - 130.846 or out the Green Trendline for a buy.
Stop loss: 128.320 (reversal for down to zone wave H4).
Take profits: 133.993 (Butterfly).
Entry 2: Group wave H4 from 127.349 - 125.979.
Stop loss: 121.713 (Below Daily trend).
Take profits: Move stop loss (Symmetry rule wave). Update later.
Like, comment, follow me, thanks. The prediction is always 50/50

EURGBP - short at H4Look left, Weekly resistance has broken for a downtrend.
At the present H4 group wave has a rule symmetry at the wave (2).
Thus, I predict EURGBP will down again from the wave (4) to (5)
- Stoploss is above the wave (2) some bibs.
- Should move the stop loss at symmetry rule waves

NZDUSD - short at DailyLook left, The downtrend at Daily still valid. The Daily group wave I, II, III... is at zone wave VI.
Nearest, The group wave H4 (1), (2), (3)... is at zone wave (6).
Thus, I predict NZDUSD drop again from the wave VI to wave VII
Target 1: 0.65953, Target 2: 0.65037
Stop loss: 0.067916

What Support Looks Like When It BreaksLooking at the m15 chart only can lead you to have the correct idea but in the wrong place.
By looking at high time frame charts you get a better picture of when a trend is in place, when a trend is no longer working or when there is no trend and we're in a range.
On the attached charts a daily time frame (top left) has a defined up trend and at 1.6700 the trend line and price meet for the 3rd time of Sept 27th. Here traders wanting to keep adding to long trade would initiate a long trade.
However by the close of the daily candle that idea is no longer valid, as the trend line did not hold as support.
Moving down through the smaller time frames we see that the days leading up to the 27th September have been consolidated into small daily moves. There is a clear line of support under these days that is clearly broken on the H1 chart etc. This equates to the time when the Daily candle approaches the rising trend line.
What we see happen next is that the broken daily horizontal support is now acting as horizontal resistance and price is trapped between this new horizontal resistance and the rising daily up trend.
When the horizontal resistance holds and the daily rising trend line are broke on the H1 candles traders waited for a quick retest and then went short. Accelerating the move.

XAUUSD - Short again at H1Daily group wave I, II, III... is at wave IV to V (Down)
H1 group wave 1, 2, 3... has a rule symmetry waves.
- Stop loss: 1201.03
- 3 targets are calculated by Elliot rule wave
tp1: 1179.67
tp2: 1172.43
tp3: 1160.56
like, comment, follow me. Good luck.

USDWTI - What next?Look left for finding the Next Target of Oli.
2 targets are calculated by Elliot rule will be: 78.63 and 94.79
Like, comment, follow me. Thanks
