USDCAD - Down Movement on most TFs expected - MTFA*** Trade at your own risk! ***
*** Not every idea is also traded by us ***
Hi Traders!
In the following you'll see a Multiple Timeframe Analysis.
It includes a screenshot and afterwards some bullet points.
Monthly TF:
- Price was in a Downtrend --> Big Direction
- Then it pulled back --> Healthy for a Trend
- A consolidation started --> Ready to for a change
- It made a double Top --> shows rejection for higher prices
--> Break of Support + Downmovement is expected
Weekly TF:
- Price was moving down
- It respected a descending TL
- It broke out of the TL
- It makes a Pullback of Down-movement
Two Possibilities:
1) Break of Trendline
Buyers will probably loose their strongest structure for now.
Sellers will probably get a bias to sell.
--> Downmovement
2) Break of Resistance
Sellers will probably get weak.
Price shows that it respects higher prices.
Daily TF:
- Break of daily Support
- Successful Retest is finished
--> Break of ascending TL expected
--> Down-movement expected
H4-TF:
- Market pulled back to retest the Breakout
- It went down a bit and made a Shooting Star Candle
- This Shooting Star shows Rejection for higher Prices
--> Down-movement expected
If you have any questions, another Point of View or anything else to share, don't hesitate to comment!
Thanks and successful Trading :-)!
Multitimeframeanalysis

XRPUSD Daily Breakdown Wed.Jan.26.2022Please like and comment as it pushes me to keep creating content on pairs and my bias on it :) -This is merely MY outlook and not advice on what YOU should do just my opinion on what I see - yonsfx

audchf is in resistance zone i am bearish on this pair because in all timeframes it show us bearish market . now i will enter short trade after breaking the zone that i specified

CHFJPY - Multitimeframe AnalysisCJ is looking good for shorts. We have multiple confluences for it as explained in the video.
Summary:
Monthly Timeframe:
- Price has just run up higher filled in a Fair Value Gap perfectly. It seems to be reversing from here.
Weekly Timeframe:
- We have an unmitigated Orderblock. Since this orderblock was a "Sell to Buy", means that the selling positions from Smart Money are currently in extreme minus positions, and they will want to reprice lower to mitigate out of their minus positions.
Daily Timeframe:
- We are creating SMT Divergence with its correlated pair - EURJPY. This means that CHFJPY went higher to run out the buy stops and made higher highs, will EJ is creating lower highs. CJ will most likely distribute to then run lower.
- Price has just reacted off a Daily Bearish Breaker Block, which should push price lower.
- Huge Imbalance FVG Gap. Price will come back to fill it as fast as possible.
- Massive Consolidation. Below these consolidations, there are lots of sell stops that will get taken out.
H2 Timeframe:
- Potential Sell POI. Valid Orderblock + Breaker that also caused the last low to get broken to the downside (Break in Market Structure - BMS).
- We have a Bearish Trendline that has three beautiful touches. Everyone that already is in Shorts from the trendline will get liquidated at the next mitigation of the Trendline up into the OB + Breaker and sell off further from there.

BHEL - LONG TRADEIt can be good choice for swing trade for a couple of weeks if it breaks the downward trend-line followed from 13 Oct 2021.
For this stock 60.7 acts as a crucial level from May 2004.
The Stock is at a trend line support
Trade Details:
Trade Active : When trend Line breaks
Entry: below 63
Stop Loss: Below Trend line
Targets: 66, 69.7, 74, 77
Holding Period: at least 2-3 weeks
Use trailing Stop Loss: Keep Stop Loss below the target , once the stock is going for next target.
Happy Investing :)

XRPUSD Daily Breakdown Tues.Jan.25.2022Please like and comment as it pushes me to keep creating content on pairs and my bias on it :) -This is merely MY outlook and not advice on what YOU should do just my opinion on what I see - yonsfx

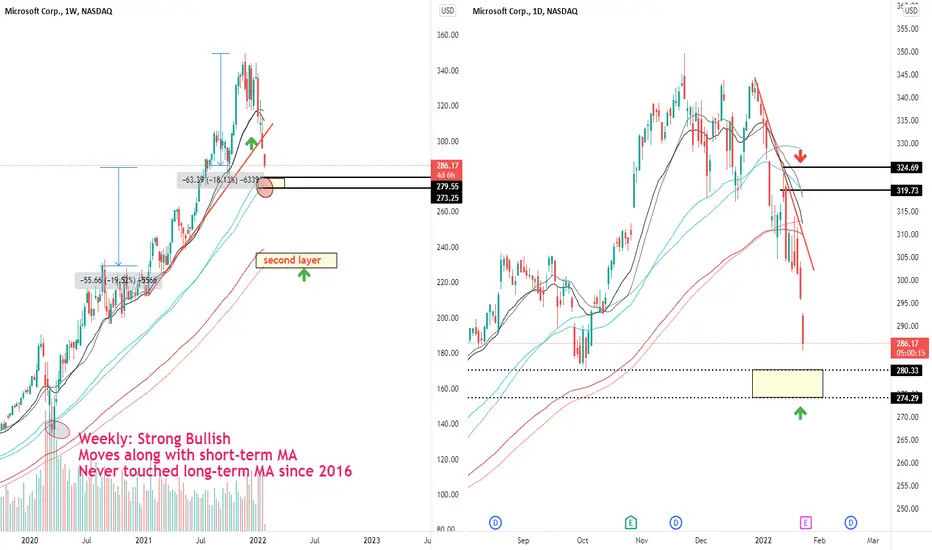
JICPT| Bullish setup of Microsoft on areas(274-280)Hello everyone. Microsoft has been down by almost 20% from the historic high of 349ish created on late Nov. of last year.
I got two reasons for the bullish setup:
1. Mid-term MA has been respected well since June of 2016.
2. Structure on weekly is aligned with daily. Though, the second layer around 227-2336 is more solid with another 16%-20% down from the current level.
Trigger:
1. The earning report is due soon. We'd better wait. If the result is better than estimation. That's my confirmation one.
2. I need to see price action to the zone. To be more specific, I need small candles and reversal pattern formation. That's my confirmation two.
Frankly speaking, I'm not afraid of holding stocks like Microsoft. The pullback really gives us an opportunity.
What do you think? Give me a like if you're with me.
XRPUSD Daily Breakdown Mon.Jan.24.2022Please like and comment as it pushes me to keep creating content on pairs and my bias on it :) -This is merely MY outlook and not advice on what YOU should do just my opinion on what I see - yonsfx

WEEKLY FOREX OUTLOOK SUN.JAN.23.2021 - FRI.JAN.28.2021Please like and comment as it pushes me to keep creating content on pairs and my bias on it :) -This is merely MY outlook and not advice on what YOU should do just my opinion on what I see - yonsfx

EURUSD - Up-Movement at different Layers - MTFA*** Trade at your own risk! ***
*** Not every idea is also traded by us ***
Hi Traders!
In the following you'll see a Multiple Timeframe Analysis.
It includes a screenshot and afterwards some bullet points.
Monthly TF:
- Strong monthly Trendline got broken
- Now price is retesting it
- If the Retest is successful, an Up-Movement is very likely
- We can see signs that the Retest is successful, because there are Wicks which shows Rejection
--> Up-Movement expected
Weekly TF:
- Additionally to the Monthly TF, the mostly respected 61,8% Fibonacci Level increases the strength
of this Support
Daily TF:
- Break of daily descending Trendline
- Now price retests the descending TL
- Price gets support at the ascending TL
- Downtrends with its LHs and LLs ends --> Now we have HHs and HLs
--> Trend Change
H4-TF:
- A successful Retest could be performed via the Inverted Head and Shoulders Pattern
- If the market breaks the upper Resistance Area, an Up-Movement is very likely
H1 TF:
- MACD Oscillator showing bullish Divergence
If you have any questions, another POV or anything else to share, feel free to do so!
Thanks and successful Trading :-)!

XRPUSD Daily Breakdown Sun.Jan.23.2022Please like and comment as it pushes me to keep creating content on pairs and my bias on it :) -This is merely MY outlook and not advice on what YOU should do just my opinion on what I see - yonsfx

BTC !Hello Everyone...
Important price levels are shown in the chart
The level of 29 to 30 thousand dollars is very important and valid, and I think there will be strong support there, but if we lose that level, the situation will be a little difficult for Bitcoin and the market, and the twin ceiling pattern will appear.
In a situation where the market and traders are scared, I do not offer leverage to anyone
I suggest buying a ladder in Spot Market
And I advise you to stay away from futures market...
Observe the behavior of whales
Anchin data is very important and influential in this situation
And...
Do not put all your eggs in one basket :)
Have a nice time

XRPUSD Daily Breakdown Sat.Jan.22.2022Please like and comment as it pushes me to keep creating content on pairs and my bias on it :) -This is merely MY outlook and not advice on what YOU should do just my opinion on what I see - yonsfx

USDCHF - Bearish Break expected - MTFA*** Trade at your own risk! ***
*** Not every idea is also traded by us ***
Monthly TF:
- Market in a Monthly Range
- Market @ lower Level of the Range
Weekly TF:
- Market have a strong descending Trendline which
- Symmetrical Triangle Pattern
- Market broke the ascending TL
Daily TF:
- Break of Support is expected, because we have the Break of ascending Trendline on the one hand
and the pressure of the descending Trendline on the other hand
H4 TF:
- To continue its Downtrend, it needs to make a Lower Low.
It is difficult to make a lower Low just like that, because the Support needs to get broken.
Here are three potential Possibilities:
P1: Market makes a Low, then it makes a Pullback and breaks the Support.
P2: Market makes a consolidation at the Support and breaks it.
P3: Market gets Volatility in the London Session on Monday and breaks the Support directly.
If you have any questions, another Point of View or anything else to share, don't hesitate to comment!
Thanks and successful Trading :-)!

XRPUSD Daily Breakdown Fri.Jan.21.2022Please like and comment as it pushes me to keep creating content on pairs and my bias on it :) -This is merely MY outlook and not advice on what YOU should do just my opinion on what I see - yonsfx

XRPUSD Daily Breakdown Thurs.Jan.20.2022Please like and comment as it pushes me to keep creating content on pairs and my bias on it :) -This is merely MY outlook and not advice on what YOU should do just my opinion on what I see - yonsfx

EURGBP - Pullback expected - MTFA*** Trade at your own risk! ***
*** Not every idea is also traded by us ***
Hi Traders!
In the following you'll see a Multiple Timeframe Analysis.
It includes a screenshot and afterwards some bullet points.
Monthly TF:
- Consolidation/Range
- Price @ Support of this Range
- This time, price fell without any deep Pullback --> Bearish Strength
- Break of monthly Support --> Is it a Breakout or a Fakeout? --> Wait for (un)successful Retest to confirm that
Weekly TF:
- Reaction @ turquoise Area expected
- After analyzing the lower TFs, we found out that a pullback before entering the area is also possible
--> Don't expect a guaranteed entry of this Area
Daily TF:
- Pullback towards the Fib' Levels
- Price is making LLs and LHs, so it'll probably continue that pattern in the future
H4 TF:
- Bullish Divergence on the MACD Oscillator
If you have any questions, another POV or anything else to share, feel free to do so!
Thanks and successful Trading :-)!

XRPUSD Daily Breakdown Wed.Jan.19.2022Please like and comment as it pushes me to keep creating content on pairs and my bias on it :) -This is merely MY outlook and not advice on what YOU should do just my opinion on what I see - yonsfx

ABBOTINDIA - LONG ENTRYThe Stock takes support on weekly basis, where it faced resistance previously.
On monthly chart it created a hammer candle on the support zone.
Good Swing Entry for a couple of months, hoping to see new all time high
Trade Details:
Buy Below : 19600
Stop Loss : 17300
Holding Period: more than 2-3 months

AUDUSD is near to the support i am bearish on dollar index so i am bullish on every pair that has usd at other side . i will enter trade after breaking the zone to the upside

dxy : is it ready to short ?!i am bearish on dxy at now and i have to scenario for it
at first scenario if price could hit the resistance line then i will be wait to break the dark zone to enter trade
at second scenario i will wait until the blue zone broke to the downside
good luck !

XRPUSD Daily Breakdown Tues.Jan.18.2022Please like and comment as it pushes me to keep creating content on pairs and my bias on it :) -This is merely MY outlook and not advice on what YOU should do just my opinion on what I see - yonsfx

XRPUSD Daily Breakdown Mon.Jan.17.2022Please like and comment as it pushes me to keep creating content on pairs and my bias on it :) -This is merely MY outlook and not advice on what YOU should do just my opinion on what I see - yonsfx
