Pudumjee Paper - Ready to Print Currency Notes :)There is no Election without Liquor & Briyani, and neither without Advertisements about each political Party
Liquor, Media, Paper stocks were expected to Rally from couple of months back, but none of them picked up the Rally until now where many portions of India has already completed Election
Anyways, our earlier Pick of Paper Stock - Pudumjee Paper is all gearing up to print Money Bills soon
Comparison on Daily, Weekly and Quarterly charts clearly articulate how Support and Resistance works and how each pattern contributes incrementally to another larger chart Pattern
Quarterly View: 7 Year Rounding Bottom Breakout done. In between, the Price also had a Fib 0.5 scale retracement and Bounce with Extended Fib Targets as shown below
Fib 1.618 Target = 98
Fib 2.618 Target = 139
Weekly View: Look at the Long Dragon Fly Doji pattern on the week of 11th March. Its a very important structure as it tested and bounced from 2 support levels.
The Wick bounce from the Previous Cup and Handle BO at 55
The Candle body finished above the Multi-year Rounding Bottom BO Trendline (highlighted in Quarterly chart)
Daily View: On the Daily, there are 2 bullish structures
Inverted H&S - On verge of BO above 75 for Target of 98 - which matches FIB 1.618 target of Quarterly
Rounding Bottom - BO pending above 84 WCB for Target of 114
As you can see the structures, patterns, supports, resistances and Targets of one Pattern has overlap / leads to the components of next larger pattern. These are NOT coincidences. This is how Chart patterns do get formed based on People Behaviour which is repetitive and which is governed by 2 main aspects (Greed & Fear)
Disclaimer:
3+ Years Teaching Experience in Stock Market - Technical Analysis, Behaviour Analysis, Advanced Patterns, Emotional Management, News based Trading...
We are NOT SEBI Registered and Our focus is NOT providing Buy/Sell Recommendations/calls. Primary Objective is to provide detailed analysis of how to review a chart, explain multi-timeframe views purely for Educational Purposes.
We strongly suggest our followers to "Learn to Ride the Tide irrespective of its Side"
*** Important *** Consult your Financial Advisors before taking any positions
If you like our detailed analysis, please do rate us with your Likes, Boost and share your comments
-Team Stocks-n-Trends
Multitimeframeanalysis

EurUsd - How long will Risk-On sentiment last?Hello traders.. For EurUsd we observed a very nice swing to the upside over the previous day of trading as decent Eur data beat Usd data for services and manufacturing PMI. We saw initial upside with the Eur data shortly after London open and this was followed by a pullback. Only until more data was released during NY session , we were to see another bounce to the upside. Risk on sentiment was the name of the game today as the Dollar index sold off with the Bad USD data. This was also coupled with a descending Vix and rising U.S. stock indexes leading up to and with the Bad USD data. The monthly candle is currently pulling back up. The weekly candle has shot past the previous weekly high by about 15-20ish pips. The Daily candle closed strongly bullish today, suggesting some more upside moving into this next day of trading.. we have no news in the upcoming session. Asian has pushed up slightly to begin the day. Key prices to watch in the upcoming session 1.0701, 1.06936

Daily #EURUSD analysis, 24 April.Daily time frame:
1. Swing is bearish, INT is bearish.
2. After iBOS we can expect INT pullback.
3. The pullback phase is ongoing, Now we can play longs to target
at least the EQ of the range.
4H time frame:
1. 4H swing is bearish, INT is bearish.
2. After swing BOS we can expect swing pullback.
3. Bullish CHoCH is a sign that the INT pullback has started.
Now we can play longs targeting at least the EQ of the range.
4. The price hit a supply area, but it is not that strong to motivate the price to shift bearish again.
we could just see a reaction from it.
Follow LTF.
15M time frame:
1. The 15M swing is bullish now.
After swing BOS we expect a swing pullback phase.
2. INT structure is bullish, but it could shift bearish at any moment to facilitate a 15M swing pullback.
3. We can play longs following the INT structure.
Or we could wait for a clear shift to play shorts (Swing pullback phase).

Daily #EURUSD analysis. 23 April.4H time frame:
1. 4H swing is bearish, INT is bearish.
2. After swing BOS we can expect swing pullback.
3. Bullish CHoCH is a sign that the INT pullback has started.
Now we can play longs targeting at least the EQ of the range.
Follow LTF.
15M time frame:
1. The 15M swing is bullish now.
After swing BOS we expect a swing pullback phase.
2. Price pulled back to the extreme mitigated the last POI and shifted bullish with a CHoCH.
3. INT structure aligned with swing (bullish).
Now we can look for longs targeting weak swing 15M high.

EurUsd: Short-Term Eur strength & Pullback possibleHello Traders.. Another week and more price action to anticipate in the Forex market. EurUsd: As we enter the 4th week of April our Monthly candle is still bearish with a solid bearish body. Last week we came very close to a Monthly support level at 1.057. The low of the week was on Tuesday and coincided with a Hawkish Fed speech. The weekly candle closed bullish and we now have a weekly support level at 1.0649. The weekly candle closed a small body doji - looking candle with a larger top wick. The new week gapped up 5 pips. The daily candle's price action from last week looks quite subdued. Looking for buys on EurUsd still apears risky to me as we still have hot jobs data and rising inflation. We had hawkish fed speech last week which means higher potential rates for the USD. This means USD could be increasingly used in the Carry trade, an even better reason to look for USD strength. Not much has changed and yes we can observe a pullback , with Eur Strength. Overall bearish on EurUsd but trading a pullback to the upside is definitely possible. We'll have to see how EurUsd reacts with the Daily resistance level 1.06726. The USD Index ended last week pulling back from a Daily Resistance level.. and we've done exactly that after 8 hours at the beginning of this new week. This could indicate Eur strength in the coming 2 sessions. Although I'm anticpating a higher Vix and lower Oil prices. It may be too early in the week for a Lower EurUsd.. we may observe short term Eur strength as a result.

U.S. Stock Indices, signs of Relief? 🏛️hello traders.. the U.S. stock indices have been getting pounded by bearish sentiment related to new war conflicts. Also, they were due for a pullback as things have been quite bullish the last few months. Price currently is testing a Daily support level on Nasdaq at 17,500. The NYSE 1hr candle just closed strong bearish below our Daily support level and we are currently retesting structure to continue bearish. A 4hr zone at 17,410 may be the last hope for bears before another selloff takes place to retrace another 2 percent to 17,164 Daily support level. We currently have bearish momentum in the Risk-On stock markets. We had retail sales come out much better than expected earlier this week but this didnt do much at all for price. Strong jobs data and increasing inflation in recent months have increased price a decent amount and this looks like a healthy pullback for profit taking and liquidations.

Crude Oil retraces on Conflicts🛢️Hello traders.. WTI Crude Oil has been dropping since the beginning of the conflict this past weekend between Iran and Israel. We are trending bullish so far on the year and are up 14%. Price is pulling back this week and we recently touched into a Daily support level 81.25 where we observed a bounce. I dont believe sellers are completely out on this bearish retracement and am looking for a retest of the Daily level 81.25. We have a 4hr resistance zone at 82.30 that may aid in facilitating a move back down.

Gold stuggles at the Highs of the weekly range 2,393 🪙Hello traders.. gold has been making all time highs. The last all time high was created with consumer sentiment news that miss forecast for the USD last friday. Since then we've been going sideways and are currently in a 4hr range between 2,393 and 2,360. The weekly candle is bullish & the last 2 daily candles have closed bearish. The 1hr candle is currently bearish during Thursday NYSE as price appears to be rejecting the Daily resistance (2,383) once more. We may retrace back to the bottom of the range at 2,360

Change in Sentiment? 😐 EurUsdHello Traders.. EurUsd just dropped off last week. Those market participants who caught this massive selloff may be thinking of taking some chips off the table. This coincides with a bullish trend in bond yields and the S&P futures wasting no time heading to the upside to begin the week. The Iran and Israel conflict adds a layer of complexity to this new week of money movement. In the short term I am looking to the upside on EurUsd as the new weeks kicks off. The previous weekly candle closed with a 14 pips bottom wick and a 195 pips body. Some exhaustion from sellers may cause the buyers to take over to begin the week here for EU. My short-term targets for the next sessions are 1.06840. We may recieve a pullback to consolidate and retest 1.06325 as well prior to more buying pressure on EU. Caution, this is a countertrend analysis and should be taken with a grain of salt. Not Financial advice, just for general information and educational purposes only.

USDJPY. Medium-term analysisOn the weekly timeframe, we have a sideways market. The current short-term trend vector is 5-6

ETHUSDT. Are waiting for a buyerOn the daily timeframe we have a sideways market. The bearish vector 5-6 has been played out. After the price interacts with the level of 3200 and the buyer’s strength shows, we can consider long positions with a target of 3722.

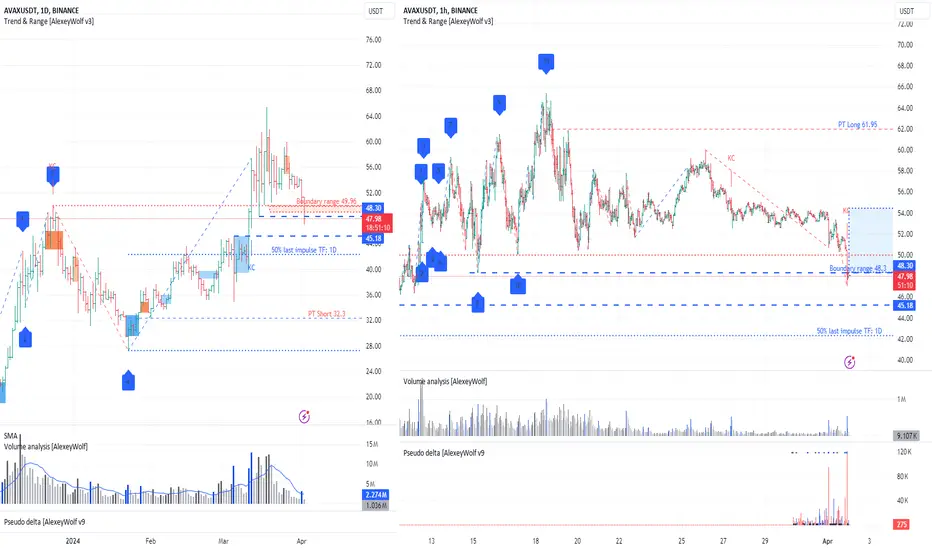
AVAXUSDT. Looking for salesHello traders and investors!
On the daily timeframe, we observe a sideways trend. The buyer's vector 4-5 has played out. The price is at the upper boundary of the sideways trend, and we can consider looking for sales as an idea to implement the seller's vector 5-6 with the first target at 40.07 (then 34.83, 32.3). After the previous review, we notice a strong resumption of the seller from the upper boundary of the sideways trend at 49.96. I anticipate that the price will test the local minimum of 44.97.
On the daily timeframe, we also see a sideways trend. The current seller's vector is 8-9 with the first target at 45.17.
It's preferable to look for sales from the upper boundary of the sideways trend on the hourly timeframe, ideally from the seller's protection level at 48.17. Alternatively, look for sales below the level of 44.97 in the absence of buyers there.

ORDIUSDT. Looking for salesOn the daily timeframe, there is sideways movement. The bearish vector 7-8 is relevant.
On the hourly timeframe, there is sideways movement. The bearish vector 11-12 is relevant.
I believe that we will see a bearish movement.
Sales should be looked for in the red zones - seller zones (blue zones - buyer zones).
Targets on the hourly timeframe - 61, 60.
Targets on the daily timeframe - 55.2, 49.

EURUSD. Medium-term analysisOn the weekly timeframe, we have a sideways market. The current short-term trend vector is 5-6

EurUsd : Usd Fundamental dominance ⚗️Hello traders.. so yes indeed we did get a very nice push down on EurUsd with CPI data. I put out Short Analyses on Sunday/Monday around Pre-London outlining the fear and market uncertainty that increasing inflation brings into the markets. The inflation reading CPI was expected to rise from 3,2% to 3.4% YoY. The reading came out as 3.5% YoY and we dropped hard on EurUsd. The price action preceding CPI data was suspicious as we had a SHooting star candle last Thursday followed by a hanging man candle on Friday.. caused by strong jobs data. The Monday daily candle this week closed bullish yes, but this candle was less than half the size of the large bullish engulfing candle last wednesday. It was also on a Monday & we still had the rest of the week's price action to observe. On Tuesday , Yesterday, we printed another shooting star candle as we pinned past the previous week's high price. See what I'm seeing here? Then we couple this withg strong USD jobs data last friday and we have many confluences for a decrease in the market. The best part is that you dont even need to hold tthrough news. You can wait until the data comes out and then trade with the momentum on the 1m timeframe.
For the new day of trading, I can observe EurUsd continuing to decrease although we are at a Daily support level 1.07422. This is a rare occasion when I completely okay selling at support lol. This is because of fundamentals and a nice pullback for liquidity early in the month for EurUsd. The first week of April was liquidity. Target for end of week on EurUsd is 1.06882

EurUsd.. End of week Momentum 🕴️Hello traders.. we have the last 2 trading sessions of the week here. The monthly/weekly/Daily are all bearish. 4Hr market structure is bearish and we are creating a new 4hr resistance zone at 1.07261 after this 4hr candles closes in 30 minutes. Today we observed a continuation on EurUsd which was forecasted inadvance on this channel. It was relatively straight forward given the current fundamental backdrop in the markets with strong jobs datta last week and 2 consecutive inflation increases for March and April CPI releases. The large bearish engulfing candle also gave it away.. I really dont want to know who was trading against the trend this week. Anyways we currently have momentum in the market and I believe we will retest the previous daily low at 1.06992 4hr support zone. We outlined this zone in the analysis yesterday as well. We rejected this zone at London close during the New york session today. We reached my short target for the week already.. 1.06992. We have a Daily support level at 1.07086. It's possible we may ignore all level's and drop to the next key level , weekly level 1.06834. We have consumer sentiment for USD forecasted to decrease slightly across the previous data point. The news may act as an catayst to continue dropping or Pullback to end the week. Important levels to watch 1.07261 and 1.07086. Watching how candles interact with these levels.

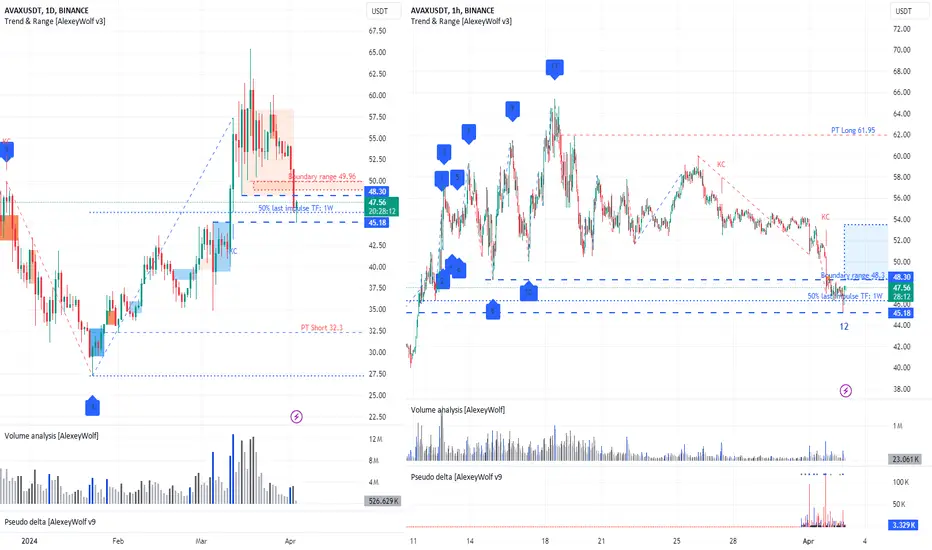
AVAUSDT. We have context for both selling and buying. It's an interesting situation. We have context for both selling and buying.
On the daily timeframe, there's a sideways movement (upper boundary - 49.96). The price has now returned to it, but the daily candle has not yet closed. If the daily candle closes inside the sideways movement, then we can look for sales, and the bearish vector 5-6 with a target at 32.3 will be relevant. There are two threats for the bears along the way in the form of buyer zones (blue background). The first one is at 48.3, which is currently being interacted with. The second threat is the buyer zone with the upper boundary at 45.18.
On the hourly timeframe, the price is at the lower boundary of the sideways movement (48.3). The bearish vector 11-12 has played out. The launch of the bullish vector 12-13 with a target at 61.95 is possible.
In summary, the daily and hourly buyer levels coincide (48.3). If the buyer shows itself at this level, then we can consider buying, taking into account the seller zones on the daily chart (red background). If the seller defends the breakout of the level 48.3, then we can consider selling, taking into account the daily buyer zone (upper boundary 45.18), inside which, by the way, lies 50% of the last daily buyer impulse.
For a more detailed explanation of how to read charts and consider different timeframes when looking for trades, you can refer to the article
AVAXUSDT. On the Daily timeframe, selling takes precedenceOn the daily timeframe, we see a sideways movement with the upper boundary at 49.96. The price has been above the upper boundary for the last 20 days, but yesterday it returned to it and stopped at the 50% level of the last buyer's impulse on the weekly timeframe. This is clearly visible on the hourly timeframe:
At the top, a seller's zone has formed with the upper boundary at 48.3 (red background), and at the bottom, a buyer's zone with the upper boundary at 45.18 (blue background). I anticipate price interaction with the seller's zone of interest. If the seller defends the range of 48-50, we can consider the possibility of sales, and the bearish vector 5-6 will become relevant with a target at 32.3. However, on the way to this target, sellers may be hindered by the buyer's zone, with which there was just interaction and a bullish reaction began, as clearly seen on the hourly timeframe.
On the hourly timeframe, the price is below the lower boundary of the sideways movement at the level of 48.3. The bearish vector 11-12 has already played out, and we can expect the launch of the bullish vector 12-13 with an ambitious target at the level of 61.95 (ambitious, because the buyer will have to overcome the seller's zone on the daily timeframe). To launch the bullish vector, the buyer needs to raise the price above the range of 48-50 and protect it.
For a more detailed explanation of how to read charts and consider different timeframes when looking for trades, you can refer to the article
BTCUSDT. Monitoring the seller's actions.Hello traders and investors!
It's time to update the forecast. During the last review (23/03/2024), we observed a short vector 7-8 within the sideways movement on the daily timeframe. The target of the long vector 8-9 was 72419 (see the chart from the previous review). Currently, the long vector 8-9 has reached this target.
It is advisable to look for sales at the upper boundary of the sideways movement. However, for short positions, the first threat is the buyer zone (blue color) with the upper boundary at 69674, which formed on the daily timeframe. And the seller has not yet shown itself on the hourly timeframe - the price at 17 hours is near the level of 72419.
There is a high probability that the buyer will reach the upper boundary of the sideways movement at 73777. I am waiting for a reinteraction of the price with the level of 72419.
For a more detailed explanation of how to read charts and consider different timeframes when looking for trades, you can refer to the article

BTCUSDT. Short term analysisHello traders and investors!
On the daily timeframe we see a resumption of buyers from the buyer's zone (blue background) with an upper boundary of 69674.
On the hourly timeframe, a sideways trend has formed, where the buyer's vector 4-5 has already reached the obligatory target. Searching for sales is risky because there is a resumption from the buyer's zone on the daily timeframe. It is not systematic to look for purchases at the upper boundary of the sideways.
It is better to look for purchases at the lower boundary of the sideways trend, for example, from the buyer's protection levels at 69071, 67518.
Sales are advisable to look for below the level of 67518 as an idea for implementing the seller's vector 9-10 of the sideways trend on the daily timeframe with the first target at 64493 (second - 60775).
As before, I am waiting for a repeated interaction of the price with the level of 72419.
By the way, purchases could be found yesterday on the 30-minute timeframe (see the chart).

USD bounces back following Strong Jobs Data 🖤The EurUsd Monthly candle is bullish to begin the 2nd quarter and after the first week of Aprils trading. The weekly candle closed bullish as price rejected our key weekly support level 1.0771. The candle left a 40 pips top wick for this weeks candle to go fill in bullish momentum. However, we observed a shooting star candle on Thursday that closed below our 1.0837 Daily resistance level. The friday daily candle dropped and bounced back up after NFP news. Yet, price still managed to close bearish and below our daily resistance level 1.0837. A Shooting star candle followed by a Hanging man candle.. It's early in the month and I still think we can observe some USD strength. How long it will last im not sure.. It's early in the week and a downtrend on the 1hr timeframe back to Friday's low seems possible. We must observe how price acts around the 1.0844 4hr resistance level. Other Key level's include 1.0825 1hr zone, and 1.0805 4hr zone which is our short term target to begin the week here.
We've observed strong jobs data 2 months in a row. March and April releases have both been strong.. this coupled with the fact that CPI is snaticpated to increase from 3.2% to 3.4% this week suggests a healthy consumer spending economy, strong USD. It also suggests more uncertainty regarding inflation because March increased YoY for CPI.. and now April? The fed is going in the opposite direction for it's goals.. Maybe institutions.. it's time to buy the USD safe haven asset of the world?
Weekly timeframe
Still ranging on the monthly timeframe but it appears the monthly candle is pulling up or is this a liquidity move preceding more USD strength.

Has the Market Priced In CPI Data? 🔕As we enter the 5th trading session of the week, The monthly candle and weekly candles are still bullish. The Daily candle closed bullish to begin the week(Monday) and it appears that the market has possibly priced in the not-so-great data forecasted to be released on Wednesday. The Euro went up on a Monday with inflation forecasted to increase for the USD on Wednesday. Maybe we will continue to ascend on EurUsd as the market shrugs off increasing inflation for the USD. This doesnt make sense to me because the USD is a safe haven in times of uncertainty. I'm anticpating that this early push to higher prices early in the week is a discount as the price for EU will be alot lower to end the week(like 1.0805 4hr level or 1.0771 weekly level) And this will be a 2nd consecutive month where inflation increases. The last time we had 2 consecutive months where (USD) CPI increased was September 23' and July 22'. More details below.. make sure to check out the snapshots!
July 22' CPI(for June22') increase for 2 months in a row.. price dropped 100 pips the next day , pulled bac 315 pips the next 19 daily candles before dropping 750 pips across the next 34 daily candles
Sept 23' CPI release (For Aug23') increase for 2 months in a row.. EU went down 280 pips in the next 13 daily candles

USDJPY 💱 // Pre-April CPI ReportHello Traders.. We are taking a look at a different Pair today. The Monthly timeframe and Weekly timeframe really pushing the highs of the range over here. Will CPI be the catalyst to Spaceship us out of the range finally? Or do we still need some more time to gather liquidity and pullback. We pulled back today, Tuesday April 9th, as buyers got gun shy and Sellers took over.
