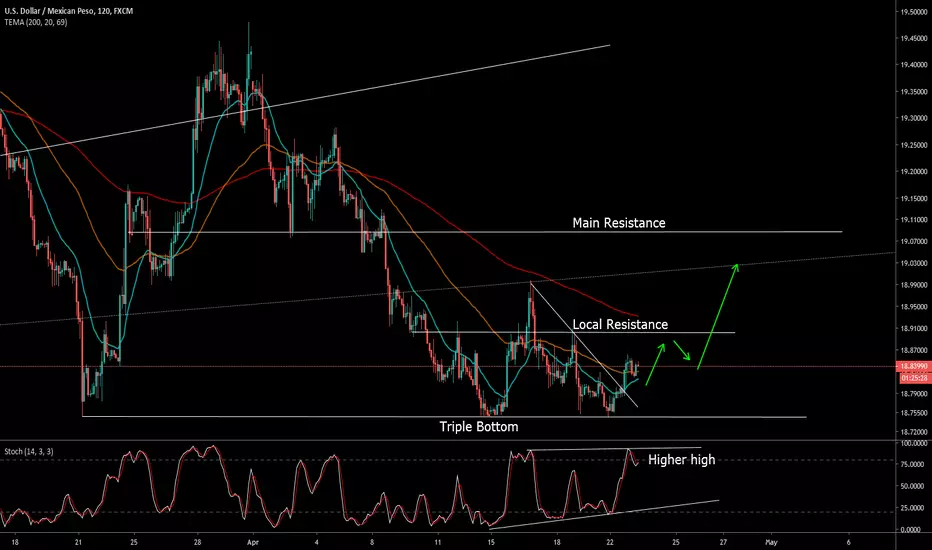
USDMXN - Bullish ReversalUSDMXN has made a triple bottom, with bullish divergence on the stochastics.
Price action looking to retest the local resistance. A break above that should see a test of the main resistance, which is our main target.
Mxn
Equal lows on USDMXN asking to be taken out waiting for comfWe just tested the daily breaker and liq void got filled where USDMXN is now rejecting from.
You could short it here but i prefer some more confirmation so i would like the 4h orderblock to be broken wich will then become a breaker and i will short the retest off that breaker into the equal lows.
Those lows are just to juicy not to be taken as many people their stops our right under there. This is as nice as setups like this get imo.

COTD - 23/04 USDMXNToday we are revisiting the USDMXN Daily chart, in a previous COTD back in February we looked at the Daily price action and what was a potential shorter-term set up (take a look here.
The Shorter-term set-up didn't pan out on the back of a weaker dollar and more exotic shift on the back of this. But as the Dollar films a little bit we are going to revisit as the longer-term set up still stands.
Taking a look at the chart we can see the price is still very much contained between the two trendlines, the one we are more focused on currently is supporting bullish trendline.
As we can see currently, the price is sitting on top of this particular trend line and it looks like we finding some support here, especially as the Dollar Index ticks higher.
Something else of note is the Analyst forecasts for the USDMXN rate throughout 2019. With on average, Analysts forecasting the USDMXN to end the second quarter of 2019 at $19.24 and then on to $19.47 at the end of the third quarter.
FX:USDMXN

USDMXN Back at the powerfull supportWe are back at the support, as a trader I trade in low risk to high reward so for me this is a buy situation.
If it fails to break the support and go up -> WIN
If it breaks support and goes down -> SMALL LOSS
My green zone is a bit higher because of the spread, if you wanna enter a trade wait for it to be ~300.
Cheers everyone have a nice easter!

MXN weakness coming (USDMNX and EURMXN buy)In this speicfic chart, EURMXN has a perfect buy reversal setup with a contraction and 3 Lower Lows within the contraction. This is 1 of the 3 patterns we trade in the PipsMatter community


USD/MXN Looking to go longUSDMXN looks to have a few good opportunities to break small trends and stretch up-ward. If it fails to do so then I believe it will hit a lower low and changing short-term trends
This is not financial advice, or lettuce.

USDMXN INTRADAY - Bearish ContinuationPrice action calls for bearish continuation towards support.
Bearish intraday bias.
USD MXN BUY (US DOLLAR - MEXICAN PESO)Hi there. Price is forming a continuation pattern to the upside. Watch strong price action at the current price for buy.


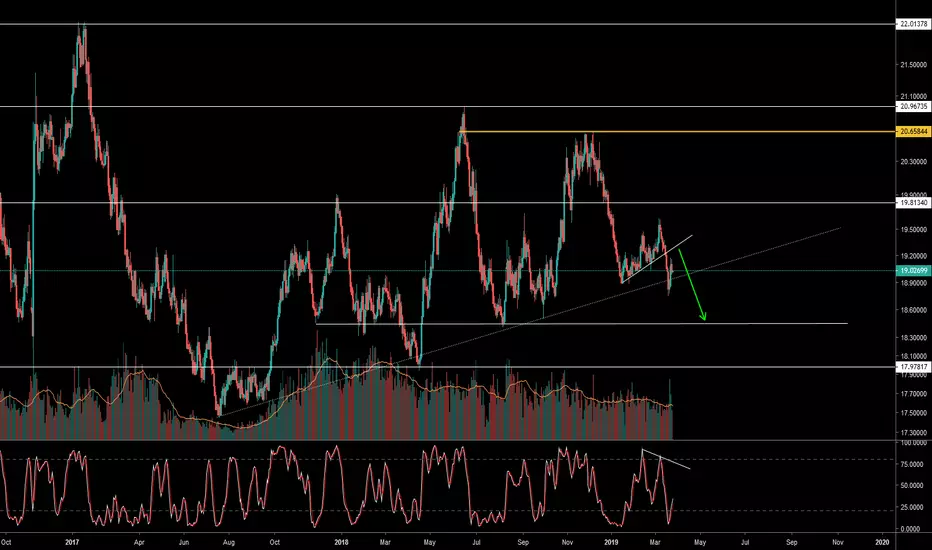
Yearly lows set in place for USDMXNHere we can look from a bird's eye view and see that this is likely still a large triangle taking place.
We are testing the minimum targets of a 5 wave sequence from November highs. It is very possible that this can start forming a base at current levels since the target has been reached however extensions below come in at 18.53.
The likelihood of a base forming will increase if we trade above resistance at 19.20, this will give confidence and unlock 19.47 and 20.4 for initial targets in the triangle.
A very interesting cross to track over the coming Months and Quarters. Best of luck all trading it live.

USDMXN 1:3 Risk Reward ShortUSD Short bias
- quant score = -3 (-10 shift)
MXN Long Bias
- quant score = +39 (+22 shift)
TA
- Short momentum, low breaks

USDMXN: Long term Buy opportunity.The dominant long term pattern on USDMXN is a Triangle on 1M (total neutrality with RSI = 52.546, ADX = 27.968, Highs/Lows = 0.0000). 1D is on a Higher Lows sequence, which this 1M Triangle has show that it leads to a bullish break out. We are long with TP = 20.25000.
** If you like our free content follow our profile (www.tradingview.com) to get more daily ideas. **
Comments and likes are greatly appreciated.
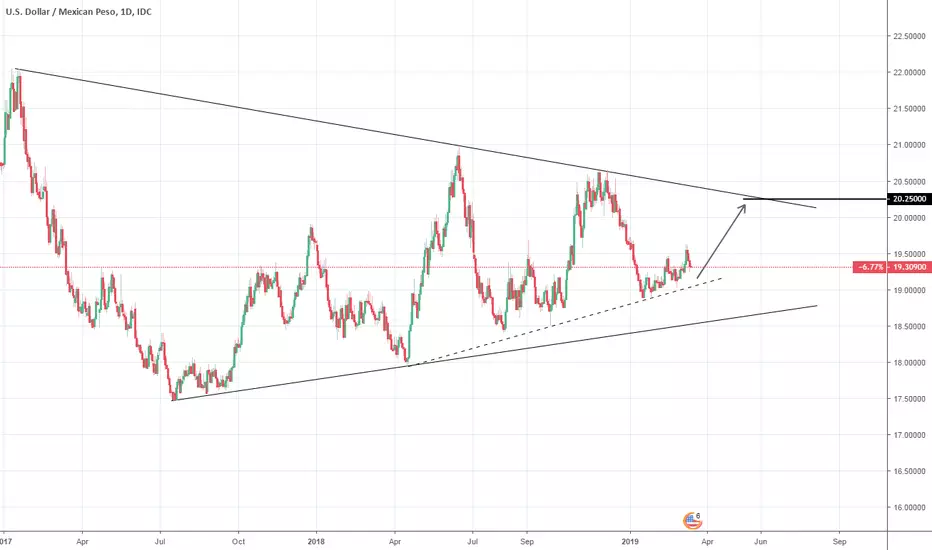


USDMXN Buy signalPattern: 1W Triangle.
Signal: Bullish based on a similar fractal sequence of the Higher Low line.
Target: 20.3500 (Triangle's Lower High at -1.42%).

BRLMXN has plenty of upside...Here we have a very wide ABC in play with the C leg finishing at 7.25 - 7.28.
From a technical perspective, the market has presented a flawless 5 wave impulsive move with a three wave retracement. Those who are betting on the upside will be coming in here at the 38.2% level at 5.09; and we can expect a continuation.
There is scope here for as high as 7.25-7.28... here actively working a lot on the buy side in Brazil.
Best of luck, hope this helps and lets see how it goes.

USD MXN SELL (US DOLLAR - MEXICAN PESO)Hi there. Price is forming a continuation pattern to the downside. Watch strong price action at the current price for sell.

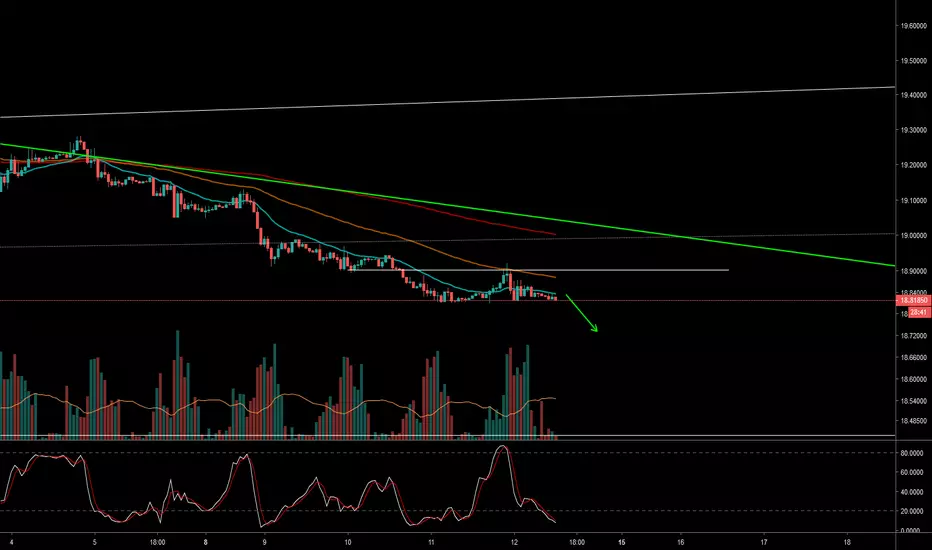
USDMXN breaks SHS neckline, 2000+ pips targetThe support around 19.20 failed to stop the downward pressure in USDMXN, with the pair breaking below the neckline of an SHS pattern.
The pattern suggests a target at around 18.94, but I would prefer to follow a more conservative approach and aim at 19.00 instead, which also aligns with a rising trendline support.

USDMXN BULLISH WAVE COMING USDMXN BULLISH WAVE COMING UP FOLLOWING AN UPTREND CHANNEL ON A D1 TOMEFRAME

USD MXN BUY (US DOLLAR - MEXICAN PESO)Hi there. Price is forming a continuation pattern to the upside. Wait for the price to hit bottom of the pattern and watch strong price action for buy.

USDMXN Double Bottom and inverse H&S?I have been watching this one the past days to see if the double bottom would play out or not. Now the small inverse H&S on the left, could be the confirmation of that pattern. If that neckline breaks and we see a good rally, the chances will increase a lot. If this H&S fails, that green support could still keep it alive, but below that support, it will become less likely.
Previous analysis:
