USDMXN: The Mexican Peso Continues to StrengthenOver the last four trading sessions, the USD/MXN pair has dropped more than 1.5% in favor of the Mexican peso as the U.S. dollar continues to weaken in the short term. The index that measures the strength of the U.S. dollar (DXY) remains consistently below the 100-point level, highlighting the broad weakness of the currency. This has, in part, allowed the current bullish bias of the Mexican peso to persist over the short term.
Downtrend Remains Intact
Since the early days of April, selling pressure has been strong enough to sustain a steady downtrend. However, as the price continues to fall, notable signs of neutrality have started to emerge, which could pave the way for short-term bullish corrections as bearish momentum begins to show signs of exhaustion.
RSI
Lower lows in USD/MXN and higher lows in the RSI have generated a bullish divergence in the short term, suggesting a persistent price imbalance and potential loss of bearish strength in recent sessions. This could open the door for buying corrections to materialize in the upcoming trading sessions.
TRIX
The TRIX line remains oscillating below the 0 level, indicating that the dominant bias over the past few weeks is still bearish. However, if the line continues to flatten, it may signal a possible pause in recent selling momentum.
Key Levels to Watch:
19.24: A near-term indecision zone that may act as a barrier for potential buying corrections.
19.00: A key support level aligned with an important psychological zone. Price movement below this level could provide further room for the current bearish pattern to continue.
19.70: A critical resistance level, corresponding to the highest point of the past two months. A move back toward this area could signal the end of the current downtrend.
Written by Julian Pineda, CFA – Market Analyst
MXNUSD

USD/MXN: The Mexican Peso Faces Strong NeutralityOver the last five trading sessions, USD/MXN fluctuations have shown a variation of barely 1%, indicating the emergence of sustained neutrality in the pair's recent moves. For now, the slight bearish bias in USD/MXN has managed to maintain a steady downward trend, as the Mexican peso benefits from short-term weakness in the U.S. dollar—as shown by the DXY index, which continues to trade below the 100-point mark, highlighting persistent weakness in the U.S. currency.
Potential Downtrend:
Since early April, bearish moves have begun to form a steady downtrend, bringing the price close to the 19 pesos per dollar level. So far, no significant bullish correction has reversed the current selling trend. However, it is important to note that the recent neutral tone could undermine the bearish bias of the past few months. If this neutrality continues, it could give way to a new phase of prolonged sideways trading in the short term.
MACD:
The MACD histogram has been hovering around the 0 line for several sessions, indicating that the moving averages are in a neutral zone, with no clear bullish or bearish dominance. If this pattern persists, the current neutrality could lead to a more defined consolidation range.
RSI:
The RSI line has started forming higher lows while USD/MXN prices have marked lower lows—resulting in a bullish divergence. This could signal room for potential upward corrections in the short term.
Key Levels to Watch:
19.24 pesos per dollar: A current barrier where price action has shown strong neutrality; it could serve as a starting point for potential short-term bullish corrections.
19.70 pesos per dollar: A critical resistance at the highest level the pair has reached in recent weeks. Sustained bullish movement near this zone could mark the end of the prevailing downtrend.
19.00 pesos per dollar: A significant psychological support. Continued bearish moves approaching this level could revive the forgotten bearish sentiment and strengthen the current downtrend line.
Written by Julian Pineda, CFA – Market Analyst

USD/MXN Continues to Fall Below the 20 Pesos per Dollar LevelOver the past five trading sessions, the USD/MXN pair has declined by more than 2%, as the Mexican peso continues to gain ground against the U.S. dollar. This bullish trend in the peso is partly driven by the ongoing weakness in the U.S. dollar, as reflected in the DXY index, which has fallen to 99 points, its lowest level in the past year.
The dollar’s weakness stems from the growing political and economic uncertainty generated by the global trade war, triggering a broad wave of dollar selling as capital exits the U.S. If this trend continues, the Mexican peso could maintain its bullish momentum in the short term.
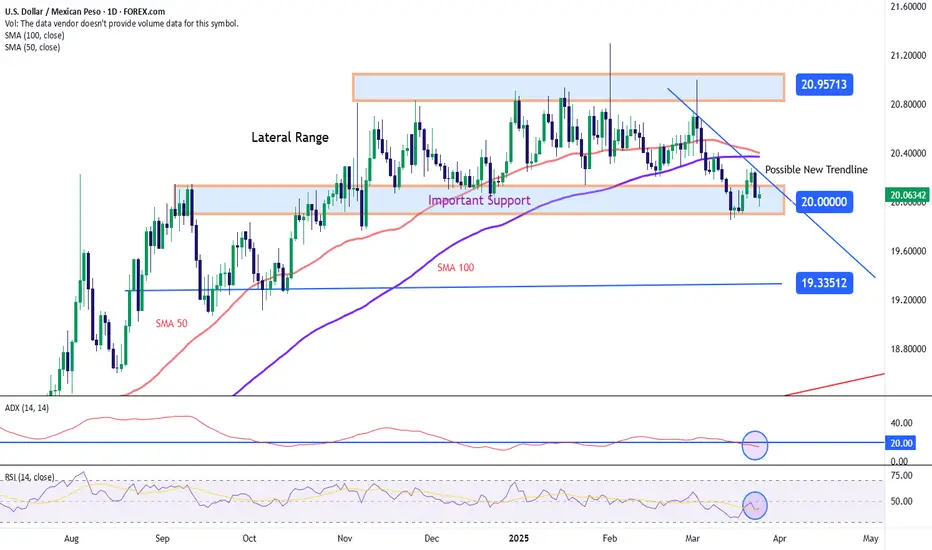
Lateral Range Breakout
Since November 2024, USD/MXN had been trading within a sideways range, with resistance at 20.94 pesos per dollar and support at 20.00. In recent sessions, bearish pressure broke through this support, and as selling momentum builds, this could mark the start of a more meaningful downtrend.
MACD
The MACD histogram remains below the neutral zero line, indicating strong bearish momentum based on recent moving average trends. If the histogram continues to show deeper negative values, selling pressure could intensify further in the short term.
RSI
Currently, lower lows in price and higher lows in the RSI suggest the presence of a bullish divergence—an imbalance in recent selling momentum. This could create an opportunity for short-term bullish corrections to emerge.
Key Levels to Watch:
20.33 pesos per dollar: A key resistance level, aligned with the 100-period moving average. A return to this area could reactivate the previous range.
20.00 pesos per dollar: Another important resistance, now acting as a potential retest zone after previously serving as support. This could be a target for short-term pullbacks.
19.33 pesos per dollar: A significant support level, aligned with the neutral zone from September 2024. A move toward this level could reinforce the consolidation of a consistent bearish trend in upcoming sessions.
Written by Julian Pineda, CFA – Market Analyst

USD/MXN Remains Neutral Around the 20 Pesos per Dollar ZoneOver the past two trading sessions, USD/MXN has maintained a steady neutral movement, showing barely 1% total variation in price. This growing neutral bias has persisted as the market continues to await how a potential trade war could affect the Mexican peso. Recent comments from President Trump suggested that the tariffs may not officially come into effect on April 2, adding to the uncertainty. Major moves in the pair could resume as new updates on the tariff situation emerge in the coming sessions.
Broad Sideways Range:
The pair continues to move within a clear sideways range, between the resistance at 20.95 pesos per dollar and the key support at 20.00. Recent bearish moves have been insufficient to break through this level decisively, leaving the sideways structure dominant in the USD/MXN market.
ADX Indicator:
The ADX line has remained below the 20 level in recent sessions, indicating that recent movements lack the strength to be considered trend-driven. This continues to point to a neutral market environment in the pair.
RSI Indicator:
A similar situation is seen in the RSI, with the line hovering near the neutral 50 level, suggesting that buying and selling pressure remain in balance. For now, this neutrality is helping reinforce the support barrier currently holding in USD/MXN.
Key Levels:
20.95 pesos per dollar – A key resistance level aligned with the recent highs. Sustained buying above this zone could reactivate bullish momentum and lead to a potential breakout from the current range.
20.00 pesos per dollar – The most important short-term support , matching the lower boundary of the broader sideways channel. Bearish moves below this level could lead to stronger downward pressure in the sessions ahead.
19.33 pesos per dollar – A distant support level , located around neutral price zones seen in September 2024. Selling pressure that reaches this level could confirm the beginning of a new bearish trend in USD/MXN.
By Julian Pineda, CFA – Market Analyst
USD/MXN: The Mexican Peso Weakens as New Tariffs Take EffectOver the last three trading sessions, the pair has risen by more than 2% in favor of the U.S. dollar as the threat of tariffs has become a reality. So far, President Trump has confirmed that the measures will take effect today, and there is currently no hope for another deadline extension.
The President of Mexico has traveled to the United States for an official meeting, but at this time, there are no expectations that the measure will be lifted in the short term. Given this, investors have determined that the U.S. dollar is likely the strongest currency to consider, especially if there is a potential economic slowdown in Mexico’s activity in the coming months.
Consistent Sideways Range
For now, USD/MXN remains in a sideways range, defined by a ceiling at 20.91 pesos per dollar and a floor at 20.07 pesos per dollar. The recent bullish momentum has once again tested resistance, and if upward pressure on the U.S. dollar remains strong, it is possible that the sideways channel could give way to an uptrend, which has remained dormant. It is important to note that the latest candlestick in the formation shows strong neutrality, highlighting the barrier imposed by the current resistance level.
ADX Indicator
At the moment, the ADX line has started an upward trend and is now above the neutral level of 20 on the indicator. This suggests that the average of bullish movements in recent trading sessions is becoming trend-defining. However, it is crucial that the ADX line continues to move away from the neutral level to confirm that buying pressure is strengthening in the short term.
Key Levels:
20.91: Major resistance, marking the upper boundary of the broad sideways range and acting as the most critical barrier for the latest bullish move. Breaks above this level could lead to new highs, ending the current consolidation phase.
20.43: Important support, aligning with the Ichimoku cloud barrier as well as the 50 and 100-period moving averages, highlighting the strength of this level. If the price falls below this point, the sideways range could extend further in the coming sessions.
20.07: Final support, positioned at the lowest price levels recorded in December 2024. If the price nears this zone, it could reinforce the bearish outlook, completely invalidating the long-term bullish trend.
By Julian Pineda, CFA – Market Analyst

USD/MXN Nears Critical Support LevelOver the past four trading sessions, USD/MXN has declined by more than 2% in favor of the Mexican peso. The current bearish move has brought the price closer to the lower boundary of the existing sideways range seen on the chart.
This recent selling pressure has been driven by mixed U.S. inflation data released last week and the lack of volatility in the U.S. dollar due to the U.S. holiday, allowing the peso to dominate the market in the short term.
Sideways Range Holds
At the moment, USD/MXN continues to trade within a well-defined neutral range between the 20.90332 resistance level and the 20.09472 support level.
So far, the bearish momentum has been strong enough to push the price closer to the key support zone, and as long as selling pressure persists, there is a higher likelihood of a downside breakout in the short term.
MACD Indicator
Currently, both the MACD lines and the histogram are crossing the neutral 0 level.
This could signal the start of fresh bearish strength if price action remains below this level in the coming sessions.
Selling pressure may gain further relevance as the histogram moves further away from the neutral zone.
TRIX Indicator
For the first time in months, the TRIX indicator is consistently approaching the 0 neutral level , reinforcing bearish dominance in the short term.
If the TRIX crosses below 0, the moving average bias could shift fully bearish, strengthening the peso’s momentum.
Key Levels to Watch
20.90332 – Key Resistance:
Major resistance level, marking the highest price levels reached in recent months.
A return to this level would confirm a recovery of bullish sentiment, reinforcing the current sideways channel.
20.43791 – Near-Term Resistance:
Coincides with the Ichimoku Cloud barrier and the 50-period moving average.
If the price retraces to this level, it could invalidate the current bearish pressure and open the door for a potential upside correction.
20.09472 – Critical Support:
Lower boundary of the current range.
If sellers break below this level, it could confirm the start of a new downtrend in the short term.
By Julian Pineda, CFA – Market Analyst

USD/MXN breaks trend line ahead of Trump speechThe USD/MXN has broken its bullish trend line, and has now moved back below the key 20.500 level. Is this a turn in the tide? The Mexican peso has enjoyed a relief rally along with other risk assets in the last few days, but whether or not it can rise further will depend partly on any new tariff announcements from Trump, and their scale...
Trump's Speech at Davos in Focus: Tariffs and Taxation on the Horizon?
Trump’s highly anticipated address at the World Economic Forum in Davos at 11:00 AM ET is set to grab the market’s attention. Investors will be closely analysing his comments for any further signals on tariffs, economic policies, and international tax matters. While Trump has refrained from imposing blanket tariffs so far, he’s kept the market guessing with his mentions of potential tariffs targeting Canada, Mexico, Europe, and China. However, no firm decisions have been made yet, leaving investors in a holding pattern as they await further clarification on his stance.
Jobless Claims Rise: Softening Signs in the Labour Market?
On the economic data front, US jobless claims came in higher than expected at 223K, up from 217K the previous week, and above the forecast of 220K. This marks the second consecutive week that claims have risen more than anticipated, suggesting a potential softening in the jobs market, at least in the near term. The slight uptick in claims could raise questions about the strength of the labour market and add to market uncertainty as traders await more data and policy direction.
By Fawad Razaqzada, market analyst with FOREX.com

Long on Mexican Pesos: Technical Indicators and Market AnalysisThe Mexican Peso has recently reached a Demand area that we have been monitoring for some time, and it has shown a strong rebound from this level. By examining technical indicators such as the Relative Strength Index (RSI) and Stochastic, we can observe that the Peso is currently in an oversold condition, suggesting a potential upward movement.
Furthermore, by analyzing the Commitment of Traders (COT) data, we see additional support for a bullish outlook. The seasonality trends of the Mexican Peso also align with this perspective, indicating that now is an opportune time to consider a long position.
Given these technical and seasonal indicators, we have decided to open a long position on this futures contract. The confluence of the oversold technical indicators, supportive COT data, and favorable seasonal trends provides a strong foundation for our bullish stance on the Mexican Peso.
✅ Please share your thoughts about Mexican Pesos in the comments section below and HIT LIKE if you appreciate my analysis. Don't forget to FOLLOW ME; you will help us a lot with this small contribution.

LONG - USDMXNPlease use the position tool to guide your entry and/or exit into the position. I will update the idea whenever necessary. Look forward to more profitable trading signals. Happy trading: You're welcome!

MX EXCHANGE TOKEN : INCREASE UPDATEMX the exchange token is shown at the side of the study's new increased volume.
We will follow this coin at last for the next 24H to see if there are new gains that we can follow for the long term.
These updates are daily updates but can change to long-term views if there is a trend building.
We try to scan the best possible coins for the coming times, as trading there will be never a guarantee on any idea or expectation.
The market moves with time, and we should follow it.
Data shows if this coin is able to gain $1.75 then it's an important breakout point
The current price is below $1.36
Since it's an exchange token, we did also study the trend of the exchange.
MX exchange showing also an increase in the volume include users
Depend on your study in more ways, as this is not trading advice.
This is our view about MX for the short term, and if it gets confirmed for an uptrend we will follow it more.

USDMXN | Decrypters | Forecast Hi people welcome to team Decrypters
we are Expecting this week Reversal on USDMXN pair , its on v key level and if we combined this with our previous Analysis of DXY and VIX .The USD pairs should move upside


MXNUSD [16Dec2021]Let's go, we caught the last drop, it is still bearish today, with vol dropping. and the lower high.
This may come to fruition next week, so this week I'll be looking into opening positions at the right place.
Goodluck
Redd

MXNUSD [14Dec2021]Followup to the plans (below). If you followed you have nice short entries running right now.
I bagged some profit yesterday, and the bearish trend is still strong with DXY showing short term weakness in its bullishness. We might get MXN at the top end of the range soon, looking forward to shorting this again.
Good luck
Redd

MXNUSD [13Dec2021]Background bearish signal is getting stronger as it is approaching the top end of the range. Volatility is still notably high and it is decelerating. Usually this happens when approaching the top end of the range due to volume balancing.
I will wait to short more at the top of the range.
Good luck out there
Redd

MXNUSD [10DEC2021]Follow up to the yesterday's plan (link below).
Vol is slowly dropping and the price is getting closer to the top end of the range. I will look into shorting incrementally. And the plan might come to fruition next weeks, let's see how this goes
Redd

MXN/USD 2021 Six months evolutionUSD quotation in terms of Mexican Peso 2021. Six months of history.
OANDA:USDMXN

USDMXN - Peso technical viewUSDMXN - Peso trade idea.
Technical View
Pattern - Triple Bottom
Support - 19.93810, 19.85110, 19.81000
Resistance - 20.09215, 20.21170, 20.31620
50 EMA - key support zone
200 EMA - Key Resistance zone
EM Currency pair - PESO yields had a nice move... We could extend further to 1.618 area!
Key tip: Trade your own trade plan for further confidence
Trade Journal
Just a trade idea, not a recommendation

Emerging Currencies Making a Recovery??As we zoom out and look closely at the Mexican Peso, we see many signs of strength that have been building for some time now. I believe the MXN and many other emerging currencies are all showing similar signs of strength and in the process of a reversal. While this may provide a great long trade and a short-term boost to the Peso, I fear it will have long-term negative effects.
These are the things that lead me to continue to believe the dollar will continue to devalue. Emerging market currencies have consistently gained strength against the dollar. If the Peso closes above the 13-year historical resistance by the end of this month, it will be a decent confirmation of a trend change. Unless we see some BIG power moves come from the dollar, I believe this is likely to continue. Not to put to be dramatic, but "IF" this does play out, it will be VERY difficult and drastic for most people's current financial circumstances in the U.S. If the US dollar loses that much purchasing power in relation to the rest of the world, it will affect people in many ways. If it now costs most companies a certain amount to purchase products, then the stores in the US will raise their prices significantly, at least to make up for the lost purchasing power, which means many will have to settle with less to provide for themselves. This may seem good for the emerging currencies and their economy in the short term, but I believe we are seeing a global financial shift that will affect everyone negatively, not just the U.S. economy.
The U.S. produces very little in comparison to the rest of the world, so we will suffer because of this. IMO, the U.S. has sat on its laurels of being the biggest economy far too long, and it's caused us to have an economy that is far too reliant on other countries because we "had" the money to pay for cheap labor. I believe the U.S. will suffer a great financial loss because of our short-term approach and being far too prideful because we had more financial liberties compared to others. Essentially, The U.S. became conceited... This money printing has seriously backed us into a corner. Very similar to many ancient empires in the past. I honestly hope I'm wrong about this, the effects of this kind of macro shift could be devastating for many. When things like this happen, it's typically best to look into hard assets like Gold/Silver and even Bitcoin. Please don't take my brutal honesty the wrong way, but I believe it's important to see the global shifts that are in place and consider taking the proper precautions. We're entering uncharted territory for the global economy and this will likely create unstable conditions for all.

MXNUSD - LONGGoing long on this pair short term before we start to look at short opportunities to the downside.

EUR/MXN - Opportunities! Technical outlook towards EUR/MXN
We were messaged to analyse this pair, since we last looked at this pair was July - Great momentum it has had. It was 1hr chart this time, I am going through daily - Why?
***Higher time frame indicates shorter time frame of movement! ***
Technical outlook:
Pattern wise - we are being squeezed within price action of a triangle formation but within that we do have a smaller bullish flag occurring which if you go through 4 hr it hasn't broken towards upside yet and we are at support of this pattern.
Shorter Trade Plan: Going towards 4hr you could add Fibs retracement and the target for this bullish flag would be 26.52767 and that's the resistance of this formation as well as top of the range is has been for while. (Following the pattern and inner small flag pattern) For further confirmation a close above 50 EMA.
Longer term trade plan: You could play the shorter role of the 4hr and even 1hr following the channel down or break out- However, longer term looking at the daily you could wait for a break to either direction, adding alert to resistance and support areas of the pattern, which ever way it breaks from the yellow arrows draw, I have measured the pattern length. On patterns I like to make sure it's a real break of the range so I would wait for break out , get in on the pull back and then take the trade to whichever direction it goes towards.
Keep in mind - MXN is an EM currency, if you are interested to look more in depth an advanced view look at MSCI.
(Just a trade idea, not a recommendation)
All the best,
Trade Journal

USDMXN - Peso - Which way?!The EM currencies aren't moving as much considering the major pairs are...that's an interesting thought to keep in mind!
If you're looking for good risk reward trade, i'd go to EM currencies - Major pairs are little over extended. However, for those swing traders PESO looking clean...which way will it break. Will we carry on the pattern of descending channel? Will we reach the retracement Fibonacci 161.8 target? OR will we head higher out of channel and go towards the resistance areas?
Add alerts or orders for whichever direction you feel its breaking out to. Remember, we've had a lot of dollar weakness.
This is just a trade idea, not a recommendation.

USDMXNTriangle forming ... we could break out and retest to the upside but i have stops in place to catch the sell
