Potential outside week and bullish potential for MYREntry conditions:
(i) higher share price for ASX:MYR above the level of the potential outside week noted on 6th September (adjusted with the incidence of the inside week the following week, allowing activation of the trade above the level of the range for that week, i.e.: above the level of $0.855, as depicted by the blue dotted line and accompanying text on the chart).
Stop loss for the trade would be:
(i) below the swing low of 4th September (i.e.: below $0.795), should the trade activate.
MYR
MYR swing long, targeting next levelMYR is in a strong weekly uptrend and has had a recent strong impulse move followed by tight consolidation right below a major weekly anchor to the downside.
Aggressive entry has likely already passed a few days ago, so waiting for the BO which adds confirmation, then getting in on the pullback targeting next level.
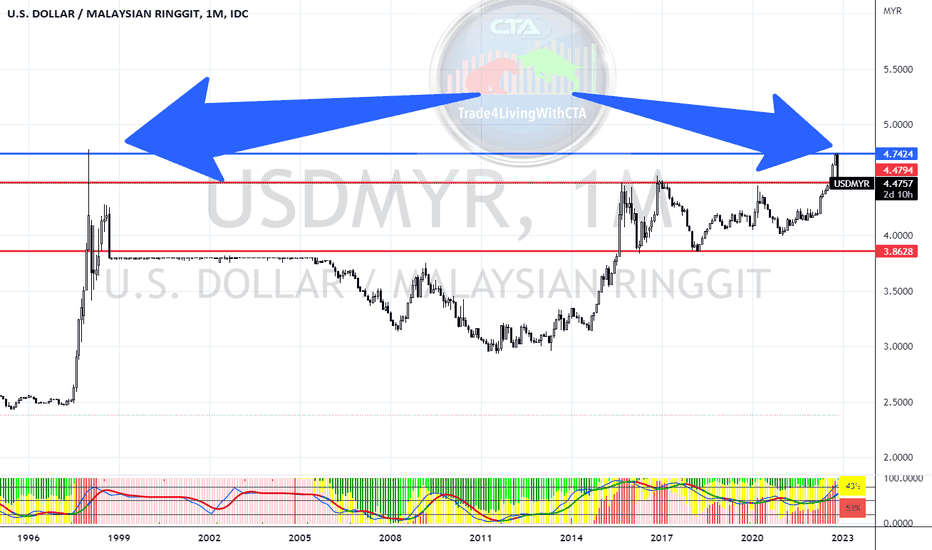
USDMYR Simple Chart AnalysisUSDMYR - This chart can use to monitor our country economy too, hopefully the double top here can indicate that our MYR can continue to be strengthen under the unity government.
How to view the guidance via chart ( Refer back to pin message guidance if to trade )
Red Line = Support
Blue Line = Resistance
Light Blue = bullish/bearish pattern
Arrow = Double/Trip top/bottom
Red Chip = $$
Green Chip = XX
ETHMYR Showed a Trend Reversal and is entering DOWNTRENDThe upward movement failed to reach resistance 3 hence price will try and retest support line. If price passed support line then ETH is now entering downtrend .
There's possible uptrend still if price passed Resistance 3, that will be another buying opportunity.
XRP - How Now Brown Cow? (Learning Notes #9)Hello Traders,
I am currently learning Technical Analysis , and the ideas I post are what I call ("Learning Notes").
Comments on my analysis are very much welcome and will be greatly appreciated.
Let us learn together, and grow together to be a better trader!
Sincerely,
Kenneth Lee
Disclaimer:
This is not a buy/sell recommendation, nor should it lead to any market actions and/or activities. Trade at your own risk.
Is it a good time to enter XRP? (Learning Notes #5)Hello Traders around the World and Malaysia,
I am currently learning Technical Analysis, and this analysis is what I call ("Learning Notes").
Any sort of constructive comments on my analysis are very much welcome and will be greatly appreciated.
Let us learn together, and grow together to be a better trader!
Sincerely,
Kenneth Lee
This is not a buy/sell recommendation. Trade at your own risk.
Select Asian Currencies vs Inverse DXY, recent trends & past 10yThe inverse of the US Dollar Index DXY versus select Asian currencies of Japanese yen JPY, Korean won KRW, Singapore dollar SGD, Malaysian ringgit MYR, Thai baht THB, Philippine peso PHP - note recent trends against trends over the last decade.
MYRUSD Strengthen| The downturn of Dollar is begin| 3rd May 2020"When the steam is not there for the Dollar,
we buy our own currency Ringgit..especially KLSE"
-Zezu Zaza, Webinar 1st May 2020
The selling in Dollar last week is a one of example of mechanism of retracement.
As we can see, Ringgit is strengthen this week. This week is a bullish potential sign
has started.
Half of our sector industries will be open today 04th May 2020. The opening of the
sector will rise the Ringgit in the short term. It is a slow volatility but safe.
The subsidy or Bantuan Prihatin Nasional will be credited to your bank account by today
for the second phase. Please let me know if you want me as your financial advisor for
your Ringgit trading or Bursa Saham trading.
I am buying Ringgit for next whole week. Starting today Monday will open a buy position.
What is the target? I will tell the exact price on where the Ringgit will headed on my
web page subscription for the signal.
Regards,
Zezu Zaza
2048
USD bearish against MYRIn a monthly time frame, it is clear that the pattern forming descending triangle and forming double top inside the major pattern. Although the major trend
still uptrend, but the price move near the support line with the RSI 40%.
After breakout double top pattern, the price might be pullback to the breakout point and wait for bearish price action to short, thus, set the 1st TP @ 3.8556, 2nd TP @ 3.7364, 3rd TP @ 3.5567.
In terms of fundamental, USD bearish due to few crisis such as US-IRAN war and US-China Trade War.
DISCLAIMER: THIS IS OPINION BASED ON MY PERSPECTIVE. FOLLOW AT YOUR OWN RISK.


