MYRO/USDT Testing Key Support – Breakout or Breakdown?📊 Complete and Relevant Chart Analysis:
The MYRO/USDT pair is currently in a consolidation phase after experiencing a medium-term downtrend. Several key technical elements can be observed in this chart:
---
🟡 Support Zone (Demand Area):
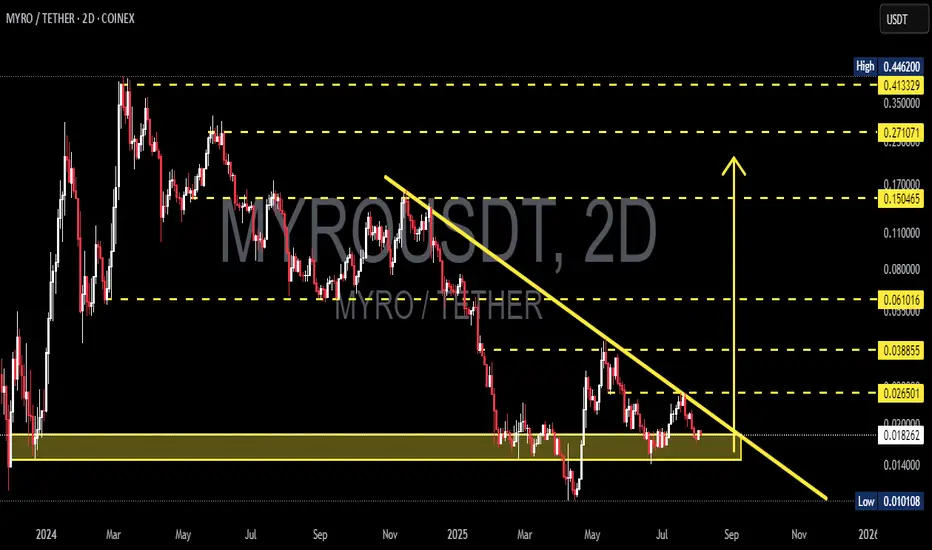
Price is now sitting at a strong support zone (yellow box), ranging around $0.014 – $0.018, which has been tested multiple times throughout 2024–2025.
This zone serves as a potential accumulation base and could act as a springboard for a reversal.
---
📉 Descending Trendline Resistance:
A dominant descending trendline from the November 2024 high continues to suppress the price.
The price has yet to break above this trendline, indicating sellers are still in control on the medium-term timeframe.
---
📈 Key Resistance Levels:
Based on previous structure and potential retracement targets:
$0.026501
$0.038855
$0.061016
$0.150465
$0.271071
---
📉 Nearest Support Levels:
$0.018287 (current price)
If price breaks down below this zone, it may drop toward $0.014000 or even $0.010108 (all-time low)
---
🧠 Pattern & Structure:
A clear Descending Triangle pattern is forming, typically a bearish continuation. However, as price nears the apex and holds the support zone, this could also signal a potential reversal setup.
Volume confirmation will be crucial if a breakout occurs.
---
🚀 Bullish Scenario:
1. Price bounces off the strong support zone and successfully breaks the descending trendline with solid volume.
2. Targets on the upside include:
$0.0265 (minor resistance)
$0.0388
$0.0610 (psychological and technical level)
---
🔻 Bearish Scenario:
1. If price fails to hold above $0.018 and breaks down from the yellow support box:
A drop toward $0.0140 is likely, with potential extension to $0.0101.
2. Increasing selling pressure and low volume on the bounce would strengthen this bearish outlook.
---
🎯 Conclusion:
MYRO/USDT is at a critical juncture, testing a major support level and nearing the end of a descending triangle. The next movement will determine whether we see a bullish breakout or a continuation of the bearish trend.
#MYROUSDT #CryptoAnalysis #AltcoinSetup #SupportResistance #BreakoutTrade #DescendingTriangle #TechnicalAnalysis #CryptoSupport #ReversalPattern #CryptoTrading
Myrosignal
#MYRO/USDT. LONG?#MYRO
The price is moving within a descending channel on the 1-hour frame and is expected to break and continue upward.
We have a trend to stabilize above the 100 moving average once again.
We have a downtrend on the RSI indicator that supports the upward break.
We have a support area at the lower boundary of the channel at 0.016650, acting as a strong support from which the price can rebound.
We have a major support area in green that pushed the price upward at 0.01600.
Entry price: 0.01666
First target: 0.01750
Second target: 0.01837
Third target: 0.01955
To manage risk, don't forget stop loss and capital management.
When you reach the first target, save some profits and then change the stop order to an entry order.
For inquiries, please comment.
Thank you.

#MYRO/USDT#MYRO
The price is moving within a descending channel on the 1-hour frame, adhering well to it, and is on its way to breaking it strongly upwards and retesting it.
We are seeing a bounce from the lower boundary of the descending channel, this support at 0.0350.
We have a downtrend on the RSI indicator that is about to break and retest, supporting the upward trend.
We are looking for stability above the 100 Moving Average.
Entry price: 0.03739
First target: 0.03940
Second target: 0.04145
Third target: 0.04421

#MYRO/USDT#MYRO
The price is moving in a descending channel on the 1-hour frame and is expected to continue upwards
We have a trend to stabilize above the moving average 100 again
We have a descending trend on the RSI indicator that supports the rise by breaking it upwards
We have a support area at the lower limit of the channel at a price of 0.0307
Entry price 0.0330
First target 0.0340
Second target 0.0356
Third target 0.0374

MYROUSDT 2D AnalysisMYRO ~ 2D Analysis
#MYRO Buy back on retest of this support block with short term target of at least 20%+ from this support.

MYROUSDT 3D AnalysisMYRO ~ 3D Analysis
#MYRO This trade is very high risk
Buy gradually from here with a short term target of at least 15%+, long term target $0.2 - $0.4

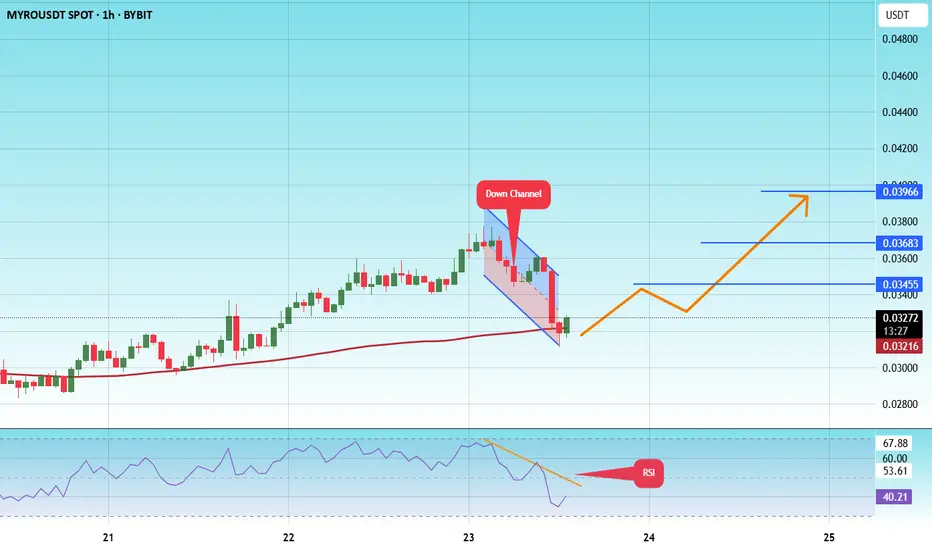
#MYRO/USDT#MYRO
The price is moving within a descending channel on the 1-hour frame and is expected to break and continue upward.
We have a trend to stabilize above the 100 moving average once again.
We have a downtrend on the RSI indicator, which supports the upward move by breaking it upward.
We have a support area at the lower limit of the channel at 0.03110, acting as strong support from which the price can rebound.
Entry price: 0.03280
First target: 0.03455
Second target: 0.03683
Third target: 0.03966
#MYRO/USDT#MYRO
The price is moving in a descending channel on the 1-hour frame and is adhering to it well and is heading to break it strongly upwards and retest it
We have a bounce from the lower limit of the descending channel, this support is at a price of 0.01670
We have a downtrend on the RSI indicator that is about to break and retest, which supports the rise
We have a trend to stabilize above the moving average 100
Entry price 0.01920
First target 0.02133
Second target 0.02133
Third target 0.02267

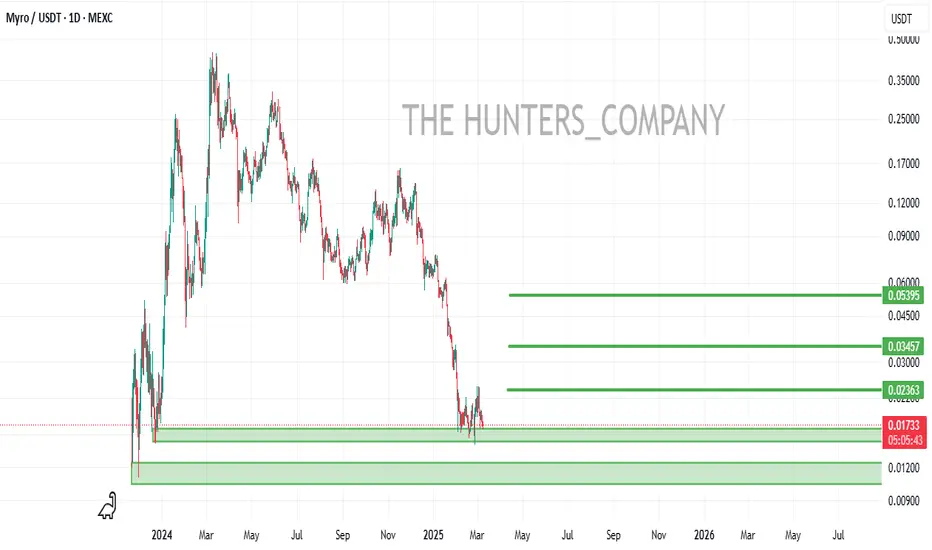
MYROUSDT 2DMYRO ~ 2D Analysis
#MYRO This trade is very high risk. Buy from here with a short -term target of at least 15%+.

MYRO BUYHello friends
Due to the price correction, we are now at the bottom of the price and are on important support.
You can buy in steps according to the specified ranges.
We have also specified price targets for you.
*Trade safely with us*
MYROUSDT 2DMYRO ~ 2D Analysis
#MYRO This trade is very high risk, But if you still have a Conviction in this coin, the price increase of 20%+ is not too difficult from here.

#MYRO/USDT Ready to go higher#MYRO
The price is moving in a descending channel on the 1-hour timeframe and sticking to it well
We have a bounce from the lower limit of the descending channel, this support is at 0.0365
We have a downtrend on the RSI indicator that is about to break, which supports the rise
We have a trend to stabilize above the moving average 100
Entry price 0.0391
First target 0.0415
Second target 0.0464
Third target 0.0521

#MYRO/USDT#MYRO
The price is moving in a descending channel on the 4-hour frame and is expected to continue upwards
We have a trend to stabilize above the moving average 100 again
We have a descending trend on the RSI indicator that supports the rise by breaking it upwards
We have a support area at the lower limit of the channel at a price of 0.0582
Entry price 0.0669
First target 0.0779
Second target 0.0897
Third target 01020

MYROUSDT 3DMYRO Update ~ 3D
#Myro Retesting this support block,. If you still have Conviction on this coin,. This support block would be a very good buy spot for now. buy in stages with a minimum target of 20%+

MYROUSDT 3DMYRO ~ 3D
#MYRO So far it continues to maintain this support level. If you still have Conviction on the coin,. Buy in stages from here. with a minimum target of 20%+
#MYRO/USDT#MYRO
The price is moving in a descending channel on the 4-hour frame and is sticking to it well
We have a bounce from the lower limit of the descending channel and we are now touching this support at 0.0960
We have a downtrend on the RSI indicator that is about to be broken, which supports the rise
We have a trend to stabilize above the moving average 100
Entry price 0.1030
First target 0.1146
Second target 0.1229
Third target 0.1325

MYROUSDTMYRO ~ 3D
#MYRO This support block is a great time to buy gradually. With a short term target of at least 20%++

MYROUSDTMYRO ~ 3D Update
#MYRO Very clearly, a break of this resistance line will confirm that bullishness is coming quickly.

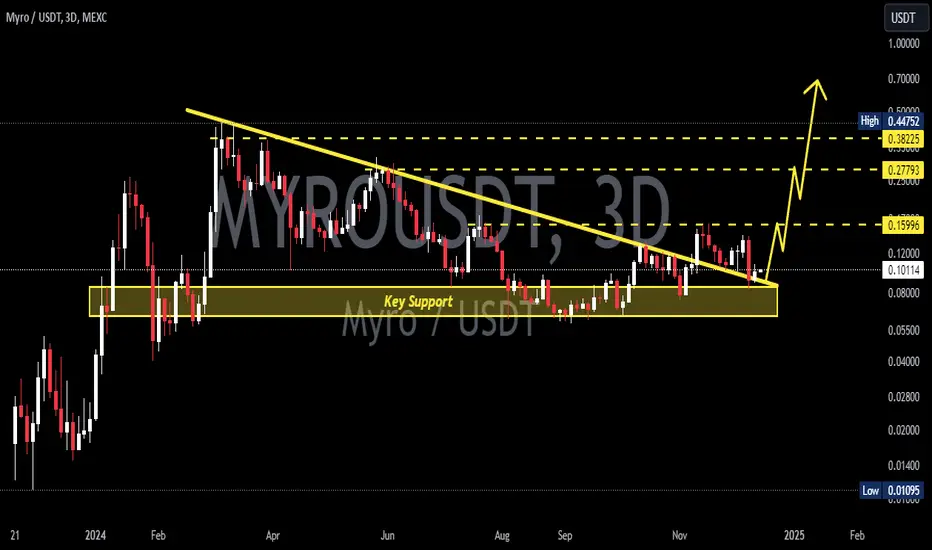
MYRO has good signals for continuing the bullish movementAfter reaching the support area, the price has a good upward movement and is in a good position to climb, the downward trendline is breaking and after closing the candle above the trendline, it can be ready for growth.
Targets that can be touched in the future: 0.16800 - 0.28000 -0.3800
Support range: 0.05700 - 0.06600
✨We spend hours finding potential opportunities and writing useful ideas, we would be happy if you support us.
Best regards CobraVanguard .💚
_ _ _ _ __ _ _ _ _ _ _ _ _ _ _ _ _ _ _ _ _ _ _ _ _ _ _ _ _ _ _ _
✅Thank you, and for more ideas, hit ❤️Like❤️ and 🌟Follow🌟!
⚠️Things can change...
The markets are always changing and even with all these signals, the market changes tend to be strong and fast!!
