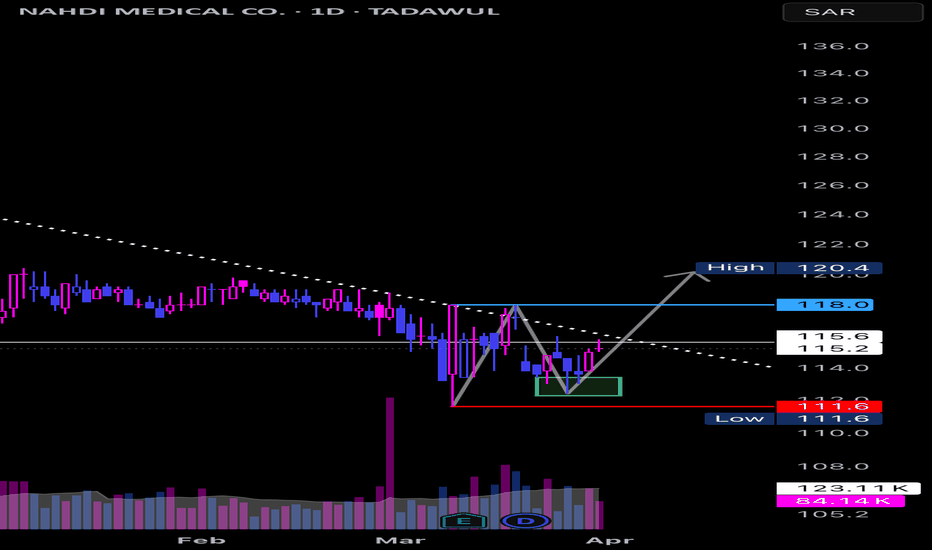
Nahdi Medical Co. (4164) - False Breakdown & Trendline Breakout?🚨 Nahdi Medical Co. (4164) recently experienced a false breakdown below 115.6, but has since recovered above it. With the stock now testing a downward trendline, crossing this line could signal the start of a new upward move. 📈
💡 Key Points:
• Current Price: 115.2
• False Breakdown at: 115.6
• Key Resistance at: 118
• Support/Stop Loss: 111.6
• Target: Potential upward swing after breaking 118
📊 Technical Analysis: The false breakdown below 115.6 followed by a recovery signals a potential bullish reversal. If the stock breaks the downward trendline and crosses above 118, it will confirm a new upward swing.
📈 Trade Strategy: The price range between 111.6 and 118 is an ideal buying zone. A breakout above the downward trendline and 118 will confirm the start of a new upward wave. Enter with a stop loss at 111.6, and if 118 is breached, expect the rally to continue.
What are your thoughts on Nahdi Medical Co.’s price action? If you think I missed something or see a different pattern, feel free to share!🔥
Nahdi
🟢 4164 NAHDI 🟢NO LIQUDITY SWEAP NO ENTRY.
STRUCTURE IS CHANGING ANYTIME.
EVERY CANDLE HAS LIQUIDITY.
PRICE ALWAYS NEED LIQUIDITY.
Nobody Knows Where is Price Going.
Hey traders, here is the analysi.
If you guys like my analysis please hit like?? and follow.
Thanks.
SMART MONEY CONCEPT.
identify Liquidity Or Become Liquidity
DISCLAIMER- This is not financial advice.


