Gold 31 July – Bearish Bias Holds, Watching Supply ZonesGold (XAUUSD) Analysis – 31 July
Market structure is now aligned across both higher and lower timeframes:
H4: Bearish
M15: Bearish
This alignment strengthens the probability of trend-continuation setups in favor of the dominant downtrend.
🔄 Current Market Behavior:
The M15 chart is currently in a pullback phase, retracing toward its previous lower high and approaching a key supply zone.
📍 Key Supply Zones to Watch:
Zone 1 – Immediate Supply Zone (3299 – 3305)
• First area of interest where price may react.
• If respected and followed by M1 confirmation, a short setup could be initiated.
• Watch for signs of exhaustion or sharp rejection.
Zone 2 – Higher Supply Zone (3326 – 3332)
• If the first zone fails, this becomes the next high-probability area.
• Well-aligned with the broader bearish structure — expect stronger reaction potential.
• Suitable for cleaner high RR short trades if price reaches this level.
✅ Execution Plan:
• Observe how price behaves inside the marked zones.
• Only plan short entries after M1 confirmation — this adds precision and prevents premature entries.
• Stay patient. Let the market come to you and reveal intent before acting.
📌 Summary:
Bias: Bearish
Structure: H4 and M15 both support downside bias
Zones in Focus:
– Primary: 3299–3305
– Secondary: 3326–3332
Execution: Wait for confirmation before entering.
Risk-Reward: Maintain 1:3 RR minimum (e.g., 40 pip SL, 120 pip TP).
Let the structure guide your setups — not impulse.
📘 Shared by ChartIsMirror
Nakedchartanalysis

What Is Naked Forex Trading, and How Do Traders Use It?What Is Naked Forex Trading, and How Do Traders Use It?
Traders rely on various tools and techniques to trade the forex market. Naked forex trading is one of the oldest and most popular trading approaches among currency traders. This article delves into the details of naked trading, providing insights into its implementation and distinguishing features that set it apart from other analysis techniques.
Understanding Naked Forex Trading
Naked trading is a trading style that involves analysing markets using a clean price chart, meaning one without technical indicators. Traders who use this method make decisions based on real-time price movements and their trading instincts.
Naked trading has its roots in the early days of trading, long before the advent of sophisticated technical analysis tools and indicators. Early traders relied solely on price action and market behaviour to make trading decisions. By stripping away the complexity of modern trading tools, naked trading aims to return to the fundamental principles of trading, emphasising the importance of understanding market psychology and price dynamics.
Core Principles of Naked Forex Trading
Naked forex trading is based on the following principles:
- Price action analysis is the foundation of naked trading, focusing on the examination of asset price movements without the help of technical indicators. Traders rely on bar, line, or Japanese candlestick charts to identify patterns, trends, and key support and resistance levels. By concentrating on real-time price movements, traders aim to make their trading decisions based on how prices behave at specific levels.
- Naked trading emphasises simplicity and clarity as it removes the clutter of numerous trading tools. This approach helps traders maintain a clear view of the market, making it potentially easier to identify trading opportunities. The simplification also reduces cognitive load, enabling traders to focus on the most critical market movements.
- Trader instinct, often referred to as "gut feeling" or "trader's intuition," plays a significant role in naked trading. This instinct is honed over time through experience and the extensive observation of price movements and market behaviour.
Key Techniques and Tools
Mastering price action analysis is crucial in naked trading. These are the four key tools for those who use naked trading.
Candlestick Patterns
Candlestick patterns play a crucial role in naked trading strategy by providing visual representations of price movements over a specified period. Traders look for different price formations to analyse potential market reversals, continuations, or indecisions. Common candlestick patterns include doji, engulfing patterns, hammer, shooting star, and spinning top. Each offers insights into market sentiment and potential future price movements.
Chart Patterns
Chart patterns on price charts indicate potential trend reversals or continuations. Traders using naked trading techniques rely on chart patterns like flags, rounding top/bottom, diamonds, and rectangles to identify key levels where the price is likely to react. These patterns help traders anticipate market movements and plan entry and exit points accordingly.
Support and Resistance Levels
Support and resistance levels are fundamental concepts in naked trading, representing levels the price struggled to break above (resistance) or hold above (support). Traders identify these levels on price charts to anticipate potential price reversals or breakouts. Support and resistance levels are crucial for setting profit targets, placing stop-loss orders, and managing risk.
Trendlines and Channels
Trendlines and channels are used by naked traders to visualise the direction and strength of a trend. Trendlines connect successive higher lows (uptrend) or lower highs (downtrend) on a price chart, helping traders identify trend reversals or confirm trend continuations. Channels are formed by drawing parallel lines to connect highs and lows, creating a channel in which the price typically moves.
Advantages of Naked Forex Trading
Naked trading has many advantages; therefore, it’s still used by traders around the globe. Here are the key benefits of naked forex trading:
- Enhanced Focus and Simplicity: This approach removes market clutter as it offers enhanced focus by eliminating complex technical indicators. Without the distraction of multiple indicators that provide lagging signals, traders may respond more effectively to changes in price movements.
- Improved Market Understanding: By relying on naked trading tools, traders may better understand market behaviour and psychology. Observing price action directly on charts potentially enhances traders' ability to interpret market sentiment, identify key support and resistance levels, and anticipate potential trend reversals or continuations. This hands-on approach fosters a deeper understanding of the nuances of the market and improves trading skills over time.
- Flexibility and Adaptability: Traders are not constrained by specific indicator signals or rigid trading rules. Instead, they can adjust their approach based on real-time price action and evolving market dynamics. This flexibility allows them to take advantage of emerging opportunities and adapt their strategies to potentially mitigate risks.
Challenges and Limitations
Although naked trading can be effective, it has limitations that a trader considers before relying on this approach.
- Learning Curve: As naked forex trading relies heavily on interpreting price action without the assistance of technical indicators, traders may need to dedicate considerable time and effort to mastering candlestick patterns, chart analysis, and understanding market psychology. Developing the skill to interpret price movements accurately demands persistence and consistent practice.
- Emotional Discipline: A notable challenge of naked trading is the absence of clear buy or sell signals provided by indicators, which can lead to heightened emotional responses to market fluctuations. Traders must maintain discipline by adhering to their trading plans, implementing risk management strategies, and avoiding impulsive decisions.
- Market Noise: Navigating market noise is another hurdle in naked trading. Market noise refers to random price fluctuations that obscure meaningful price patterns. Traders need the patience and experience to distinguish between significant price movements and temporary fluctuations.
Practical Application of Naked Forex Trading
Setting up a trading plan is essential for implementing naked forex trading. Traders might use the following rules:
- Define Your Trading Goals: Determine your financial objectives, risk tolerance, and period of trading.
- Select Currency Pairs: Choose currency pairs that align with your trading strategy and offer sufficient liquidity.
- Identify Key Trading Times: Determine optimal times to trade based on market volatility and your availability.
- Establish Entry and Exit Rules: Define criteria for entering trades based on price action signals, such as candlestick patterns or support/resistance levels. Similarly, rules for exiting trades should be established to potentially lock in returns or cut losses.
- Risk Management: Implement risk management strategies, including setting stop-loss orders and calculating position sizes based on your risk tolerance and account size.
- Review and Adapt: Regularly review your plan to assess its effectiveness and make necessary adjustments based on evolving market conditions and personal trading performance.
Real-Life Examples and Case Studies
Real-life examples and case studies illustrate how naked forex trading principles are applied in practice:
Example 1: Trading Support and Resistance
A trader identifies a currency pair approaching a key support level on the daily chart. They wait for a bullish reversal candlestick pattern, such as dragonfly doji, to form near the support level. They enter a long trade with a stop-loss below the support level and a profit target at the next resistance level.
Example 2: Trend Confirmation
A trader observes a currency pair in a strong downtrend on the hourly chart. They wait for a pullback to a trendline and look for a bearish engulfing pattern to confirm the continuation of the downtrend. They enter a sell trade with a tight stop-loss above the trendline. However, it is difficult to determine the profit target as there are no swing lows nearby.
The Bottom Line
When they understand the naked trading forex strategy, traders may use it in other markets, including stocks and cryptocurrencies*. However, it's important to note that any analysis does not guarantee effective trading, and other factors should be considered alongside chart analysis. Risk management and a proper mindset are essential for long-term consistency.
FAQs
What Is Naked Trading in Forex?
Naked, or price action trading, is a forex trading approach that involves analysing the market using a clean price chart without any technical indicators. Traders relying on this method make decisions based on real-time price movements and their trading instincts rather than past performance. The strategy emphasises identifying key support and resistance levels, trend reversals, and price corrections purely through the observation of bar, line, or candlestick charts.
Can I Trade Without Chart Patterns?
Yes, trading without chart patterns may be possible using alternative methods such as indicator-based strategies, quantitative models, fundamental analysis, or sentiment analysis. These approaches allow traders to analyse the markets based on technical indicators, mathematical algorithms, economic data, or market sentiment.
What Is a Chart Pattern in a Price Action Strategy?
A chart pattern in a price action strategy refers to the specific formations and shapes created by the price movements of an asset, which traders use to analyse future market behaviour. These patterns emerge due to the collective actions of buyers and sellers and can indicate potential trend reversals or continuations. Some common chart patterns include triangles suggesting a consolidation before a breakout, Quasimodo indicating a potential trend reversal, and flags signalling the continuation of an existing trend.
What Is the 5-3-1 Trading Strategy?
The 5-3-1 trading strategy is a disciplined approach designed to help traders focus and improve their trading skills. It involves trading just five currency pairs to reduce complexity and enhance expertise in those markets. Traders then use only three specific strategies to master and consistently apply. Finally, they select one trading timeframe to maintain consistency and avoid confusion.
*Important: At FXOpen UK, Cryptocurrency trading via CFDs is only available to our Professional clients. They are not available for trading by Retail clients. To find out more information about how this may affect you, please get in touch with our team.
This article represents the opinion of the Companies operating under the FXOpen brand only. It is not to be construed as an offer, solicitation, or recommendation with respect to products and services provided by the Companies operating under the FXOpen brand, nor is it to be considered financial advice.

WTI TRADE IDEAhello everyone
From the previous oil movement, the entry at 58.52 moved up by 80 pips before hitting breakeven. For the upcoming open market, if the trendline and support or resistance break out as shown on the M30 chart, it could signal an opportunity to enter the market.
Ensure strong confirmation before acting, and keep an eye on shifts in market structure.
Thanks a lot for your support & best of luck
**My trading strategy is not intended to be a signal. It's a process of learning about market structure and sharpening my trading my skills also for my trade journal**

XAUUSD UPDATE : FED INTEREST RATE DECISION hello & happy weekend everyone
For coming week trade forecast. From the left side, the daily chart indicates that a breakout has occurred, and the current increase is a temporary pullback. If a rejection happens at the 0.236 daily retracement and the trendline on 1 hour chart successfully pushes the price downward, I see an opportunity to short towards the upcoming Fed interest rate decision.
And I am very grateful for the support given, especially in some of the previous trades. I hope that my trade plan can help traders identify the direction to enter the market.
good luck all
**My trading strategy is not intended to be a signal. It's a process of learning about market structure and sharpening my trading my skills also for my trade journal**
Thanks a lot for your support

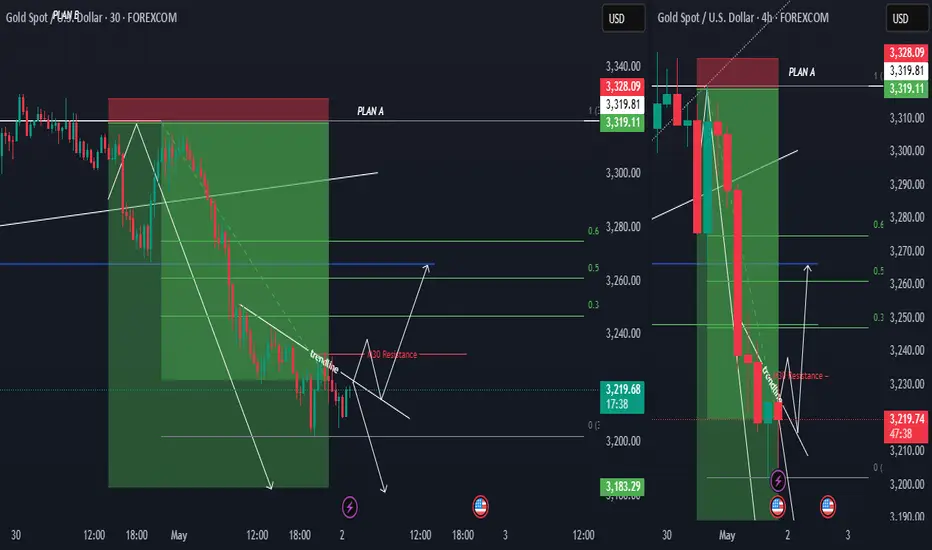
XAUUSD UPDATE : NFP hi everyone
I hope you were able to ride the market based on the previous trade idea.
Gold has broken below the daily support level, and the current upward movement is likely just a retracement. Therefore, both my Plan A and Plan B focus on short positions. For a stronger bullish move, the price needs to form a lower low—at least on the H1 timeframe.
good luck all
**My trading strategy is not intended to be a signal. It's a process of learning about market structure and sharpening my trading my skills also for my trade journal**
Thanks a lot for your support

WTI TRADE UPDATEhi all
Based on the current situation for WTI, with the stop loss hit from the previous trade idea, Plan A now relies on a breakout of the trendline and the support turning into resistance as confirmation for taking a long position.
However, if rejection occurs at the trendline or at the support-turned-resistance level, there's a possibility that the price will decline again, given that a breakout has already happened on the daily timeframe. Therefore, closely monitoring price movements around these key levels is crucial before making any trading decisions.
Ensure strong confirmation before acting, and keep an eye on shifts in market structure. Feel free to share any new updates, and best of luck with your strategy!
good luck all
**My trading strategy is not intended to be a signal. It's a process of learning about market structure and sharpening my trading my skills also for my trade journal**
Thanks a lot for your support

XAUUSD UPDATEHi all
The rejection at the 3202 level, Plan A remains a strong possibility, especially if the trendline also shows signs of resistance. However, if the trendline breaks, then Plan B would be the preferred approach—waiting for a confirmed breakout on the 30-minute timeframe before considering a long position.
Keep a close watch on price action and ensure strong confirmation before making any moves. Feel free to share any updates or additional insights. Wishing you success in trading!
good luck all
**My trading strategy is not intended to be a signal. It's a process of learning about market structure and sharpening my trading my skills also for my trade journal**
Thanks a lot for your support
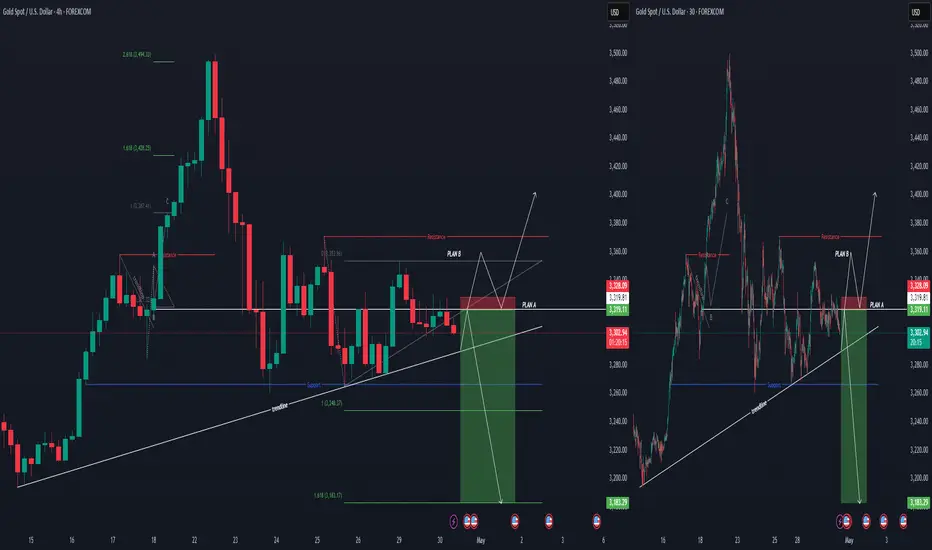
XAUUSD TRADE IDEA
Hi everyone,
here is my gold price movement forecast. My forecast tends to lean towards temporary strength for gold. Therefore, if there is a rejection at the trendline on the H4, I will wait for the price to come back to 3320 before shorting gold... If the price successfully breaks the entry price and makes a new high, I will look for opportunities to long towards 3402.
good luck all
**My trading strategy is not intended to be a signal. It's a process of learning about market structure and sharpening my trading my skills also for my trade journal**
Thanks a lot for your support
US500 TRADE IDEAhi again
The US500 has shown strength by breaking the resistance at 5483.5 and is now at 5535. If the price reaches 5604.6 and a pullback occurs, targeting a temporary decline at the 50% Fibonacci retracement level is a good strategy.
Fibonacci retracement is often used to identify potential support and resistance levels where the price might pause or reverse. The 50% level is one of the commonly watched levels by traders as it often indicates a significant turning point in price movement.
good luck all
**My trading strategy is not intended to be a signal. It's a process of learning about market structure and sharpening my trading my skills also for my trade journal**
Thanks a lot for your support

OIL TRADE IDAHello
Hi everyone. Regarding oil movements, I see a long opportunity at the level of 59.61. If the price closes below 58.56, there is a possibility of a temporary rise before continuing to drop to 55.
good luck all
**My trading strategy is not intended to be a signal. It's a process of learning about market structure and sharpening my trading my skills also for my trade journal**
Thanks a lot for your support

XAUUSD TRADE IDEAhi all
this my trade plan until end of this month
good luck
**My trading strategy is not intended to be a signal. It's a process of learning about market structure and sharpening my trading my skills also for my trade journal**
Thanks a lot for your support

US500 BULLISH SYMMETRICAL TRIANGLEhi
Fundamental view
The **US500 index** dropped due to several key factors affecting the U.S. stock market:
📉 **Tech Stock Decline** – Technology stocks faced heavy pressure, especially after **Nvidia** plunged **6.9%** due to U.S. restrictions on AI chip exports to China. Other stocks like **AMD (-7.3%)** and **Micron Technology (-2.4%)** also fell.
💰 **Federal Reserve Uncertainty** – Remarks from **Fed Chair Jerome Powell** raised concerns in the market. Powell warned that new tariffs could trigger higher inflation and slow economic growth, making investors uncertain about interest rate policies.
🛍️ **Surge in Retail Sales** – Retail sales jumped **1.4%** in March as consumers rushed to buy before new tariffs took effect. This highlights economic uncertainty, pushing investors to sell their stocks.
Overall, a mix of trade tensions, uncertain monetary policy, and a tech stock sell-off caused the **US500 index to drop 120.93 points (-2.24%)** on **April 16, 2025**.
Technical view
Yes, the **bullish symmetrical triangle** pattern is often a strong signal for upward price movement. When the price moves within this pattern, it usually indicates a **tightening volatility** before a **breakout**, which can present a good market entry opportunity.
🔍 **Breakout Confirmation**
1️⃣ Increased trading volume when price breaks above the **upper trendline**.
2️⃣ A closing candle above the **triangle resistance** for a valid signal.
3️⃣ Price targets can be measured using the pattern’s initial height as a projection.
📈 **Potential Price Movement**
If the breakout happens, the price could surge toward the next **resistance level**. However, if the breakout fails and price moves below support, the pattern could turn **bearish**.
Warren Buffett famously said, “Be greedy when others are fearful.”
good luck
**My trading strategy is not intended to be a signal. It's a process of learning about market structure and sharpening my trading my skills also for my trade journal**
Thanks a lot for your support

GBPUSD TRADE IDEAhi all
this my trade plan until end of this month
good luck
**My trading strategy is not intended to be a signal. It's a process of learning about market structure and sharpening my trading my skills also for my trade journal**
Thanks a lot for your support

BTC TRADE IDEAhi all
Potential Triple Top Pattern
good luck
**My trading strategy is not intended to be a signal. It's a process of learning about market structure and sharpening my trading my skills also for my trade journal**
Thanks a lot for your support

XAUUSD RECAP & TRADE IDEAFrom the previous setup, we can see that the movement of gold made a breakout at the 2728 level before dropping to the take profit level at the 2.618 Fibonacci extension (2651) and then made a correction to the 50-61.8 Fibonacci retracement level (2709). So this week, I am waiting to see if the current price will head towards the 1.618 Fibonacci extension before deciding to continue the buy position. If the price successfully breaks the support level at 2642, it is likely that the price will head towards 2360-2500/90. However, if there is a bounce at the support area, the price might continue to rise towards 2690-2700.
**My trading strategy is not intended to be a signal. It's a process of learning about market structure and sharpening my trading my skills also for my trade journal**
Thanks a lot for your support

USDJPY UPDATEFrom the weekly chart, the price has reached the 61.5 Fibonacci retracement level and made a rejection at the price of 145.470 before dropping again to the level of 152.134 on the 1-hour time frame. Therefore, I am waiting for any possibility of a rejection as shown in the chart before deciding to continue selling USD/JPY

XAUUSD TRADED IDEAHi all
There are two movements, buy and sell. If the price respects the trendline, it is likely that the price will continue to drop to TP 1. However, if there is a breakout at the trendline and it makes a new high, it is likely that the price will change direction to a buy and target an all-new time high of 2874
**My trading strategy is not intended to be a signal. It's a process of learning about market structure and sharpening my trading my skills also for my trade journal**
Thanks a lot for your support

USDJPY TRADE IDEAHi all
look like its a good time to short long JPY
**My trading strategy is not intended to be a signal. It's a process of learning about market structure and sharpening my trading my skills also for my trade journal**
Thanks a lot for your support

GBPJPY UPDATEHi all
2 possible trade plan...
**My trading strategy is not intended to be a signal. It's a process of learning about market structure and sharpening my trading my skills also for my trade journal**
Thanks a lot for your support

EURJPY UPDATEhi all
this my trade plan for this week..
good luck
**My trading strategy is not intended to be a signal. It's a process of learning about market structure and sharpening my trading my skills also for my trade journal**
Thanks a lot for your support

BTCUSD WEEKLY UPDATE hi all
"Last week, BTC/USD failed to break through the resistance level of 71195 and faced rejection. So, this week, I am observing the price action to see if there is still potential for the market to decline."
**My trading strategy is not intended to be a signal. It’s a process of learning about market structure and sharpening my trading skills, as well as for my trade journal.**

GBPUSD UPDATE Next week is going to be very high-risk, starting with the US election, BOE Monetary and followed by the FOMC meeting.
Based on technical analysis, I am biased towards going long on GBP/USD after the strength of the USD leading up to the US election.
good luck
**My trading strategy is not intended to be a signal. It's a process of learning about market structure and sharpening my trading my skills also for my trade journal**
Thanks a lot for your support

EURUSD UPDATE ( HIGH RISK WEEK )Next week is going to be very high-risk, starting with the US election and followed by the FOMC meeting.
Based on technical analysis, I am biased towards going long on EUR/USD after the strength of the USD leading up to the US election.
good luck
**My trading strategy is not intended to be a signal. It's a process of learning about market structure and sharpening my trading my skills also for my trade journal**
Thanks a lot for your support
