XAUUSD TRADE IDEAhi all
Gold is currently trading within a 4-hour range. The price has already broken the initial trendline. Now, we are waiting for the second trendline, which is between the high of $2,672.96 and the low of $2,631.92, to break. A pullback to the 0.236% Fibonacci extension area might provide an opportunity to buy the dip and cut the position if the candle closes below $2,634.37.
**My trading strategy is not intended to be a signal. It’s a process of learning about market structure and sharpening my trading skills, as well as for my trade journal.**
Nakedchartanalysis

OIL TRADE IDEAhi all
expecting a short term pullback after HH perform.
look for HL before continue make new HH
also there is possibility price make new LL on high time frame
**My trading strategy is not intended to be a signal. It's a process of learning about market structure and sharpening my trading my skills also for my trade journal**
Thanks a lot for your support

GBPUSD : WEEKLY TRADE IDEAHi all
expecting 1.29757 & short tern buy before continue drop
Happy Weekend all
**My trading strategy is not intended to be a signal. It's a process of learning about market structure and sharpening my trading my skills also for my trade journal**
Thanks a lot for your support

EURUSD: WEEKLY UPDATEhi all
expecting 1.09289 rejection and short-term buy before continued drop towards US election.
**My trading strategy is not intended to be a signal. It's a process of learning about market structure and sharpening my trading my skills also for my trade journal**
Thanks a lot for your support

GBPJPY : WEEKLY UPDATEHi all
expecting a lower high as soon as the previous trade plan
**My trading strategy is not intended to be a signal. It's a process of learning about market structure and sharpening my trading my skills also for my trade journal**
Thanks a lot for your support

EURJPY : WEEKLY UPDATEhi all
expecting a lower high as soon as the previous trade plan
good luck
**My trading strategy is not intended to be a signal. It's a process of learning about market structure and sharpening my trading my skills also for my trade journal**
Thanks a lot for your support

XAUUSD : ROAD TO 3K
GOOD LUCK ALL
**My trading strategy is not intended to be a signal. It's a process of learning about market structure and sharpening my trading my skills also for my trade journal**
Thanks a lot for your support

EURJPY : TRADE IDEAWaiting for trendline to break.
**My trading strategy is not intended to be a signal. It's a process of learning about market structure and sharpening my trading my skills also for my trade journal**
Thanks a lot for your support

GBPJPY : TRADE IDEACup and handle chart pattern
I like to see 193.502 breakout from the previous high and then retracement before entering the market.
**My trading strategy is not intended to be a signal. It's a process of learning about market structure and sharpening my trading my skills also for my trade journal**
Thanks a lot for your support

XAUUSD : WAITINGThe price of gold is rising every ten years.
2000 ATH in 2011;
2020 ATH in 2074;
2023 ATH in 25XX
If level 2543-46 is rejected, I plan to long USD until the US election around 2413.75 & 2277.17, and then hunt for opportunities to buy gold.
**My trading strategy is not intended to be a signal. It's a process of learning about market structure and sharpening my trading my skills also for my trade journal**
Thanks a lot for your support

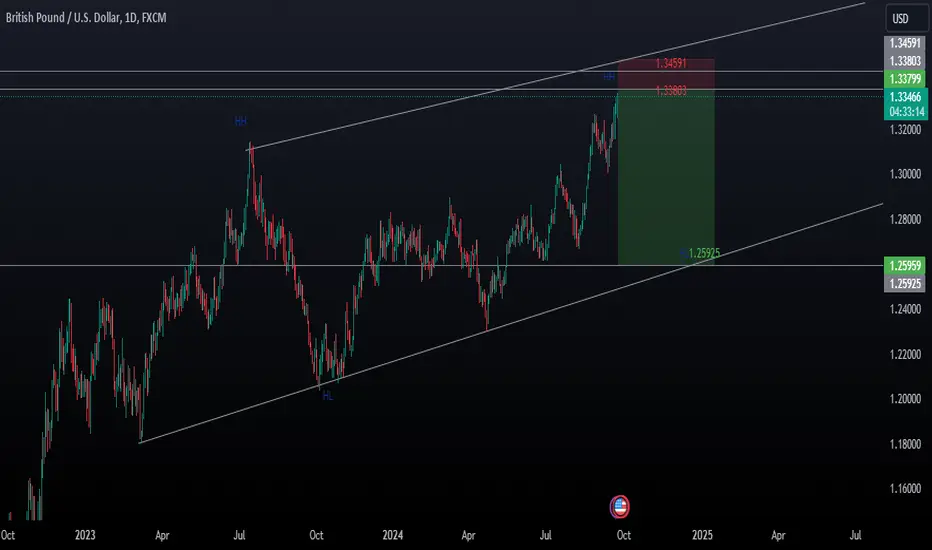
GBPUSD : SWING TRADE IDEA
I want to go long USD starting around 1.3380 and 1.34590, fundamentally similar to the eurusd fed cut last week.
1.25925 is my first aim.
**My trading strategy is not intended to be a signal. It's a process of learning about market structure and sharpening my trading my skills also for my trade journal**
Thanks a lot for your support
EURUSD : SWING TRADE IDEAI plan to go long USD starting at level 1.11601 with a stop loss at 1.2050 following last week's Fed cut.
My first target level is 1.08762.
**My trading strategy is not intended to be a signal. It's a process of learning about market structure and sharpening my trading my skills also for my trade journal**
Thanks a lot for your support

Mastering Naked Forex Trading: Strategies, Pros, and TipsEmbarking on the journey of "Naked Forex Trading" marks a departure from conventional trading methods, as traders eschew traditional technical indicators in favor of a purer, more intuitive approach. This article delves into the operational intricacies, diverse strategies, and nuanced pros and cons of naked trading, offering practical insights and tips to navigate this distinctive trading method successfully.
Understanding Naked Forex Trading:
Naked forex trading represents a paradigm shift in trading philosophy, where traders base their decisions solely on price action, devoid of the clutter of technical indicators. It entails analyzing raw price movements on charts, such as identifying support and resistance levels, drawing trendlines, and interpreting candlestick patterns. By embracing the " naked " approach, traders aim to gain a clearer, unfiltered perspective on market dynamics and sentiment.
Operation Of The Naked Trading Strategy:
At its core, naked trading simplifies the trading process by stripping away the complexities of technical indicators and focusing solely on price action. Traders develop a keen eye for key support and resistance levels, draw trendlines to identify market trends, and meticulously analyze candlestick patterns for potential trading opportunities. This approach emphasizes disciplined adherence to entry and exit rules based on observable price movements, fostering a deeper understanding of market dynamics.
Naked Trading Strategies:
Naked trading encompasses a spectrum of strategies, each tailored to exploit specific aspects of price action. These strategies include:
1. Identifying Support and Resistance:
Traders discern significant support and resistance levels on price charts, observing price reactions near these levels and making decisions based on historical significance and current market dynamics.
2. Drawing Trendlines:
Trendlines are sketched to delineate the prevailing market direction, enabling traders to identify potential entry and exit points aligned with the trend's trajectory.
3. Analyzing Candlestick Patterns:
Traders scrutinize candlestick patterns to gauge market sentiment and anticipate potential reversals or continuations. Patterns such as doji, engulfing patterns, and pin bars provide valuable insights into market psychology.
4. Recognizing Price Action Patterns:
Common price action patterns, including double tops, double bottoms, and head and shoulders formations, are identified to anticipate future price movements and inform trading decisions.
5. Executing Breakout Trading:
Traders identify consolidation zones or chart patterns signaling potential breakouts, entering positions when prices breach resistance or support levels, anticipating significant price movements.
6. Observing Engulfing Patterns:
Bullish or bearish engulfing patterns, where one candle fully encompasses the preceding one, serve as signals for potential reversals or continuations, guiding traders in their decision-making process.
7. Naked Trading with Moving Averages:
While purists adhere to pure price action analysis, some traders integrate moving averages to complement their naked trading strategy, providing additional confirmation of trends.
8. Monitoring Round Numbers and Psychological Levels:
Round numbers and psychological levels on price charts act as additional support or resistance levels, influencing trader behavior and serving as strategic decision-making points.
9. Pattern Recognition:
Traders develop proficiency in recognizing various chart patterns, such as triangles, wedges, and rectangles, leveraging breakouts or breakdowns from these patterns as potential trading opportunities.
10. Implementing Multiple Time Frame Analysis:
Combining naked trading strategies with multiple time frame analysis enriches traders' understanding of market conditions, providing insights into both short-term fluctuations and long-term trends.
Achieving success in naked trading demands a comprehensive understanding of market dynamics, disciplined pattern recognition, and the ability to interpret raw price charts effectively. Patience and effective risk management are essential to capitalize on high-probability trading setups and mitigate potential losses.
Pros And Cons Of Naked Trading Strategy:
The naked trading strategy offers several advantages:
1. Simplicity: Naked trading simplifies the trading process by eliminating the clutter of technical indicators, making it accessible for traders of all levels of experience.
2. Focus on Market Dynamics: By focusing solely on price action, naked traders develop a deeper understanding of market dynamics and trends.
3. Adaptability: Naked trading strategies can be applied across various financial markets and timeframes, providing flexibility and adaptability to changing market conditions.
4. Emphasis on Trader Psychology: Naked trading places a significant emphasis on understanding trader psychology and market sentiment, leading to more informed trading decisions.
5. Versatility in Strategies: Naked trading allows traders to customize their strategies based on their preferences and trading styles, incorporating a wide range of price action techniques.
However, naked trading also presents some challenges:
1. Subjectivity: Naked trading often involves subjective analysis, as traders interpret price action based on their individual perspectives, leading to potential variations in trading decisions.
2. Lack of Confirmation: Without the aid of technical indicators, naked traders may lack confirmation of signals, increasing the risk of false signals and trading errors.
3. Limited Predictive Power: Naked trading primarily focuses on historical price movements, which may limit its ability to predict future market conditions accurately.
4. Vulnerability to Whipsaws: In volatile or low-liquidity markets, naked trading strategies may be more susceptible to whipsaws, resulting in unexpected losses or missed opportunities.
5. Learning Curve: Mastering naked trading requires a solid understanding of price action analysis and market psychology, posing a steep learning curve for novice traders.
Tips For Trading Naked Without Indicators:
To optimize naked trading strategies, traders can employ the following tips:
1. Practice on a Demo Account: Open a demo account to practice naked trading and refine your skills without risking real capital.
2. Incorporate Order Flow Analysis: Use order flow analysis to gain insights into market dynamics and identify potential trading opportunities.
3. Develop Trading Psychology: Cultivate a disciplined mindset and emotional resilience to navigate the ups and downs of trading without the aid of indicators.
4. Utilize Forex Correlation and Currency Strength Meter: Leverage forex correlation and currency strength meter tools to identify correlations between currency pairs and gauge market sentiment.
5. Explore Other Price Action Trading Strategies: Expand your repertoire of price action trading strategies, such as supply and demand trading or range trading, to enhance your trading toolkit.
In conclusion Naked forex trading epitomizes the power of simplicity and reliance on price action analysis, offering traders a clear and unfiltered view of market dynamics. While it presents challenges such as subjectivity and a steep learning curve, traders can overcome these obstacles through diligent practice, analysis, and a deeper understanding of market psychology. By integrating diverse strategies, adhering to sound risk management principles, and honing their analytical skills, traders can harness the full potential of naked trading and navigate the forex markets with confidence and precision.

MASTERING MARKET STRUCTURE : BOS, CHOCHBreak of Structure: This term is used in trading and technical analysis to describe a significant change in the price action of an asset. It occurs when the established pattern of higher highs and higher lows (in an uptrend) or lower highs and lower lows (in a downtrend) is disrupted, indicating a potential change in market sentiment and trend direction.
Examples of Break of Structure: You can find examples of "break of structure" in both bullish and bearish movements. In a bullish scenario, a "break of structure" occurs when a new Higher High (HH) is formed, surpassing the previous High (H). In a bearish context, it happens when the price forms a new Lower Low (LL) below the previous Low (L), indicating a potential shift in market sentiment and trend direction.
Shift in Structure : Sometimes, a "break of structure" leads to a more profound change in market character, referred to as a "Shift in Structure." This often involves a transition from a bullish to a bearish trend or vice versa.
Change of Character (CHOCH): The first instance of a significant shift in market sentiment and trend direction is termed "Change of Character" (CHOCH). This emphasizes the unique nature of the initial change.
Break of Structure (BOS): Subsequent occurrences of a similar shift in market sentiment are labeled as "Breaks of Structure" (BOS). These serve to differentiate the first significant change from those that follow.
These concepts are vital in trading and technical analysis as they help traders identify changes in market sentiment, adapt to evolving trends, and make informed trading decisions. Recognizing a "break of structure" and understanding when it leads to a "shift in structure" is essential for effective trading.

EURJPY WEEKLY TRADE UPDATEHi
same applies to the eurjpy. I continue to be biased toward the rise despite the sideways market. the closest support level at 156.579, thus a rejection could be a good idea to keep long eur.
**My trading strategy is not intended to be a signal. It's a process of learning about market structure and sharpening my trading my skills also for my trade journal**
Thanks a lot for your support

GBPJPY WEEKLY TRADE UPDATEHi all
I find that the gbp/jpy move in the sideways market has a bias upwards.
Weekly support at level 180.39, and if the price rejects that level, I'm looking for a three-wave uptrend, as the chart shows.
**My trading strategy is not intended to be a signal. It's a process of learning about market structure and sharpening my trading my skills also for my trade journal**
Thanks a lot for your support

USDCAD TRADE IDEAhi all
swing trade
waiting for price action
Let me know what you think In the comments!
**My trading strategy is not intended to be a signal. It's a process of learning about market structure and sharpening my trading skills**
Thanks a lot for your support

XAUUSD TRADE IDEAHi all..
still look for short...
**I have no intention of using my trading approach as a signal. I'm practicing my trading strategies, learning about market dynamics, and figuring out the best way to enter the market in the right direction.

XAUUSD WEEKLY UPDATEhi trader..
Gold is almost to 100 fibo extension. So, either gold is going to climb higher and break the triple top, or it will form an LH wave (6) and continue to form wave (7).
so good luck to all of you and have wonderful weekend
**I have no intention of using my trading approach as a signal. I'm practicing my trading strategies, learning about market dynamics, and figuring out the best way to enter the market in the right direction.

XAUUSD THE BIG WHYHi all
i hope its help retail trader understand the move & direction..
so good luck to u all
*I have no intention of using my trading approach as a signal. I'm practicing my trading strategies, learning about market dynamics, and figuring out the best way to enter the market in the right direction.

COPPER TRADE IDEAhello all
My plan is to buy copper until the resistance level is reached.
*I have no intention of using my trading approach as a signal. I'm practicing my trading strategies, learning about market dynamics, and figuring out the best way to enter the market in the right direction.

XAGUSD WEEKLY UPDATEhello silver trader
silver testing support at level 21.464, I think. A break through that point might lead to the following support level at 21.464.
Silver will likely fall further because of the trendline's breakthrough.
**I have no intention of using my trading approach as a signal. I'm practicing my trading strategies, learning about market dynamics, and figuring out the best way to enter the market in the right direction.

USDX UPDATEHi all
The weekly level has already broken through.
I see a head and shoulders pattern from the structure.
I plan on going short USDX in a short term for correction.
I plan to enter the market with these two levels.
good luck
**My trading strategy is not intended to be a signal. It's a process of learning about market structure and sharpening my trading skills**
Thanks a lot for your support
