NANO shows bullish signs#NANO 1d
Found support in August and was able to rebound impulsively after a global corrective decline. After a rebound, it also forms a corrective pullback, but already now it is starting to demonstrate the prerequisites for another growth. From the current level (3200) and up to the support of 2600, we can gain volume for another impulse. NANO has obvious bullish signs, but trading may take some time, it is likely that by the end of next month the market will be able to test one of the closest resistances shown on the chart. And in the short term, we have good chances to rebound from the level of 3200 and touch resistances of 3300, 3400, 3500, 3600 and 3700
NANO

NANO 10.27.18.236 is major resistance
If btc breaks many altcoins will face a very uncertain fate with no support levels in sight. nano is one of those altcoins.

Nano - catch the coming momentum!After more than 300% percent gain during the first wave up, Nano has been one of the best performing coins. A correction just below 0.618 fib level in clear ABC pattern has been completed. The yellow resistance trendline has been broken increasing the likelihood for coming wave 3. First target is around 100% gain at the negative 0.236 level.

NANO - EOY Will be better than now and 2019 will be our yearI think we need to retest the previous low from august before making our way up, there is a lot of development being doing on the background and we must use this time to take advantages of the low prices. Nano will be great next year and maybe it will be on top 10 by CMC.
It's very unknown that we'll reach that sub 1$ price from August, because the sentiment is that everyone that loves nano and wanna buy it's waiting for that prices to come again (also me). But we'll see as the time passes buy
Nano goals until december: github.com
best buys: 0.00015~20
good buys: 0.00023~26
moderate buys: 0.00027~0.00031
play safe and with caution,
thank you all


NANO THE SHOWDOWNWaited patiently and still waiting what Nano is doing. Nano had in August togheter with VEN an important bullish impulse.
Now it seems to consolidate at this level.
If it break down the blue bar it will go down to 16-17 satoshi.
If it break above the downward resistance (black line) it will be probably good till 50 satoshis. A break above the red box will be strongly bullish.
BIO


NANO BUY CALL Trend Line Broke Buy NANO
Hold A week for good profit
It broke major trend line nd macd , rsi showing bullish movement coming

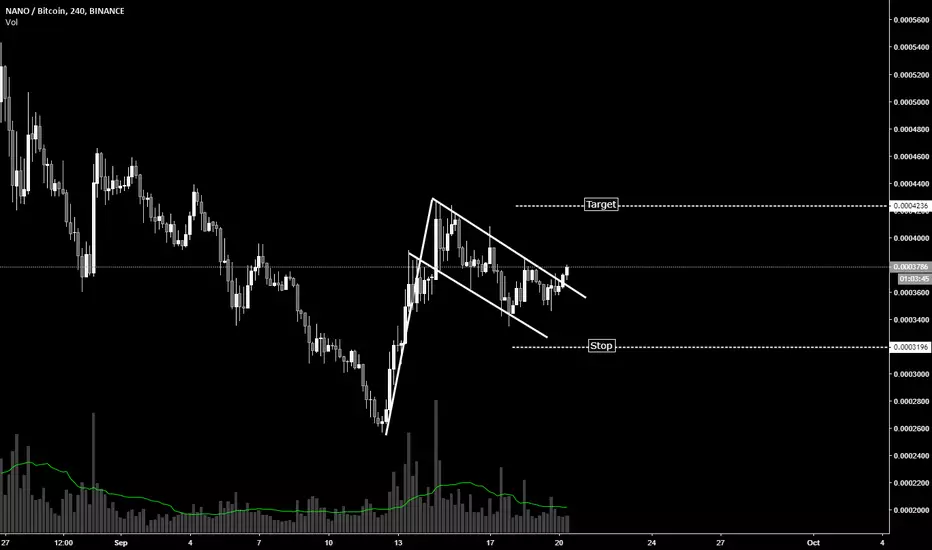
Nano showing bullish signs SFP formation observed on the daily, will be looking to long any retrace down to the open/close of previous daily candle and stop beneath the swing low wick. Targeting the clear S/R level marked in red.
Idea by Pheneck


Nano/BTC showing signs of bullishnessSFP formation observed on the daily, will be looking to long any retrace down to the open/close of previous daily candle and stop beneath the swing low wick. Targeting the clear S/R level marked in red

NANOBTCNANO has a strong support at marked level. Wait till the price breaks the resistance line to buy.

Bullish Divergence showing on NANO/BTC.NANO/BTC is showing bullish divergence on both the RSI and the CMF on the 4-hour chart. We've also been in this fairly long downward trending-flag-type pattern. I could see the argument for this being a very over-extended bull-flag. However, there is a bunch of uncertainty given the USDT issues and the massive premium for Bitcoin on tether-based exchanges relative to the fiat-based exchanges, so keep that in mind that this is a higher risk trade and that it wouldn't take much to send the whole market reeling.
I entered around 2830. There is a chance a better entry could show up somewhere in the mid/upper 2700 range.
Target 1: 3000 sat's.
Target 2: 3300 sat's.
Target 3: 3600 sat's.
-Do note: If this was a very over-extended bull-flag, we could see it move to as high as 4500 for Target 3 if volume shows up big time on the break-out of the top of the flag.
SL: 2650 (right below the previous tweaser bottom.)

NANO/BTC Idea - Patience for Long SetupHere is a setup that could reap large profits if it comes to fruition...
Looking for a retest of previous price levels, along with the RSI to retest its previous low.
The 2 main supports I see are in yellow. It is possible to bounce from the first yellow square. However, I will not open a trade there. If price enters the 2nd yellow zone, and if the RSI enters the second yellow zone, that could be a great trade setup, with a great Risk/Reward profile.
So I am setting a buy order just above 2nd support level (our previous major low), and see if the price reaches in next days.
It very possibly may not, but I will remember to protect my capital at all times, as should you :)
Be selective with what trades you take!
Good luck traders :)

A trading opportunity to buy in NANOBTCTechnical analysis:
. NANO/BITCOIN is in a range bound and the beginning of uptrend is expected.
. The price is below the 21-Day WEMA which acts as a dynamic resistance.
. The RSI is at 38.
. While the RSI downtrend in the Daily chart is not broken, bearish wave in price would continue.
Trading suggestion:
. There is a possibility of temporary retracement to suggested support zone (0.0002730 to 0.0001250). if so, traders can set orders based on Price Action and expect to reach short-term targets.
Beginning of entry zone (0.0002730)
Ending of entry zone (0.0001250)
Entry signal:
Signal to enter the market occurs when the price comes to " Buy zone " then forms one of the reversal patterns, whether " Bullish Engulfing ", " Hammer " or " Valley " in other words,
NO entry signal when the price comes to the zone BUT after any of the reversal patterns is formed in the zone.
To learn more about " Entry signal " and the special version of our " Price Action " strategy FOLLOW our lessons:
Take Profits:
TP1= @ 0.000423
TP2= @ 0.000497
TP3= @ 0.000570
TP4= @ 0.000727
TP5= @ 0.000912
TP6= @ 0.001097
TP7= @ 0.001360
TP8= @ 0.001696
TP9= Free

NANO stays under pressure, watch key resistanceIn August, Nano had a short-lived rally, which resulted in a 345% growth over the Bitcoin. Although after this rally, price went down, resulting in a 54% correction. Since 12th of September up until today, NANO/BTC hasn’t been very active. Price simply moved around the btc 0.00035 level, where the most trade volume has been concentrated throughout the past 3 months.
Looking at the most recent price action, Nano formed a double bottom at 61.8% Fibonacci retracement level, that is btc 0.00032. At the same time Gann Fan trendline was rejected and it seems that NANO could be heading north from this point onwards.
But don’t get excited too fast, as more growth from Nano could only be seen if the current support level will be respected by the market participants. If/when NANO/BTC will go below btc 0.003 psychological support, chances of further decline will become very high, and price might fall towards btc 0.00027 or even lower.
Perhaps watching the descending cannel for the upside breakout along with the RSI resistance breakout could be that buying trigger. The next resistance level is see at btc 0.00044, price action around which could help to determine further intentions of the Nano coin.
At the same time, it is possible that buying orders are waiting to be executed near the btc 0.00027 area, that is 88.6% Fibs. This is obviously a much better price to get some Nano, confirmation of the support bounce will be required, as Nano could also break below the 88.6% fibs and go much lower.
Support:
1. 0.000322
2. 0.000300
3. 0.000276
Resistance:
1. 0.000350 (key resistance)
2. 0.000440

NANO breakout looking bearish There has been little activity in NANO for the past couple of days
NANO symmetrical triangle breakout is bullish BUT hour chart shows us bearish... why?
1) Tweezer Candle
2) RSI divergence
3) MACD downticking
Keep on the lookout for nano

Symmetrical Triangle breakout soon!There has been steady price action. It looking like NANO will hit the 4400 range.


Possible Bull flag formation in play for NANO.NANO/BTC appears to be within a bull flag formation. NANO/BTC has performed well even in the face of Bitcoin's recent drops, and it has maintained it's current levels quite well. I've laid out a few scenario's for what I think will happen.
Scenario 1 (Green Arrow): NANO/BTC moves up from it's current position and breaks above the bull flag and begins it's march to 4800-5000 sat's.
Scenario 2 (Yellow Arrow's): NANO/BTC moves to the top of the bull flag (3550 sat's), and is rejected for again before moving back down to the bottom of the bull flag (2900-3000 sat's.) It could also move down from it's current levels (3370ish sat's) to retest the bottom of the bull flag near 2900-3000 sat's before moving up to test the top of the bull flag.
Scenario 3 (Red Arrow's): NANO/BTC heads down from current levels (3370ish sat's) and breaks through the bottom of the bull flag near 2900-3000 sat's invalidating our bull flag. Additionally, it could successfully retest the top of the bull flag, get rejected, and fail to hold the bottom of the bull flag also invalidating our pattern. We had a previous bottom around 2550-2600 sat's, so that might be an area of interest for reentry.
-I lean toward Scenario 2; as for the MACD on the 4-hour got a bearish cross-over a short while ago, and the daily MACD is moving down. The 4-hour Stochastic is also showing downward movement, while the Daily appears to be showing signs of turn around. RSI on the 4-hour and on the Daily are both fairly neutral. I think we could see a retest of the bottom of the bull flag near 2900-3000 sat's before moving back up the top of the bull flag near 3450ish. I will be watching for a break below 2900ish sat's, or a break above 3450ish sat's (estimations) if the 2900-3000 level holds and we see a bounce up to the top of the bull flag. As always, keep an eye on Bitcoin and it's price movements as well, since it can be a major influence on alt-coin movements.
--This is not financial advice or financial recommendations. Do your own research and come to your own conclusions before buying/investing. I am not liable for any losses incurred.
