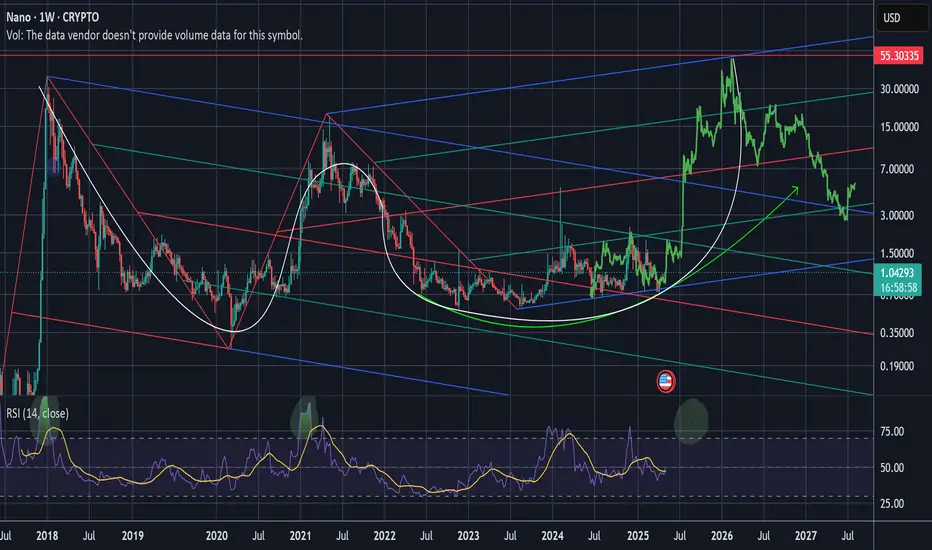
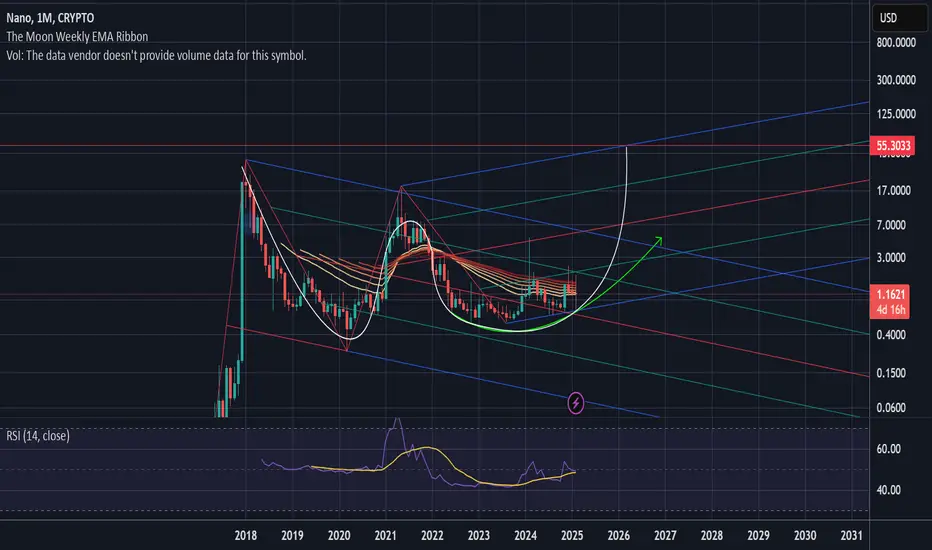
NANO to the fkng Moon: updateupdating my previous analysis which shows how the price evolution would be if it were identical to the previous 2021 bullrun.
This update adjusts the price projection according to today's photograph.
Nanousdt

XNOUSDT Analysis: Volume Spike with a Promising Blue Box EntryXNO
USDT Analysis: Volume Spike with a Promising Blue Box Entry
Key Points:
Daily Volume Spike: A significant 149% increase in daily volume suggests heightened activity in NANOUSDT.
Blue Box as Demand Zone: The blue box on the chart is identified as a solid entry zone for potential buyers.
Confirmation Checklist:
Before entering a position, I will confirm with:
Cumulative Delta Volume (CDV)
Liquidity Heatmap
Volume Profile
Volume Footprint
Upward Market Structure Breaks on Lower Time Frames
Additional Insight:
NANOUSDT’s volume increase indicates strong interest, but caution is advised due to overall market conditions. Always manage risk appropriately and consider waiting for confirmations in the blue box zone.
Learn Advanced Techniques:
Want to refine your entries like this? DM me to learn how to use CDV, heatmaps, and other key tools effectively.
Closing Note:
Patience and precision are key. The blue box looks like a solid demand zone—trade wisely and good luck!
If you think this analysis helps you, please don't forget to boost and comment on this. These motivate me to share more insights with you!
I keep my charts clean and simple because I believe clarity leads to better decisions.
My approach is built on years of experience and a solid track record. I don’t claim to know it all, but I’m confident in my ability to spot high-probability setups.
If you would like to learn how to use the heatmap, cumulative volume delta and volume footprint techniques that I use below to determine very accurate demand regions, you can send me a private message. I help anyone who wants it completely free of charge.
My Previous Analysis (the list is long but I think it's kinda good : )
🎯 ZENUSDT.P: Patience & Profitability | %230 Reaction from the Sniper Entry
🐶 DOGEUSDT.P: Next Move
🎨 RENDERUSDT.P: Opportunity of the Month
💎 ETHUSDT.P: Where to Retrace
🟢 BNBUSDT.P: Potential Surge
📊 BTC Dominance: Reaction Zone
🌊 WAVESUSDT.P: Demand Zone Potential
🟣 UNIUSDT.P: Long-Term Trade
🔵 XRPUSDT.P: Entry Zones
🔗 LINKUSDT.P: Follow The River
📈 BTCUSDT.P: Two Key Demand Zones
🟩 POLUSDT: Bullish Momentum
🌟 PENDLEUSDT.P: Where Opportunity Meets Precision
🔥 BTCUSDT.P: Liquidation of Highly Leveraged Longs
🌊 SOLUSDT.P: SOL's Dip - Your Opportunity
🐸 1000PEPEUSDT.P: Prime Bounce Zone Unlocked
🚀 ETHUSDT.P: Set to Explode - Don't Miss This Game Changer
🤖 IQUSDT: Smart Plan
⚡️ PONDUSDT: A Trade Not Taken Is Better Than a Losing One
💼 STMXUSDT: 2 Buying Areas
🐢 TURBOUSDT: Buy Zones and Buyer Presence
🌍 ICPUSDT.P: Massive Upside Potential | Check the Trade Update For Seeing Results
🟠 IDEXUSDT: Spot Buy Area | %26 Profit if You Trade with MSB
📌 USUALUSDT: Buyers Are Active + %70 Profit in Total
🌟 FORTHUSDT: Sniper Entry +%26 Reaction
🐳 QKCUSDT: Sniper Entry +%57 Reaction
📊 BTC.D: Retest of Key Area Highly Likely
I stopped adding to the list because it's kinda tiring to add 5-10 charts in every move but you can check my profile and see that it goes on..

XNOUSDT (Nano) Looks Ready To MoonHi guys, let's take a step back and walk through the price action of XNOUSDT (Nano) to see what it has in store for us.
We'll start the technical analysis of Nano (XNO) vs USDT from the monthly timeframe down to the 4-hourly to gain a broader perspective on its price action, allowing us to anticipate trends both in the long and short term.
Monthly Timeframe:
As seen in the chart above, we've had series of rejection and indecision candles since June 2024 down to November where we currently are. As we know, rejection and indecision candles alone don’t hold much weight, but they become significant when they occur in an area of interest, as we're seeing here. This is the third time this trendline has been tested, and it seems to be holding strong. The persistence of these rejection and indecision candles over the past five months might suggest that selling pressure is beginning to ease and buyers are starting to take interest.
Zooming in a bit further and marking the monthly lows and highs, it's obvious that we've been making series of HH (higher highs) and HL (higher lows).
Since the impulsive wave from October 2024 to March 2024 that led to break of previous monthly lower highs, it is expected to have correction since price does not move in a straight line but rather moves in impulse-corrective waves. Not only is correction healthy, it presents traders the opportunity to get in the prevailing trend at a discounted price.
With that said, what is the take away from the monthly timeframe? It looks like a good time to get in, and this is only my opinion which is based on the price action.
Now let's go down to the weekly timeframe to see what's happening.
Weekly Timeframe
On the weekly timeframe, we see a straightforward price action, a falling channel from which the price has recently broken out and a weekly HL (higher low) has just formed with a candle showing momentum. This could lead to a break of the current weekly LH (lower high) at 1.056 price level, which hasn't been tested since August 2024. For this break of structure to happen on the weekly timeframe, we’ll need to see a strong impulsive move breaking the weekly LH at the price of 1.056.
If we do not see price move into the weekly LH at 1.056 impulsively, then it means price is not ready to move just yet and only forming a bigger corrective wave.
Daily Timeframe
Now on the daily, the price breaking out of the falling channel is even clearer. Look at that nice looking impulsive move that led to break of structure coupled with where this price action is taking place makes it more interesting. Having broken the daily LH at 0.883 impulsively, and out of the channel, I would be looking for my entry signal in the corrective wave or what some will call a retest that would come after.
4 Hourly Timeframe
Same insight from the daily, will be looking for a more obvious corrective wave on the 4 hourly to start take a buy position.
That's all for Nano (XNO). Let me know what you think about this technical analysis in the comment section.
Please make sure to you do your research.
My trading rule is simple, don't take position based on what you anticipate price will do, take position only when price does what you anticipate and presents you a point of entry.

Where Is Nano (XNO) Headed?Where really is Nano headed? Well, I don't know but hoping to see what price is telling us so we know what to do if some certain move we anticipate happens.
Let's start by unravelling this mystery from the Monthly timeframe to get a holistic view of the price action.
Monthly Timeframe
Since May 2021 when price got to $17.7+ we've been in a continued down trend that seems to have no end and I can only imagine what it feels like buying at that price level and still Hodling till now.
One important thing we should always remember about the market is that price tends to spend more time in its corrective phase than it does in its impulsive phase. Just as a reminder, price moves in an impulse-corrective-impulse pattern, and Nano (XNO) is no different.
On the Monthly, we are starting to see a Break of Structure (BoS) where a previous LH (Lower High) was broken by the impulsive wave which is currently correcting as expected. Remember, after impulse, follows correction and then another impulse from the corrective phase to confirm the trend.
Corrective phase is where we should look to enter our long term positions from. We however are not going to make buy decision only what we see on the Monthly, we'll see what the Weekly, Daily and 4 Hourly timeframes say before we start thinking of how might take a position if our expectations are met.
Since we're more interested in the recent price actions, let's zoom in the Monthly to really see the structure.
Hmm, look at those sexy rejection candles. Well those alone don't mean anything as the candles are printed in the middle of nowhere. Let's scale down to Weekly in the next section.
Weekly Timeframe
Look at that, a bearish pennant which looks like it's breaking out already. Look at the price action on the weekly, since March 11th 2024, we've had series of impulse-correction. We are in a corrective phase in a pennant formation which usually signify continuation of prevailing trend. Pennants usually form after an impulsive wave which is true in our case.
With this price action, I'm only going to be interested in buying on pull back when price breaks the Weekly LH (lower High) at price of 1.056.
Likewise, if price breaks the Weekly Lower Lower (LL) at 0.668 then price would be indicating continuation of the current down trend on the Weekly timeframe. That said, let's see if the daily would give us any hint on what to expect in the short term.
Daily Timeframe
On the daily, we're currently at the impulsive phase after breaking from the corrective phase. If we don't get buy interest at the Daily Lower Low (LL) at 0.777 then we might be looking to test the Weekly LL at 0.668.
My interest to buy XNO would be if price breaks and stays above the Daily HH at 0.922 or if price breaks any structure and stays above in a future price action formation. For now, I'm bearish a XNO.
4 Hourly Timeframe
Price already broke 4 Hourly timeframe HL and now headed to the Daily LL. If the Daily LL does not hold, then we might be heading to the Weekly LL.
With this, I am fully bearish on Nano except we start seeing some Break of Structure to the up side in the coming days and week

Nano the free transactionTarget for pullback
Mark the price before btc reach 50k usd.
Its big round number to remember.
Fast, free, cryptocurrency.

XNO could appreciate dramatically!A nano price to total coin supply makes you realize really quick how fast it could move north given the right conditions and volume. Nano is by far the most energy efficient crypto on planet earth and I think this will be a big draw for users in the future.

There is massive profit potential in NANO.Not only is NANO one of the most efficient/less energy intensive coins, but it's also one of the fastest, has ZERO fees and much more. Nano is about the same price as XRP currently, but with far less coins in circulation NANO has the potential to see some massive 10X.. 20X.. moves!

Nano coin getting ready for a pump (NEW)Nano (XNO) is consolidating in a downsloping channel which most likely will break out to the upside.
We don't expect this coin to make a new ATH in the next bull market but reaching 4$ in a mid-term is very likely which would be almost 400 % profit from the current price.
It's time to DCA into XNO.


Nano (xno) where are you going? Risk reward 4.4For a long time, the asset is in the accumulation stage, and on the daily timeframe, you can see the resulting double bottom. If the resistance zone is broken through and the asset is fixed above 0.935, I expect growth to the area of $1.3
This is not a financial recommendation, everything you do you do at your own peril and risk.

NANO Major Monthly SupportNice place for DCA
here you are buying below 99% of nano holders
its a monthly major support
if this is the bottom for nano first target would be 120$ which is the 1.618% FIB level on log chart.
however keep some cash if it will go to ATL around 0.4$
low risk high reward
Thanks.

If your not buying nano right now WHY NOTSo on this big time frame we could still see minor losses like a 50% dip because of bad macro. We know the world is a mess right now. Nano is fundamentally really strong. underneath my personal chart i added pictures.

Nano $xno breakout incoming 👀Nano is forming a falling wedge (bullish pattern) breaking the upper trend = going up
NOT FINANCIAL ADVICE

NANO (XNO) coin formed bullish Butterfly for upto 781 pumpHi dear friends, hope you are well and welcome to the new trade setup of NANO (XNO) coin with US Dollar pair.
Previously we had a nice trade of XNO:
Now on a monthly time frame chart, NANO has formed a huge bullish Butterfly pattern:
Note: Above idea is for educational purpose only. It is advised to diversify and strictly follow the stop loss, and don't get stuck with trade

NANO or XNO is at the Bottom of ChannelMarket is poop, but this could indicate a potential bottom for XNO seeing how the next week or two plays out.
NANO is a long term HODL and accumlate for me, Bottom of the channel is the less risky place to buy. NFA.
Bullish divergence on RSI along with some bullish activity on total market cap will be the clear indicator for me to go long.
Just ideas of cryptos I follow and like. DYOR before investing.

NANOUSDT NANO newly named is XNO. With my previous shared analysis 35% up and still going in profit.
Greetings this chart is break the long term falling Wedge pattern upside. The expected targets is 7, 8.
Still in cheap price. To buy in every dip and hold.
I'm Not a financial adviser.
Risk at your own.

XNO/USDTesting/tracking elliot wave theory. Please do not trade off idea without S/L. Not financial advice.
Alright guys we're going to have to use our imagination here lol. Nano has rebranded into XNO and there's no chart that will show us what XNO used to look like so I've drawn it out in the white squiggly line to be as identical as it can be. Not quite sure how we're going to count these waves but it should look something like this.

NANOUSDTNano, which is recently change the token name from NANO TO XNO coin. 2MINERS are already taking withdraw in NANO/XNO with no fees.
Now here's a falling Wedge pattern on XNO. Let's wait for the breakout. The Targets are shown on chart.
Manage your own risk accordingly with that.

NANO (XNO) coin formed bullish Gartley for upto 40% rallyHi dear friends, hope you are well and welcome to the new trade setup XNO coin with US Dollar pair.
On a 4-hr time frame, XNO has formed another bullish Gartley pattern.
Note: Above idea is for educational purpose only. It is advised to diversify and strictly follow the stop loss, and don't get stuck with trade

XNO ; NANO - potential phoenix pump to catchXNO ; NANO - potential phoenix pump to catch
Nano has been a pretty bloody big dissapointment. I kept buying it in our last macro waves to get that 17 style moon pump that never came. oh my dear raibucks what happened? im still addicted to her though..
anyway..
Here is your hopium;
zoom out to see where those fractals came from and how similar the RSI impulse was/is. 3 options as i see it. the DEPTH on this pull back will show what is right. we want a strong dump to buy, a slower sleady slope down is not a good sign.
will i take the bait again if the shape is right? yes yes i will.
x

NANO - Awaiting new moveTrend looks to be weakening, perhaps we go down now.. waiting until Blue + Grey Lines to make orders though as always!
