Buy Agnico Eagle Mines LimitedShort Term Trading Advice by Naranj Capital
Buy Agnico Eagle Mines Limited
● Buy Range- 108.5 - 112
● Target- 116 - 118
● StopLoss- 104.5
● Potential Return- 4-5%
● Duration- 14-15 Trading Days
Naranjcapital
Primoris Services: A Long-Term Pick in US Energy Infrastructure◉ Abstract
Our latest analysis focuses on the booming U.S. utility and energy sector, set to hit a massive $1.1 trillion! Learn about the key drivers fueling this growth, from our increasing electricity needs and the electric vehicle revolution to the exciting rise of clean energy.
We have also given a “Buy” rating on Primoris Services Corporation NYSE:PRIM , a major player in building this energy infrastructure. Our analysis reveals their strong financial performance, attractive valuation compared to its peers, and promising technical indicators. While acknowledging potential headwinds like regulatory shifts, we believe Primoris presents a compelling long-term investment opportunity with significant upside potential. Read detailed analysis here and invest smartly.
Read full analysis here...
◉ Introduction
Imagine the companies that bring electricity to your home, the gas for your stove, and are building the future of clean energy. That's the U.S. utility and energy sector! It's a massive part of the American economy, and it's getting even bigger. By 2025, experts predict it will be worth a whopping $1.1 trillion! This includes everything from generating electricity to delivering it through power lines and pipelines, as well as distributing natural gas across the country.
This sector has been steadily growing at about 2.7% each year between 2020 and 2025, and it looks like this growth is going to continue. This article will give you a snapshot of the major reasons behind this growth, top players in this sector, and investment opportunities.
◉ Major Factors Behind the Growth of US Energy Sector
1. Electricity Use is Climbing: Americans are using more power than ever. The EIA expects electricity consumption to hit 4,205 Billion kWh in 2025, up from 4,097 Billion kWh in 2024. This surge is fuelled by increased usage in residential, commercial, and industrial sectors.
2. Everything’s Going Electric: Think about electric cars, heat pumps that heat and cool homes, and even cleaner machines in factories. More and more things are switching to electricity, which means we need even more power! This big shift towards using electricity is called electrification, and it's a major driver for the energy sector.
3. Clean Energy on the Rise: Solar panels and wind turbines are becoming a bigger part of how we get our electricity. These renewable energy sources are growing fast. By 2026, it's expected that they will provide about 27% of all the electricity in the U.S., up from around 25% in 2024. This move towards cleaner energy is really important for the future.
4. Massive Investments Ahead: To keep up with this growing demand and the shift to new technologies, utility companies are investing a lot of money. They are upgrading power grids (the network of lines that deliver electricity), building charging stations for electric vehicles (EVs), and using smart technologies to manage energy better. Experts at S&P Global predict that total spending on these things could be over $790 Billion between 2025 and 2030!
◉ Big Players in Building the US Energy Infrastructure
1. Quanta Services, Inc. NYSE:PWR : A premier provider of specialized infrastructure solutions for the electric power and oil & gas sectors. They are also heavily involved in renewable energy projects like solar and wind farms. You can learn more about them on their official website .
2. Primoris Services Corporation NYSE:PRIM : They provide construction and engineering services for the energy, utility, and infrastructure markets. They are increasingly focusing on building projects related to renewable energy. You can explore their details on their official website .
3. MasTec, Inc. NYSE:MTZ : This is a top infrastructure company in North America, working on energy, utility, and communication projects. This includes building renewable energy facilities, telecom networks, and oil & gas pipelines. You can find more information on their official website .
This report offers an in-depth analysis of Primoris Services Corporation , a prominent player in the U.S. energy infrastructure space.
Our long term recommendation is backed by Primoris Services Corporation ’s technical analysis and fundamental performance.
◉ Investment Advice
💡 Buy Primoris Services Corporation NYSE:PRIM
● Buy Range - 67 - 68
● Sell Target - 88 - 90
● Potential Return - 30% - 45%
● Approx Holding Period - 12-14 months
◉ Revenue and Profit Analysis
● Year-on-Year
- In FY24, Primoris reported revenue of $6,367 Million, marking an 11% increase from $5,715 Million in FY23.
- EBITDA grew to $415 Million, up from $366 Million the previous year, with the EBITDA margin slightly improving to 6.5% from 6.4%.
● Quarter-on-Quarter
- Q4 FY24 revenue reached a record $1,741 Million, up from $1,649 Million in Q3 and 14.9% higher than $1,515 Million in Q4 FY23.
- Despite the revenue growth, Q4 EBITDA declined to $110.6 Million from $123 Million in Q3.
- Diluted EPS (LTM) rose to $3.30 in Q4, up from $3.00 in Q3 FY24, indicating solid earnings momentum.
◉ Valuation
1. P/E Ratio (Price-to-Earnings)
● Compared to Peers:
- PRIM’s P/E is 17.9x, much lower than the peer average of 32.7x. This means the stock is cheaper than most competitors based on earnings.
● Compared to Industry:
- With a P/E ratio of 17.9x, PRIM trades below the industry average of 26.4x, suggesting it offers strong value within the sector.
2. P/B Ratio (Price-to-Book)
● Compared to Peers:
- PRIM’s P/B is 2.6x, while peers average 4.5x—again showing the stock may be undervalued.
● Compared to Industry:
- Compared to the industry average of 4.4x, PRIM still appears to be a bargain.
3. PEG Ratio (Price/Earnings to Growth)
PRIM’s PEG ratio is 0.43, which suggests the stock is not only cheap but also expected to grow earnings strongly—an attractive combination for investors.
◉ Cash Flow Analysis
- Primoris saw a strong improvement in operating cash flow, which jumped to $508 Million in FY24 from $196.8 Million in FY23—a sign of better cash generation from its core business.
◉ Debt Analysis
- With a debt-to-equity ratio of 0.42, the company maintains a solid financial position, suggesting its debt levels are well under control and not overly risky.
◉ Top Shareholders
- The Vanguard Group holds a substantial 11.6% stake in Primoris, reflecting strong confidence in the company.
- BlackRock also increased its investment by 9.65% from Q3 FY24 and now owns approximately 11.3% of the company.
◉ Technical Aspects
- On the monthly chart, the price is in an overall uptrend and has bounced off the trendline support, indicating continued upward momentum.
- On the daily chart, the price has broken through a rounding bottom pattern and is holding above the breakout zone, suggesting a potential for further upside movement.
◉ Potential Risks & Challenges
1. Regulatory Uncertainty: Ongoing concerns about global trade policies, tariffs, and regulatory changes, especially in the solar and battery storage markets, could impact future project economics and timing.
2. SG&A Expenses: Increased by $10.9 Million year-over-year, driven by higher personnel costs and $3.2 Million in severance expenses.
3. Energy Segment Backlog: Experienced a decrease due to the timing of new solar awards, potentially affecting future revenue visibility.
◉ Conclusion
Primoris Services Corporation NYSE:PRIM stands out as a promising investment, backed by consistent growth, strong financials, and a strategic focus on renewable energy and infrastructure. Despite facing risks like regulatory changes and backlog fluctuations, its solid position in the U.S. energy sector—especially with increased demand for clean energy solutions—gives it a clear path forward. With a competitive valuation and support from major investors like Vanguard and BlackRock, Primoris is poised for sustainable growth, making it an attractive long-term opportunity for investors.

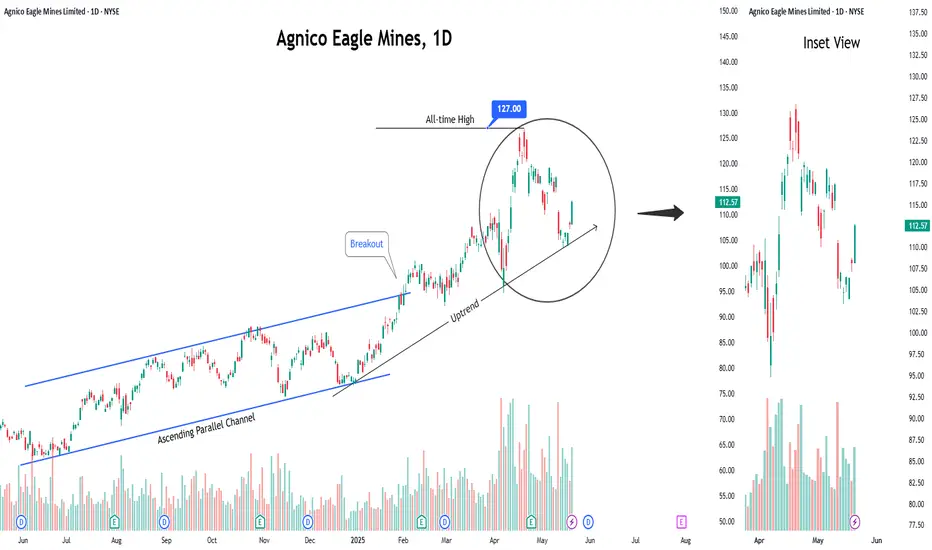
Buy Agnico Eagle Mines LimitedShort Term Trading Advice by Naranj Capital
Buy Agnico Eagle Mines Limited
● Buy Range- 116 - 119
● Target- 125 - 126
● StopLoss- 112
● Potential Return- 5-6%
● Duration- 14-15 Trading Days

Invest in STRL: Ride the Coming US Digital Infrastructure Surge◉ Abstract
Sterling Infrastructure (NASDAQ: STRL) is a top pick to benefit from America's digital infrastructure boom, with the sector expected to grow 26% annually through 2034. The company specializes in data centers, 5G networks, and smart city projects, supported by a $1 billion backlog and improving profit margins. While risks like regional market shifts and housing demand exist, STRL's fundamentals are strong—revenue grew 7% in 2024, debt is manageable, and its P/E ratio (17.9x) looks cheap compared to peers (70.5x).
Technically, the stock shows bullish patterns after pulling back 35% from highs. With government infrastructure spending rising and strategic acquisitions likely, STRL could deliver 35-40% returns in the next 12-14 months. A good option for long term investing!
Read full analysis here...
◉ Introduction
The U.S. digital infrastructure market, valued at approximately USD 140 billion in 2024, is expanding rapidly, with a projected CAGR of 26.4% through 2034. This growth is driven by factors like the expansion of 5G networks, increased demand for data centers, rising cloud services adoption, AI automation, and investments in smart cities and edge computing. The 5G infrastructure segment alone is expected to grow at a CAGR of 20.2%, reaching USD 17.26 billion by 2030. North America holds a 42.8% share of the global market.
◉ Key Trends and Opportunities
1. Data Centers: Demand continues to rise, driven by cloud computing, AI, and data-intensive applications. Power availability and location are becoming critical, with providers moving to secondary markets to secure reliable energy sources.
2. Fiber Networks: Expansion is underway to support new data centers and remote connectivity needs. Middle-mile and long-haul fiber, as well as fiber-to-the-home (FTTH), are key areas of investment and consolidation.
3. 5G and Wireless: Ongoing rollout of 5G networks is fueling growth in hardware and network densification, with increased activity expected in wireless infrastructure and tower markets.
4. Edge Computing and Smart Cities: The proliferation of IoT devices and smart city initiatives is driving demand for edge data centers and low-latency networks.
5. Mergers and Acquisitions: The market is seeing consolidation, especially in fiber and data center segments, as major players acquire smaller firms to expand their footprint and capabilities.
Today, we’ll focus on Sterling Infrastructure (STRL), a key player navigating the U.S. infrastructure market.
This report provides a detailed look at STRL's technical and fundamental performance.
◉ Company Overview
Sterling Infrastructure Inc. NASDAQ:STRL is a U.S.-based company specializing in e-infrastructure, transportation, and building solutions. It operates through three key segments: E-Infrastructure Solutions, which focuses on site development for data centers, e-commerce warehouses, and industrial facilities; Transportation Solutions, handling infrastructure projects such as highways, bridges, airports, and rail systems for government agencies; and Building Solutions, providing concrete foundations and construction services for residential and commercial projects. Originally founded in 1955 as Sterling Construction Company, the firm rebranded to its current name in June 2022. Headquartered in The Woodlands, Texas, the company serves a wide range of sectors, including logistics, manufacturing, and public infrastructure.
◉ Investment Advice
💡 Buy Sterling Infrastructure NASDAQ:STRL
● Buy Range - 148 - 150
● Sell Target - 200 - 205
● Potential Return - 35% - 40%
● Approx Holding Period - 12-14 months
◉ SWOT Analysis
● Strengths
1. Strong E-Infrastructure Backlog – With over $1 billion in backlog, Sterling has a robust pipeline of future projects, ensuring sustained revenue growth.
2. Higher-Margin Services Shift – The company’s strategic focus on higher-margin work (21% gross profit margin in Q4) improves profitability without relying solely on volume.
3. E-Infrastructure Growth Potential – Expected 10%+ revenue growth and 25%+ operating profit growth in 2025 position Sterling for strong earnings expansion.
4. Strategic M&A Opportunities – Strong liquidity allows for accretive acquisitions, enhancing market share and service offerings.
5. Share Repurchase Program – Active buybacks reduce outstanding shares, potentially boosting EPS and shareholder value.
● Weaknesses
1. Texas Market Transition Risks – Moving away from low-bid work in Texas may slow revenue growth in the Transportation segment if not managed well.
2. Revenue Loss from RHB Deconsolidation – Excluding $236 million in RHB revenue could distort growth metrics and reduce reported earnings.
3. Residential Market Pressures – A 14% decline in residential slab revenue (due to DFW affordability issues) could persist if housing demand weakens further.
4. Geographic Expansion Challenges – High costs and logistical hurdles in expanding data center projects outside core regions may limit growth opportunities.
5. Competitive Bidding & Acquisition Risks – Difficulty in securing profitable acquisitions or winning competitive bids could hinder margin and revenue growth.
● Opportunities
1. Data Center & E-Commerce Boom – Rising demand for data centers and distribution facilities presents long-term growth potential for E-Infrastructure.
2. Government Infrastructure Spending – Federal and state investments in highways, bridges, and airports could boost Transportation Solutions revenue.
3. Strategic Acquisitions – Pursuing complementary M&A deals could expand capabilities and market reach.
4. Diversification into New Regions – Expanding into underserved markets could reduce dependency on Texas and mitigate regional risks.
5. Operational Efficiency Improvements – Further margin expansion through cost optimization and technology adoption.
● Threats
1. Economic Slowdown Impact – A recession could reduce demand for residential and commercial construction, affecting Building Solutions.
2. Rising Interest Rates – Higher borrowing costs may pressure profitability and delay large-scale projects.
3. Labor & Material Cost Inflation – Increasing wages and supply chain disruptions could squeeze margins.
4. Intense Competition – Rival firms competing for the same infrastructure projects may drive down pricing and profitability.
5. Regulatory & Permitting Delays – Government approvals and environmental regulations could slow project execution.
◉ Revenue & Profit Analysis
● Year-on-Year
➖ FY24 sales reached $2,116 million, reflecting a 7.28% increase compared to $1,972 million in FY23.
➖ EBITDA rose to $334 million, up from $264 million in FY23.
➖ EBITDA margin improved to 15.8%, up from 13.4% in the same period last year.
● Quarter-on-Quarter
➖ Q4 sales decreased to $499 million, down from $593 million in Q3, but showed a slight increase from $486 million in Q4 of the previous year.
➖ Q4 EBITDA was $80.3 million, down from $105 million in Q3.
➖ Q4 diluted EPS saw a notable rise, reaching $8.27 (LTM), up from $5.89 (LTM) in Q3 2024.
◉ Valuation
1. P/E Ratio (Price-to-Earnings)
● Current vs. Peer Average
➖ STRL’s P/E ratio is 17.9x, much lower than the peer average of 70.5x, suggesting the stock is undervalued compared to peers.
● Current vs. Industry Average
➖ Compared to the broader industry average of 22.9x, STRL again looks relatively inexpensive at 17.9x.
2. P/B Ratio (Price-to-Book)
● Current vs. Peer Average
➖ STRL’s P/B ratio stands at 5.7x, slightly higher than the peer average of 5x, indicating overvaluation.
● Current vs. Industry Average
➖ Against the industry average of 3.6x, STRL’s 5.7x P/B ratio suggests a noticeable overvaluation.
3. PEG Ratio (Price/Earnings to Growth)
➖ STRL’s PEG ratio is 0.21, which means the stock appears undervalued relative to its strong expected earnings growth.
◉ Cash Flow Analysis
➖ Sterling Infrastructure's operating cash flow grew to $497 million in FY24, up from $479 million in FY23, showing steady financial strength.
◉ Debt Analysis
➖ The company's debt-to-equity ratio is 0.38, indicating a healthy balance sheet with manageable debt levels.
◉ Top Shareholders
➖ The Vanguard Group has significantly increased its investment in this stock, now owning an impressive 8.3% stake, which marks a 30% rise since the end of the September quarter.
➖ Meanwhile, Blackrock holds a stake of around 8% in the company.
◉ Technical Aspects
➖ On the monthly chart, the stock remains in a strong uptrend.
➖ On the daily chart, an Inverted Head & Shoulders pattern has formed, signaling a potential breakout soon.
➖ The stock is currently trading at about 35% below its all-time high, making it an attractive investment opportunity.
◉ Conclusion
Sterling Infrastructure (STRL) stands out as a strong investment candidate, backed by solid financial performance, a growing E-Infrastructure backlog, and a strategic focus on higher-margin projects. Its attractive valuation, healthy cash flow, and low debt levels provide further confidence in its growth potential. While there are challenges—such as market competition, geographic expansion hurdles, and economic uncertainties—Sterling’s strengths, including a robust project pipeline, strategic acquisitions, and exposure to high-growth sectors like data centers and 5G infrastructure, offer a favorable risk-reward balance. Overall, Sterling is well-positioned to benefit from the ongoing U.S. e-infrastructure boom, making it an attractive long-term investment opportunity.

Gold on the Go: Prices Set to Surge Amid Uncertainty● Gold prices have recovered from a 6.5% fall and are now trading above $3000 per ounce.
● Tariff developments and US President Trump's comments are influencing market sentiment and gold prices.
● A record $21 billion inflow into Gold ETFs was recorded in Q1 2025, indicating strong interest in gold as a safe-haven asset.
● Technical analysis suggests a key support level for gold prices between $2950 and $2960, which could impact market trends.

Head & Shoulder Breakdown: Will S&P 500 Drop Another 10%?● The S&P 500 has experienced significant volatility recently, mainly due to President Donald Trump's announcement of new tariffs.
● On April 3, 2025, the index saw a nearly 5% drop, its worst single-day loss in five years.
● The recent price action suggests that the index has broken below the neckline of the Head and Shoulder pattern, indicating a potential continuation of the downward trend.
◉ Key support levels to watch
● 1st Support - 5,200 - 5,250
● 2nd Support - 4,950 - 5,000

Euro Rises Above $1.09 Despite Tariff ThreatsThe euro climbed above $1.09, showing unexpected strength after President Trump announced 20% tariffs on all EU imports.
◉ Fundamental Rationale
● The currency got a boost because the U.S. dollar weakened. Trump’s tariffs made trade tensions worse and worried people about slower economic growth.
● Also, new numbers showed Eurozone inflation fell to 2.2% in March, the lowest since November 2024.
● This lower inflation means the European Central Bank doesn’t need to raise interest rates, making the euro more appealing to investors.
◉ Technical Observation
● From a technical perspective, an inverse head and shoulders pattern has formed, hinting at a possible trend reversal.
● A breakout above $1.095 could pave the way for stronger bullish momentum.

Buy Brinker InternationalShort Term Trading Advice by Naranj Capital
Buy Brinker International
● Buy Range- 151 - 156
● Target- 166 - 169
● StopLoss- 145
● Potential Return- 6-8%
● Duration- 14-15 Trading Days

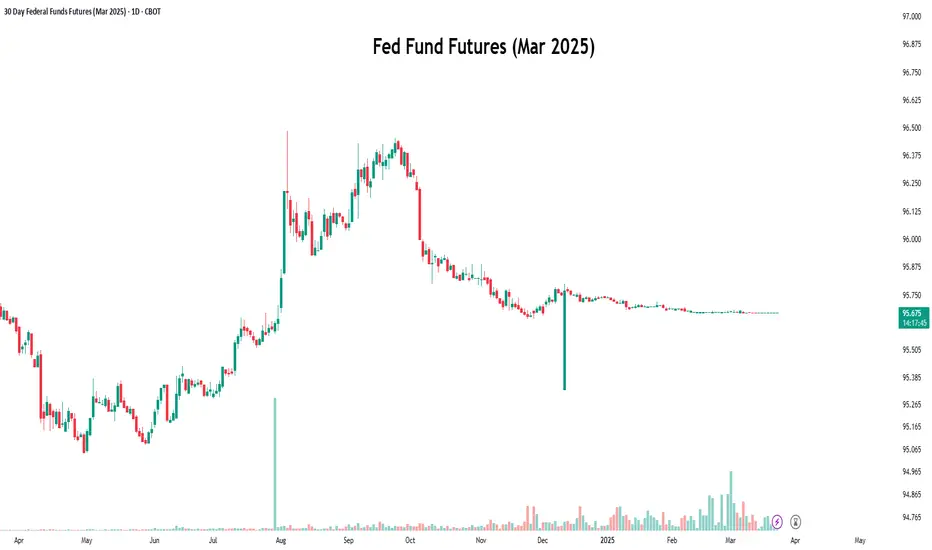
Decoding Fed Rate Changes via Federal Funds Futures Index◉ What Are Federal Funds Futures?
● Definition: Federal Funds Futures are financial contracts traded on the Chicago Mercantile Exchange (CME) that allow market participants to bet on or hedge against future changes in the federal funds rate (the interest rate at which banks lend to each other overnight).
● Purpose: These futures reflect the market's expectations of where the Fed will set interest rates in the future.
◉ How Federal Funds Futures Work?
● Pricing: The price of a federal funds futures contract is calculated as 100 minus the expected average federal funds rate for the contract month.
➖ Example: If the futures price is 95.00, it implies an expected federal funds rate of 5.00% (100 - 95 = 5).
● Contract Expiry: Each contract represents the market's expectation of the average federal funds rate for a specific month.
◉ Why Use Federal Funds Futures?
● Predict Fed Policy: Traders and investors use these futures to gauge the likelihood of the Fed raising, cutting, or holding interest rates.
● Hedge Risk: Institutions use them to protect against potential losses caused by interest rate changes.
● Market Sentiment: They provide insight into what the broader market expects from the Fed.
◉ Steps to Analyze Fed Policy Using Federal Funds Futures
● Step 1: Check Current Federal Funds Futures Prices
Look up the prices of federal funds futures contracts for the months you're interested in. These are available on financial platforms like Bloomberg, Reuters, or the CME Group website.
● Step 2: Calculate the Implied Federal Funds Rate
Implied Federal Funds Rate = 100 - Futures Price.
➖ Example: If the futures price for March is 95.5, the implied rate is 4.5% (100 - 95.5 = 4.5).
● Step 3: Compare Implied Rates to the Current Rate
If the implied rate is higher than the current federal funds rate, the market expects the Fed to raise rates. If it's lower, the market expects a rate cut.
● Step 4: Estimate the Probability of Rate Changes
By comparing the implied rates of contracts expiring before and after an FOMC meeting, you can estimate the probability of a rate change.
➖ Example: If the implied rate for March is 4.75% and the current rate is 4.5%, the market is pricing in a 25 basis point (0.25%) hike.
● Step 5: Monitor Changes Over Time
Track how futures prices change over time. Shifts in prices indicate changes in market expectations. For example, if futures prices drop (implying higher rates), it suggests the market is anticipating a more hawkish Fed.
◉ Practical Applications
● Trading: Traders use federal funds futures to speculate on interest rate movements.
● Economic Forecasting: Economists use them to predict the Fed's monetary policy and its impact on the economy.
● Investment Strategy: Investors adjust their portfolios based on expected rate changes (e.g., shifting from bonds to equities if rates are expected to rise).
◉ Limitations of Federal Funds Futures
● Market Sentiment: Futures prices reflect market expectations, which can be influenced by sentiment and may not always accurately predict Fed actions.
● External Shocks: Unexpected events (e.g., geopolitical crisis, pandemics) can disrupt rate expectations.
● Liquidity: Less liquid contracts (further out in time) may not accurately reflect expectations.
◉ Example Analysis
Let’s assume:
➖ Current federal funds rate: 4.5%
➖ March federal funds futures price: 95.5
● Step 1: Calculate the implied rate:
100 − 95.5 = 4.5%.
● Step 2: Compare to the current rate:
The implied rate (4.5%) is equal to the current rate (4.5%), suggesting the market expects no change in rates by March.
● Step 3:
If the futures price drops to 95.25, the implied rate becomes 4.75%, indicating the market now expects a 25 basis point rate hike..
◉ Why This Matters?
● For Traders: Federal funds futures provide a direct way to bet on or hedge against interest rate changes.
● For Investors: Understanding rate expectations helps in making informed decisions about asset allocation.
● For Economists: These futures offer valuable insights into market expectations of monetary policy.
◉ Conclusion
Federal funds futures are a powerful tool for analyzing and predicting the Fed's interest rate decisions. By understanding how to interpret these futures, traders, investors, and economists can gain valuable insights into market expectations and make more informed decisions. However, it's important to consider their limitations and use them in conjunction with other economic indicators for a comprehensive analysis.
Gold Falls from Peak, but Rate Cut Hopes Keep Outlook Positive● Gold prices fell after hitting a high at $3057.59 due to a stronger US dollar, making it more expensive for overseas buyers.
● Despite this, gold is set for its third consecutive weekly gain, up 0.7% this week.
● Market participants expect at least two US Federal Reserve rate cuts this year, supporting gold's long-term bullish outlook.
◉ Technical Observations
● While moving through the rising parallel channel, the price has just faced resistance from the upper boundary and is expected to have a pullback towards $2,950.
● If the price slips below this level, the next strong support is expected near $2,790.

Gold Prices Rise as Inflation Fears Subside◉ Fundamental Rationale
● Gold prices remain steady despite a strong US dollar, supported by a softer-than-expected US CPI report.
● The US CPI report showed a 0.4% rise, lower than the forecasted 0.5%, easing inflation concerns.
● Weaker US inflation data reduces the likelihood of a rate hike, making gold more attractive to investors.
● The strong US dollar, fueled by a surge in US Treasury yields, failed to dent gold's appeal.
● Prices are expected to remain supported as investors seek safe-haven assets amid economic uncertainty.
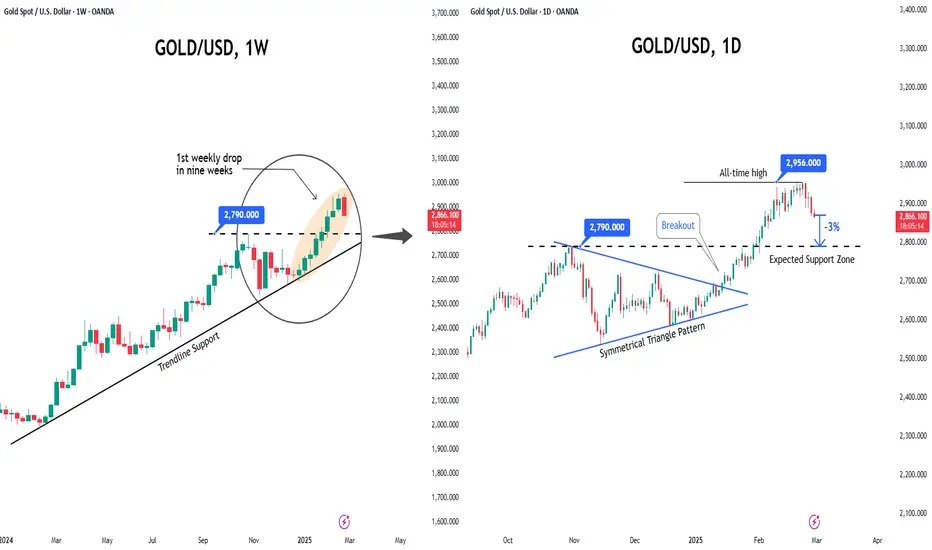
◉ Technical Observations
● Gold prices have broken free from a Symmetrical Triangle pattern and surged upward.
● Currently trading near all-time highs, the rally is expected to continue, propelling prices beyond the previous high.

Nvidia’s Sell-Off Deepens: How to Capitalize on the Decline?📉 Nvidia’s Technical Breakdown:
● Nvidia’s stock has been caught in a storm of selling pressure over the past month.
● The recent breach of critical trendline support levels suggests the downward trend could gain momentum in the days ahead, opening the door for savvy traders to capitalize on the bearish momentum.
🔄 NVDS: The Perfect Inverse Play for Nvidia’s Slide
● For those looking to navigate this decline, an inverse ETF like NVDS NASDAQ:NVDS offers a compelling opportunity.
● Designed to move in the opposite direction of Nvidia’s stock, NVDS has shown a chart pattern that almost perfectly inverse Nvidia’s price action.
● This makes it a strategic tool to potentially profit from the stock’s anticipated slide.

Oil Prices Plummet as Trade Tensions RiseOil prices took a hit after Trump's tariffs were announced, and it's essential to understand the reasoning behind this drop.
When US imposed tariffs on Chinese goods, China retaliated by placing tariffs on US goods, including oil. This move led to a decrease in oil demand from China, which is the world's largest oil importer. As a result, oil prices plummeted.
◉ Key Factors Behind the Decline
● Trade Tensions: The escalation of trade tensions between the US and China led to a decrease in oil demand, causing prices to drop.
● China's Tariffs on US Oil: China's decision to impose tariffs on US oil imports reduced demand for US oil, contributing to the price decline.
● Global Economic Slowdown: The ongoing trade tensions and tariffs have led to a slowdown in global economic growth, further reducing oil demand and prices.
● Increased Oil Production: The US has been increasing its oil production, leading to a surplus in the market and contributing to the decline in oil prices.
◉ Technical Observations
● A notable decline in oil prices has been observed since mid-January 2025.
● Prices are currently hovering near the critical support zone around $66, a level that has historically provided a floor for prices.
● If this support level is breached, it may trigger a further decline in oil prices.

Abbott and Amazon: Two Bright Spots in a Sea of Red◉ Abbott Laboratories NYSE:ABT
● The stock previously faced strong resistance near the $134 level, leading to an extended consolidation phase.
● During this period, a Rounding Bottom pattern emerged, signalling a potential continuation of the upward trend.
● Following a recent breakout, the stock has surged to its all-time high and is expected to maintain its upward momentum in the coming days.
◉ Amazon NASDAQ:AMZN
● Since August 2020, Amazon's stock has been consolidating, forming a clear Inverted Head & Shoulders pattern.
● After breaking above the neckline, the stock rallied sharply and reached an all-time high near $242.
● Following this, the price pulled back to retest the breakout level and with a successful retest, the stock is now well-positioned to resume its upward trend.

Buy Visa Inc.Short Term Trading Advice by Naranj Capital
Buy Visa Inc.
● Buy Range- 347 - 351
● Target- 361 - 364
● StopLoss- 342
● Potential Return- 3-4%
● Duration- 14-15 Trading Days

Gold Prices Take a Breather: First Weekly Decline in Nine Weeks◉ Overview
● Gold prices have risen for eight consecutive weeks, driven by safe-haven demand and a weaker US dollar.
● However, with US inflation data scheduled for release, investors are becoming cautious, leading to a decline in gold prices.
● The US inflation data will provide insight into the Federal Reserve's future monetary policy decisions.
◉ Technical Observations
● After hitting an all-time high near $2,956, the prices are now declining.
● In the weekly chart, a Bearish Engulfing candlestick pattern could be observed, indicating negative market sentiments.
● A support level is expected at $2,790, which is nearly 3% below the current market price.
EUR/USD: Ascending Triangle Formation Points to Liftoff!● The EUR/USD pair tried to climb above 1.0530 but got pushed back, slipping lower.
● However, the charts are hinting at a potential breakout with an Ascending Triangle pattern forming.
● If the pair can finally break through 1.0530, it could spark a rally toward 1.0600.
● Stay tuned; the next move could be explosive! 🚀

Buy Costco Wholesale CorporationShort Term Trading Advice by Naranj Capital
Buy Costco Wholesale Corporation
● Buy Range- 1035 - 1050
● Target- 1101 - 1110
● StopLoss- 1010
● Potential Return- 5-6%
● Duration- 12-14 Trading Days

Bitcoin Plunges Below Support: $70k Looms Amid Selling Pressure● Bitcoin has broken below its key support level of $91,000, sparking concerns of a deeper correction.
● If selling pressure persists, a sharp drop to $70,000 could be imminent.
● Market sentiment has shifted decisively bearish, reflecting growing investor anxiety.

Berkshire Soars to New Heights: Q4 Results Smash Records◉ Q4 Result Highlights:
● Berkshire Hathaway reported record operating earnings of $14.5 billion, driven by higher interest rates and a strong performance in its insurance business.
● Insurance investment income soared by 48% to $4.1 billion.
● The company's cash reserves hit an all-time high of $334.2 billion, reflecting Warren Buffett's cautious yet strategic approach to investments in a volatile market.
● Net earnings for Q4 2024 stood at 19.7billion ,down from 19.7billion, down from 37.6 billion in Q4 2023, primarily due to lower gains from its investment portfolio.
● Book value per share rose by 1% sequentially and 16% year-over-year, reaching $451,507, underscoring the company's consistent value creation.
◉ Technical Observations:
● The stock is currently in a strong uptrend, consistently achieving higher highs and higher lows.
● After a period of consolidation, the price has broken out decisively and is now trading at all-time highs.
● This bullish momentum is expected to continue, potentially driving the stock price even higher in the near term.

S&P 500's Big Drop Raises Alarm: Is a Market Correction Looming?◉ Fundamental Rationale:
● US stocks fell sharply on Friday, with major indices like the S&P 500 SP:SPX and Dow Jones Industrial Average TVC:DJI experiencing significant losses.
● The sell-off was triggered by a warning from Walmart NYSE:WMT , which raised concerns about weakening consumer demand, rising costs, or other challenges impacting its business. As a retail giant, Walmart's outlook is seen as a barometer for consumer health.
● The decline coincided with the release of consumer sentiment data, which dropped to a 15-month low, signalling growing pessimism among consumers about the economy.
● The market reacted to fears of inflation, rising interest rates, and the potential for a recession, which could further weigh on corporate earnings and economic growth.
● The sell-off was not limited to retail stocks but reflected broader anxieties about the economy and future market performance.
◉ Technical Observations:
● Following a significant sell-off of nearly 1.7%, the index is expected to find initial support at the trendline.
● If the index breaches this support level, the next strong support zone is anticipated in the range of 5,650 to 5,700.

Gas Prices Catch Fire: 25-Month High Reached Amid Winter's FuryNatural gas futures have reached a 25-month high, marking a significant price increase.
This surge is attributed to two primary factors:
1. Cold Weather: Unusually cold temperatures in key regions have increased demand for natural gas, as it is a primary source of heating.
2. Supply Disruptions: Issues in natural gas production or distribution have tightened supply, further driving up prices.
◉ Technical Observations
● After breaking out of the Inverted Head & Shoulders pattern, the price soared to $4.350.
● Subsequently, the price faced a significant pullback to around the $3.30 mark.
● However, the price rebounded from this point and is now at a 25-month high, with expectations for continued growth.

Resistance in Focus: Will Oil Prices Reverse or Fall Again?● Oil prices have been trending downward through a parallel channel. However, a crucial support zone near $70.6 has provided a rebound, sparking hopes of a potential recovery.
● Currently, the price is testing its trendline resistance, a critical level that will determine the next move. A breakthrough above this level could signal a reversal in the oil market.
● On the other hand, if the price fails to clear this level, it may indicate that the downward pressure is still too strong, and another leg down is possible.
