NQ - 1 Hour / 1C Retracement textbook
A naar perfect touch of the SELL, dipped in a few Ticks an
spet the balance of the Day heading to new and lower
Lows.
A perfect weak 1C retracement.
____________________________________________________
AAPL Breaks
TSLA Breaks
____________________________________________________
Freaky Friday ahead, with more twists and turns, but the
Operators showed their hands again today - screwing the
Dip buyers without remorse.
Tomorrow has the makings of a Black Friday as Expiry sees
the remainder of Leaps expire.
NAS

NAS100 bullish divergences - 240mIn the past 2 months there have now been 5 clear bullish divergences (price pushing lower with less momentum). 4 of them successfully resulted in fairly significant bullish moves, now just waiting to see how the 5th plays out.


Nas100 tank After successfully jumping in on this trade as per previous post. Please mark the provided supports as points of reversal. Current movement shows a a continuation to the downside. We could see a potential move to 14800.
Not a financial advice. Fun trade

GOLD Forecast 1/7Buy setup today on Gold, we are looking for price to bounce at 1789 and retrace into 1810-1813.
As long as the C wave is holding and price does not close below the previous low this set up will be valid. Once price has retested this zone and trends upwards, then our target is the previous point of control around 1813. Our stop is tight as NFP is today and is placed at 1784.
Enjoy & Happy New Year everyone, lets aim for another historical year in the marketplace.
^_^

NAS action reactionPitchforks to frame PA
My stylised path is shown
But we will see how the situation evolves
GRI 2022

NASDAQ 100 BIG MOVEI think that nasdaq 100 is going to jump back up
Firstly wait for stop hunt and then trade channel breakout to the upside.

Best places to go long or short the NasdaqHaven't shared anything in a while, so I'd like to start with a simple idea.
Buy the dip anywhere between 15000-15350. 15180 is the optimal place.
Sell the rip anywhere between 16880-17400. Optimal place doesn't exist.
Good luck!

It's going to be worse than anything we seen our generation. I believe the history will repeat itself. Nobody knows how it will happen but the best thing for anybody to do is to diversify.

LONG 16500NAS & 4800SPX: 17500 & 4950 TARGET FOLKSrisk on baby
we mooonin rn
qlt dont miss
stops? none
dailies BELOW 16350 is bigly bear flag.. spx dailies BELOW 4740 (previous ath) is bigly bear too. these levels SHOULD hold on daily at worst we get a low wick into them. daily closes below is invalidation flag
time frame 15-60days
17500-18k
4950-5050 is the TP zone.
this is 7/1RR folks. noone handing yall these kinda MOOON set ups baby!

Where to find support during the sell-offs? When it pulls back in the future, look for support behavior at these 2 trend lines.

NAS SCENARIOOutlook for NAS.
-
Weekly: Nas had a nice big pullback on the weekly, perfectly testing and rejecting the 50%. It caught some liquidity and currently it's making it's way up again.
-
Daily: After that nice H&S pattern we can see liquidity being caught at the zone below the 50% fib, rejection and a perfect retest on the 50% on the daily aswell. I can see this being a major pivot point.
-
4H: We can see the downtrend/major pullback very clear here, currently nas is making up moves after catching liquidity.
if nas breaks the 61.8%, then I would like to see an ABC pullback correlating with the fib, creating a higher low. Indicating a shift of trend before looking for buy opportunities.
-
Let me know your thoughts, link your outlooks in the comments below.

Nas100 Weekly Breakdown: Reading charts like a pro📈📉Hello friends,
Today I have decided to share with you what I look for in the market and what helps me to predict market movements. In this idea, I have used Nas100 as an example. I am sharing this for educational purposes and also to shed light on the current market structures as well as future movement of Nas100. Some of you might find this beneficial and others won't. It doesn't really matters. Hahahaha.
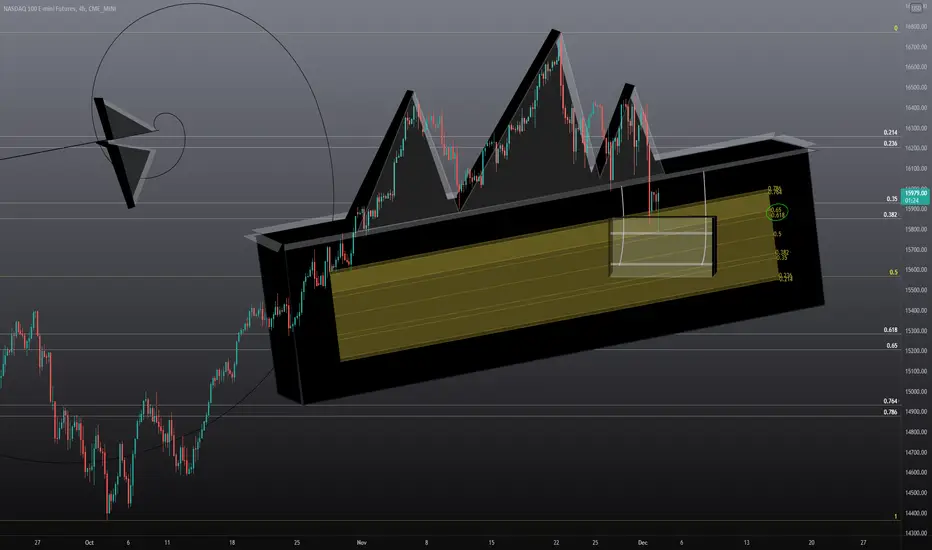
First of all, we see that Nas100 printed a head and shoulders pattern the past weeks. What exactly is a head and shoulders pattern? According to Wikipedia: "Head and Shoulders formations consist of a left shoulder, a head, and a right shoulder and a line drawn as the neckline. The left shoulder is formed at the end of an extensive move during which volume is noticeably high. After the peak of the left shoulder is formed, there is a subsequent reaction and prices slide down somewhat, generally occurring on low volume. The prices rally up to form the head with normal or heavy volume and subsequent reaction downward is accompanied with lesser volume. The right shoulder is formed when prices move up again but remain below the central peak called the Head and fall down nearly equal to the first valley between the left shoulder and the head or at least below the peak of the left shoulder. Volume is lesser in the right shoulder formation compared to the left shoulder and the head formation. A neckline can be drawn across the bottoms of the left shoulder, the head and the right shoulder. When prices break through this neckline and keep on falling after forming the right shoulder, it is the ultimate confirmation of the completion of the Head and Shoulders Top formation. It is quite possible that prices pull back to touch the neckline before continuing their declining trend." That make sense doesn't it?
For a head shoulders pattern to be completed, it should have a left peak (shoulder), top peak (head), right peak (shoulder) and a neckline. A neckline needs to be broken (sometimes retested) to validate the pattern and to ensure that the next impulsive move is likely to occur.
Let's look at the psychological human behavior behind the head and shoulders pattern (in this scenario, I will use the head and shoulders top like the one we currently see on Nas100). This will also help us to understand if this is a real head and shoulders or fake one (there can be fake ones that can give wrong signals, hahahaha). This will also help us to understand what really is in the in mind of traders both institutional traders and retail traders.
Please pay attention to my two arrows label X and Y.
X- Price rallied high and it did so strongly (the market moved very rapidly without resting and for sure people that bought during that time had big fat smiles😁). Now that is what we call an Impulsive Wave. Price pushed up, and from the neckline price began to take a break from a long run and it printed the Left Shoulder which can also be said as the higher high. Again, price pushed up and formed the head which can also be said as another higher high, this peak is higher than the previous high. Oops, that is the last time we saw buyers flexing their muscles. Sellers stepped in, pushing price to the neckline and from there buyers weren't strong enough to push price back to where they were brought from (head), instead sellers kept price at the same level as the left shoulder, which sponsored a strong reaction that violated the neckline and that became bears victory (a break of the neckline).
What is next for us? Since the neckline has been broken, how far should the fall be? Now here is where we get different answers. Some would tell you, first impulsive wave I labelled X is a shadow of what is to come, meaning what we should expect is the same impulsive wave to be printed at point Y, same length as X. It can make sense to some but it won't be to others. Here is a thing, whatever makes money for you is all what matters. What other people think is basically none of my business (sorry)😁, As long as the money is made. Right?
Yes!
We do not want to blindly follow what is in the books, what is taught and what is on the internet. We need to develop the mind of understanding and interpreting the current price action in the market. If we can do so on our own, that is maturity. Look at the market like you would look at a friend, you would understand and interpret your friend's feelings and emotions, when he is sad and when he is happy. The market, this thing called the financial market is dramatic, but if we only sit and try our best to understand and of course interpret the current mood in the market we can reap some measure of success.
Do you enjoy this article? Do you want me to share many of this? Show me you do by hitting that like button. If you find this boring please be kind to tell me why, I will improve.
Wishing everyone the best this week.
Forexintelligence

Could be wrong... but buying the support on $NAS could be smartFacts don't always translate into reality, but the facts are here for the $NAS
statistics of head and shoulders patterns
- In 93% of cases, the exit from the head and shoulders pattern is bearish.
- In 63% of cases, the price reaches the objective of the head and shoulders pattern when the neck line is broken.
- In 96% of cases, the bearish movement continues at the break in the neck line.
- In 45% of cases, after exiting, the price makes a pullback in resistance on the neck line of the head and shoulders pattern.
Notes on the head and shoulders pattern
- The longer the movement before the formation of a Head and Shoulders (H&S) pattern is, the more forceful the bearish movement at the break of the neck line will be.
- The more abrupt the movement before the formation of a Head and Shoulders (H&S) pattern, the more forceful the bearish movement at the break of the neck line will be.
- Head and shoulder patterns with an upward neck line offer better performance.
- If the left shoulder is higher than the right shoulder, the head and shoulder pattern offers better performance.
- After exiting the head and shoulders pattern, pullbacks in resistance on the neck line are detrimental to performance.

NQ1! - Sixty-Five Pattern Break Target Support in 3DIn a 4h Bear Flag Nas produced a hammer off the LBB. The 8 EMA is above at 16060.
Nas100 might rise to 16400 to complete the wedgeWe should expect further consolidations between 16000 and 16400 to complete the broadening wedge. There's high possibility that Nas100 will rise to complete the broadening wedge formation to the top side. A break above the wedge will attract more buying pressure and send price higher to 17000.00 and on the other hand, failure for bulls to break above the wedge, will attract more selling pressure and Nas100 will remain vulnerable to more weaknesses.
We should continue to monitor price and further developments while being vigilant with our positioning, following a very good trading plan.
Please support this idea with likes and feel free to share your opinion in the comment section below.

NASDAQ 100 STILL GOING LONG!I believe that nasdaq will return to highs again.
even though this covid variant came out.
Or it can drop more, I might be wrong.

Nasdaq 100 bottomed with wave 4 to continue the upmoveWave 4 bottom just short of the wave 1 invalidation
Now it seems Ndx100 moves up to complete 5 in (3)
Then comes (4) and (5) to complete next year it seems

NQ1! - Opex Week - Mr. Powell or Mr. BrainardThe Federal Reserve Chair will be assigned by President Biden before Thanksgiving. Will the announcement arrive during Opex Week? This is the wildcard in the market. NASDAQ found resistance, after a morning tech rally fueled by AAPL, TSLA, and MSFT, at the 2h MBB, returning to set-up at the 8 EMA. Two Bearish Patterns to watch in the form of a Rising Wedge and H&S. NVDA had great earnings for the sector leader. The 10 year note and BTC have consolidated, with the note sitting just under the 16 mark at 1.585.

NAS Island Gap down above 1 yr bull channelDown move is obvious. Overbought conditions, RSI maxed out about 1yr bull channel. 3 red days in a row. etc.
Perhaps a B move, but if it's shallow the short is on.

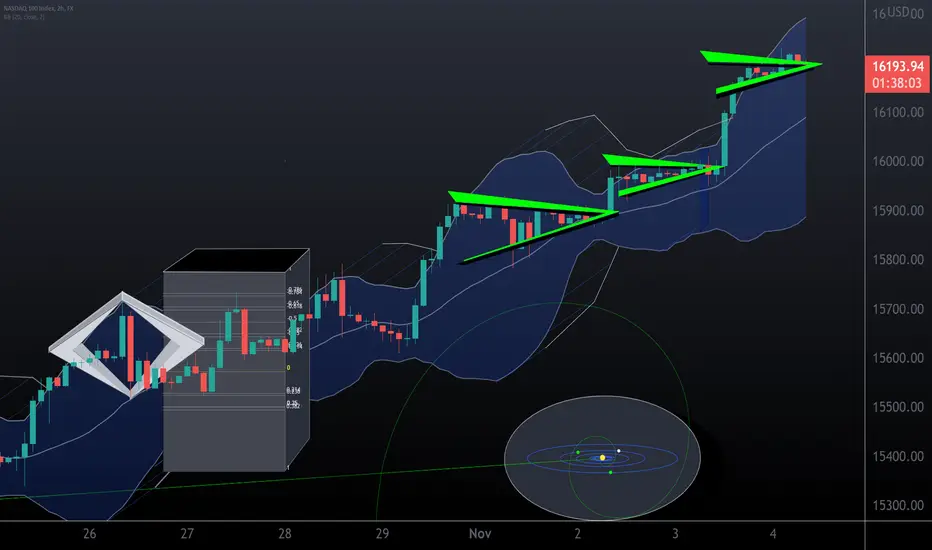
NAS - 3 Wedges - Time to Pause, Recharge, and Take StockAs the run continues into blue skies, NQ1! is supported by the 2 hour 8 EMA. Watching for RSI divergences on new highs as price has overthrown the third wedge. The 10 Year Note set a 4 Hour Higher Low. The melt-up is on until a clear reversal pattern breaks and is back-tested on the 4 hour frame. For me it is time for a break, to step away from the creative pursuit of publishing Technical Art, and to focus on finding the space within the present moment. The digital world has brought so much good, and to keep it positive great care must be made to sow balance. I wish you all best in the last two months of 2021.
NAS | Norwegian Air Shuttle | LongEntry Range: 10.374 - 9.902
Avg. Entry: 10.022 (RRR: 2)
1st. Profit Target: 11.270
Stop Loss: 9.404
HOW TO ENTER MY TRADES
1. Ladder your entries.
You'll want to ladder place your orders exponentially within the Entry Range to the point your RRR is atleast 1.5 if fully filled.
2. Only first touches are valid.
If price is rebounding back into the entry zone after either the profit target or stop loss was hit the entry zone is no longer valid
