NASDAQ Analysis The market is currently consolidating. A break to the upside we can see price move to 13738- 13916. A break to the downside price will come to 13472, a break of this we may see price come further down to 13328.
50% Off courses are back again for those who want to learn and grow.
NAS

NAS100 reaches 13600 as analysedHi guys,
From the last analysis nasdaq has reached 13600 as I had analysed. Got some really nice messages from you guys who did take the trade and made a good profit.
As we can see now the market may come back for a pullback to around 13400-13300 before continuing to previous high and highly possible of making a new high. However if the market break 13300 to the downside then we may get a deeper pullback to 13072 before going back up again.
50% Off courses are back again for those who want to learn and grow. See details below.

Nas Long to go retest the highs.Good morning traders in this analysis I am looking to take long on the Nasdaq100 because the Nas has impulse incredibly hard to the upside so what i am looking to do is I am waiting for a bit of a pull back to go create a valid support level then i will wait for the highs to be broken in order to go and impulse to retest the highs found 400 points away which will be an amazing opportunity to go retest highs and ride the next bullish wave.


NAS .382 Channel Reswedge break! the target is not a suggestion it will reach those levels; it is a reference point for where we are in the break.

Will Nasdaq rally continue??After a beautiful run yesterday will nasdaq continue going? We may see some pullbacks now and the continuation of the trend. The price may pullback to anywhere between 13090- 13015. However if the market decides not to pullback and just continue our bull targets are 13400-13600.

NAS at key resistanceRan to the 2 hour 2nd dev UBB in the overnight session - finding resistance there. Interesting day with infrastructure and tax increases. watching for a break and back test. being aware of the power fade that remains embedded in the price action against resistance.

Nebulas (NAS) Now Fully Ready... Enjoy! (115% Profits Potential)NASBTC (Nebulas) managed to conquer MA200 daily which means we are ready!
Q: Ready for what?
A: Ready for growth.
Now that NASBTC is trading above the MA200 black line, we can easily see a strong move develop on this chart.
Here I am mapping 115% as our main target, but there can surely be more mid and long-term.
This is not financial advice.
Thanks a lot for your support.
Namaste.

Nasdaq Analysis Currently the market is at the bottom of this little trend. If it breaks down we can see price come down to 12780-12680. If the pice does bounce from this trend then it will go to 13000-13084 (which is likely as it looks like a retracement and the bulls will continue. There has been a lot of long wicks recently with lots of fake breaks. Market is very unsteady and choppy so do be careful.

NAS- Compressing RangeNAS has support off the 2 hour 8 EMA and a clear support level at the 8 hour neckline of the past H&S. Looking for the range to compress more - then April

NASDAQ Triangle Formed Hope you all had a great weekend.
On the daily TF we can see nasdaq has formed a triangle and it it almost at the end of the road where it is about to break. We have had many attempts of break to the upside and downside but it failed. Hopefully today we will get a close outside this triangle. If the bulls do come in our target will be 13292 and above. If the bears do come in then we can see price drop to 12354.

StockMarket Update (#12) : Still Squeezing Prices !Hope this idea will inspire some of you !
Don't forget to hit the like/follow button if you feel like this post deserves it ;)
That's the best way to support me and help pushing this content to other users.
Kindly,
Phil

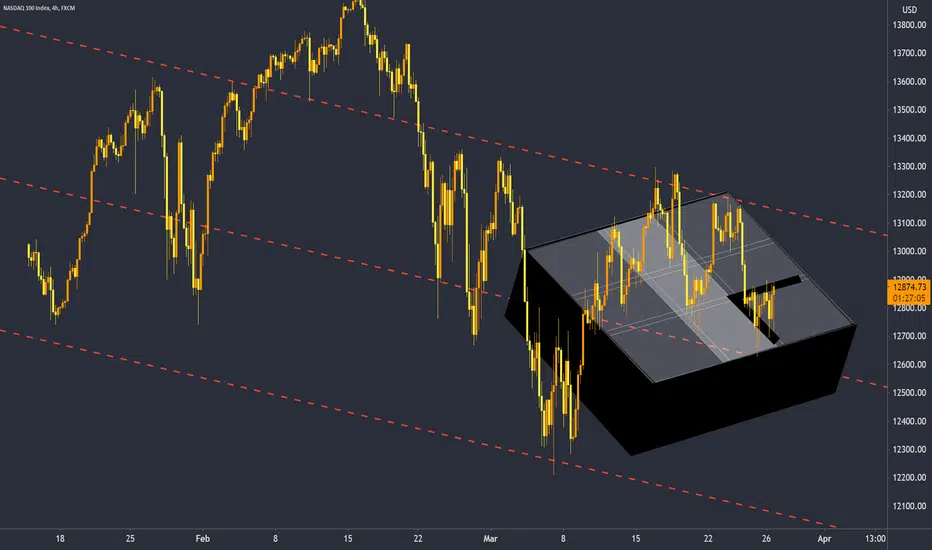
NAS - 4 hour broadening wedge - in 3DLooking to test the upper trend line. The reaction should help give a clue as to whether this is a breakout or bear broadening wedge.
NAS - Price CompressionThe confirmed H&S that failed to follow-through to the 100% downside target left a wake in it's path. Now we are seeing price compression at the neckline; with the apex lining up first half of April. Now, waiting for the break and backtest. The NAS remains below the 2 hour 50 SMA in the shadow of the triple top. The toppy patterns are repeating on the 5 min frame.

NAS - Record a LL - with a sense of humornot funny, as tech refuses to leave the resistance zone. Inside bar tomorrow with a spinning top candle stick to end off the week? Nio had a nice bounce today under the short sellers restricted list and was tied directly to the NAS albeit supercharged on the up moves.

Nasdaq will it continue its sell rally We had a very good bearish run yesterday. As I analysed couple days ago it has come to 12780 one of the key areas, see previous posts. Before we get excited and jump into more sells we should see what is happening. The market has been consolidating last couple weeks between 13174- 12780 which you can see more clear on the daily. So for the bears to continue its rally we need a break of 12780 to the downside. If not price may continue towards 13174 and attempt a break there toward the upside.
🔴 50% off this week on the NASDAQ Course. Limited time. see below for link and promo code

NAS - Back to the line in the sand12804.60 will be on watch overnight. NAS is now operating under the daily MBB and 8 EMA. The daily 50 SMA is now well above at 13200. For this market to turn around this week it is key to hold support we are at.

$NAS - GO LONG NOWTHE RETRACEMENT WAS EXACTLY TO THE 62% DISCOUNT. It Should get any lower than 13062.
Ifi t dies thn=en this is a completely failed plan. just fyi.

NAS - Right Shoulder Remains in Play, Embedded iH&S Time to scenario plan around bull break catalysts. NAS is in a 5 min bear flag, being walked-up by and algo off the 5 min 8 EMA.

Divergence trade on H! NAS 100 Divergence on H1, wait for 50-61% retracement from current support to form a lower high to break bullish structure. Sell at LH target next consolidation

NAS - mini cup and handle editionFed speakers to congress today, scouting a break of the cup and handle for bull plays.

Nasdaq very bullish We had a nice bullish rally yesterday taking price very close to my analysis 13200- Priced reached 13170. The price then did retrace a bit and today I am expecting price moving back up taking price to 13200-13300. However if the price starts to drop before 13020 then we may see bears coming in pushing price back down 13780 level.
Also on the daily you can see the box I have drawn where I want the price to be coming then it will be a battle for breaking this trend to go to the upside or fall back down.
🔴 50% off this week on the NASDAQ Course. Limited time. Get in touch now

Will Nasdaq make a new high ? Hi Everyone,
Hope you all had a great weekend.
I Will start with the higher timeframe today as it is very important to see what is happening. Today we will get a weekly candle close and we are at the crutial area again where we really need the candle to break the resistance area of 12940 on the weekly timeframe. The last 3 weeks it's attempted each time but failed. If we finally get this break nothing is stopping nasdaq to reach a new high. As for the daily time frame we can see the trend is still very bullish. And bulls do come in it will take price to 14000 and above which I will add as we progress. So today our concentration will be around this 12773- 13202 area.
🔴 50% off this week on the NASDAQ Course. Limited time. Get in touch now
