NASDAQ 100 Analysis Nasdaq broke the falling structure last week towards the upsides, we saw the price come back down to retest the previous structure and then went back up. We have come to a very strong resistance area 13079, which really needs a break for the market to continue. For the bulls a break of 13079, nasdaq will continue to 13320-13885.
However if market does fail to continue going up we can see price come back to the strong support area of 12767. A break of this level will get the bears back and we can see price coming down to 12500-12241
50% off this week on the NASDAQ Course. Limited time. Get in touch now.
NAS


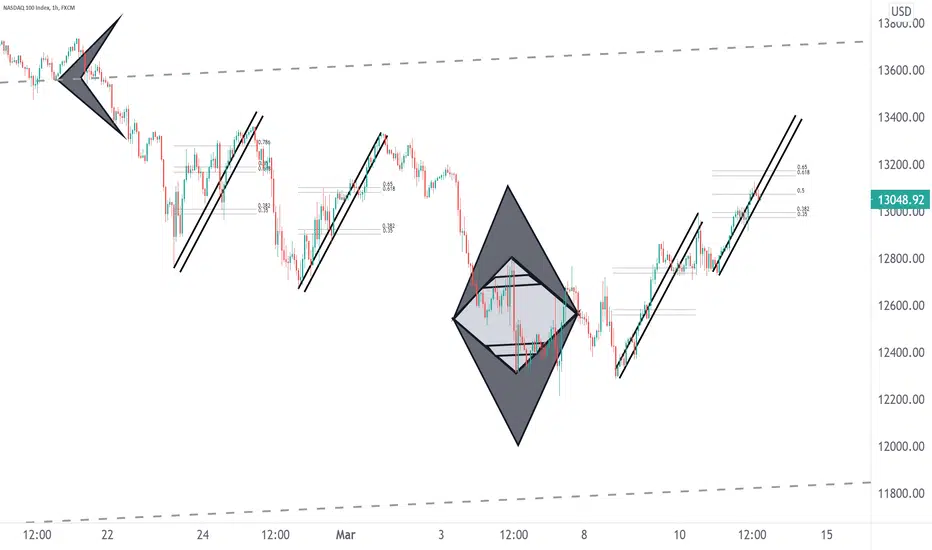
NAS - Repeating Slopes - A Linear Fib ToolToday's move in NAS found the halfway point for resistance when compared to the last two bull moves. The 2nd and 3rd bull moves were nearly identical, with the first overthrowing the .786
NAS - Risk/Reward Tool - In EQHere is a look at how I see our current, short term (till 4:00 EST) risk/reward. There are always two narratives.
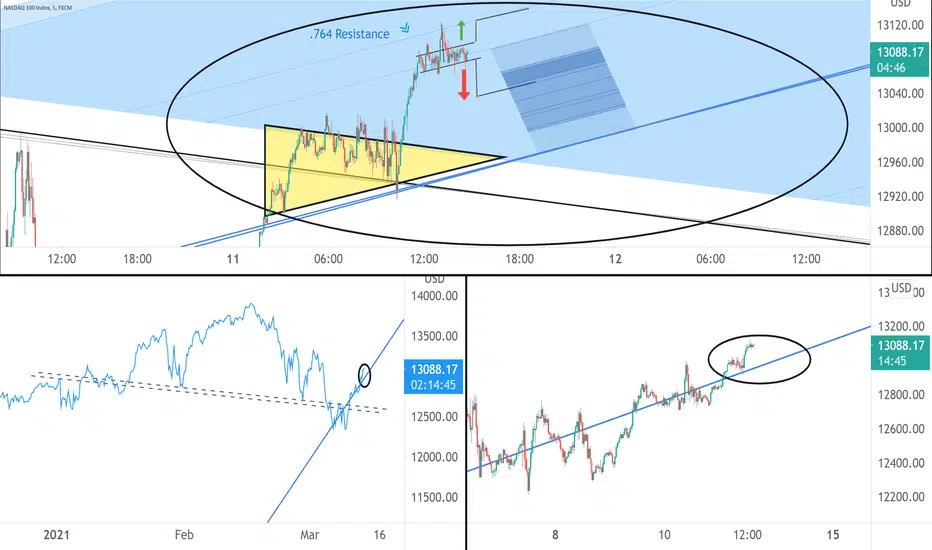
The MBB in 3D - Featuring the 4 EMANAST esting the 2 Hour UBB after catching the algo on the 5 min 4 EMA @ 10:35. Support off the 5 min MBB


NAS100 Analysis The market has finally broken out of consolidation and broken through market structure. We may now get some retest before the market continues with its bullish trend. I'm looking for 13295 as the next target as soon as we break from this little resistance at 13000. Right now I wouldn't look for any sells as this market is overall a bullish trend.
Nasdaq is a very difficult stock to trade, if you know the tricks it can be very simple and easy. A lot of people lose money on nasdaq because they don't know how to trade it. If you want to learn then do get in touch. Details found below. Please dont trade nasdaq like forex you will lose all your money. Master it and you will make so much money. Nasdaq moves so much in a day it can easily make you thousands


The MBB in 3D - An experimental design Short Covering day as NAS is melting up. Seeing Price Action and patterns in 3D provides depth.

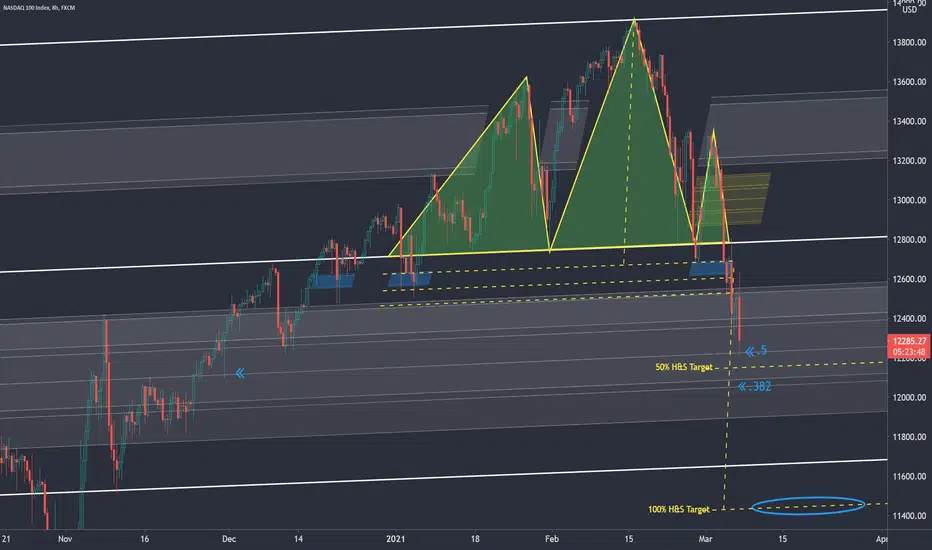
NAS - 8 HR H&S Update - Backtest of Necklinethe selling has cooled with NAS looking to break-out of it's hourly, week long, bear flag. 10 note auction tomorrow. This pattern will likely create some overhead supply to top -fish in the coming weeks.

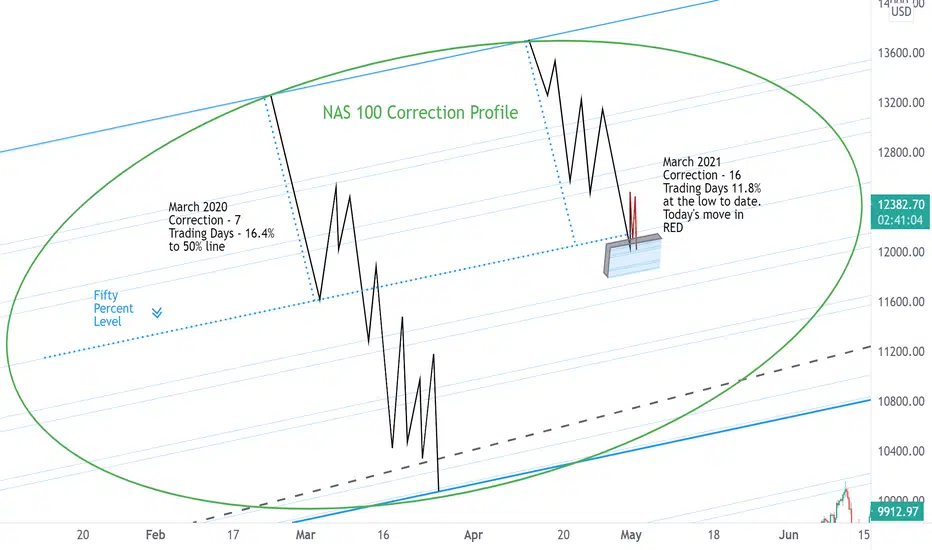
NAS - Correction Profile - March 2020 - March 2021played to a draw today. The .5 is the line in the sand..
NAS - Afternnon Head and Shoulders ConfirmedNAS continues to work through the confirmed 8 hour H&S . Echoes of the pattern are moving through technology with multiple confirmed H&S patterns on the board. On the right side of the screen shows NAS price fade off the channel fib bumper and roll-over, onto the consolidation channle. On the look out for premarket liquidity rampsand subsequent distribution at the bell.

10 Year vs. NASWill the FED step in - my homework is to study the YCC strategy for controlling the yield curve. Top catalyst on watch.

NAS - Losing .618 SupportThe larger H&S influence, based on the price action is in play (next slide)

NAS - Inverse UpdateSet a secondary neckline with a rejection of the Red Channel .35. Fast market. Pops being faded and fades being bought. The primary neckline is my top watch as the 10 year challenges 1.6 (1.599)


NASDAQ- AT A VERY IMPORTANT KEY LEVELHi Guys.
Hope you all been well. I had a week off screen hence there has been no analysis.
We will start with the weekly and daily analysis as its very important to know what is happening in the higher timeframes. Currently lower t/f is very bearish however the higher timeframes are bullish. Lets start with the weekly first.
On the weekly T/F we can see price has reached centre trend line and a very strong support area, we really need a break of this level to get a deeper pullback. A break off this centre trend line and 12266 we can see the price coming down all the way to the next key level on the weekly which is 11009. Overall this will still be a bullish trend so the price will most likely respect this level and we will get another bullish rally taking prices to new highs
Lets have a look at the daily, as mentioned we need a break of 12266, we already had an attempt last week which failed, we are currently on the road to attempt it again. if we achieve this our next target on the daily will be 11803 next key level on the daily.
All the best guys.
P.S. All those who messaged me regarding the course I will be getting back to you all today and yes I am currently giving offers to help serious people to learn and grow.

NAS - H&S on watch - in 3Dat a crossroads - The open tomorrow will be telling - 10 year bond on watch - setting a new high at this hour (1.589%)

NAS - Deep Dive - Bounce at 50% Level of March 2020 CorrectionThe NAS saw it's strong bounce on Friday at a level that coincides with the halfway point of last year's bear market drop. Taking half as many trading days as the fear based sell-off in 2020; this years rotation driven (and now rate increase driven) correction took twice as many days. With the stimulus package passing all eyes turn to the 10 year note. A sharp rise to 2% in response to the spending bill will have me looking for another leg down before it is time to go shopping. The premarket ramps have been liquidity events to sell into. This pattern will need to end to have confidence in the bull market. The overall Head and Shoulders pattern on the NAS that encompasses all of 2021 has significant room to the downside.

NAS - Fade Edition - .5 Channel SupportThis may take a few days to resolve, the high multiple growth names have been reduced significantly. 10 year at 1.563%. NAS correction at 12%, a bit over halfway to a bear market. The bounces have been weak so far (not that it can't change on a dime) ..time for an early weekend.
Market Morning Update - NAS on a FridayFriday - statistically my worst trading day due to the options and Opex expirations. The allure of the big win can go bad so quickly - basically you must be correct to play this high risk way. The solution - play next weeks expiry or size lotto. Today NAS has Purple Channel support at the .764. The 10 year set a new high and while the non-farm payroll beat big. The intial reaction was bear followed by buy the dip. SPX nearing it's hourly 50 MA while NAS is showing continued relative weakness.
