NQ1! "E-Mini Nasdaq 100" Index Market Bullish Robbery Plan🌟Hi! Hola! Ola! Bonjour! Hallo! Marhaba!🌟
Dear Money Makers & Robbers, 🤑 💰💸✈️
Based on 🔥Thief Trading style technical and fundamental analysis🔥, here is our master plan to heist the NQ1! "E-Mini Nasdaq 100" Index Market. Please adhere to the strategy I've outlined in the chart, which emphasizes long entry. Our aim is to escape near the high-risk Red Zone Level. Risky level, overbought market, consolidation, trend reversal, trap at the level where traders and bearish robbers are stronger. 🏆💸"Take profit and treat yourself, traders. You deserve it!💪🏆🎉
Entry 📈 : "The heist is on! Wait for the MA line breakout (20500.00) then make your move - Bullish profits await!"
however I advise to Place Buy stop orders above the Moving average (or) Place buy limit orders within a 15 or 30 minute timeframe most recent or swing, low or high level for Pullback entries.
📌I strongly advise you to set an "alert (Alarm)" on your chart so you can see when the breakout entry occurs.
Stop Loss 🛑: "🔊 Yo, listen up! 🗣️ If you're lookin' to get in on a buy stop order, don't even think about settin' that stop loss till after the breakout 🚀. You feel me? Now, if you're smart, you'll place that stop loss where I told you to 📍, but if you're a rebel, you can put it wherever you like 🤪 - just don't say I didn't warn you ⚠️. You're playin' with fire 🔥, and it's your risk, not mine 👊."
📍 Thief SL placed at the recent/swing low level Using the 4H timeframe (19600.00) Day/Swing trade basis.
📍 SL is based on your risk of the trade, lot size and how many multiple orders you have to take.
🏴☠️Target 🎯: 21500.00 (or) Escape Before the Target.
🧲Scalpers, take note 👀 : only scalp on the Long side. If you have a lot of money, you can go straight away; if not, you can join swing traders and carry out the robbery plan. Use trailing SL to safeguard your money 💰.
💰💵💸NQ1! "E-Mini Nasdaq 100" Index Market Heist (Swing Trade Plan) is currently experiencing a neutral trend there is high chance for bullishness,., driven by several key factors. .☝☝☝
📰🗞️Get & Read the Fundamental, Macro economics, COT Report, Geopolitical and News Analysis, Sentimental Outlook, Intermarket Analysis, Index-Specific Analysis, Positioning and future trend targets with Overall Score..... go ahead to check👉👉👉🔗🔗🌎🌏🗺
⚠️Trading Alert : News Releases and Position Management 📰 🗞️ 🚫🚏
As a reminder, news releases can have a significant impact on market prices and volatility. To minimize potential losses and protect your running positions,
we recommend the following:
Avoid taking new trades during news releases
Use trailing stop-loss orders to protect your running positions and lock in profits
💖Supporting our robbery plan 💥Hit the Boost Button💥 will enable us to effortlessly make and steal money 💰💵. Boost the strength of our robbery team. Every day in this market make money with ease by using the Thief Trading Style.🏆💪🤝❤️🎉🚀
I'll see you soon with another heist plan, so stay tuned 🤑🐱👤🤗🤩
NASDAQ 100 CFD

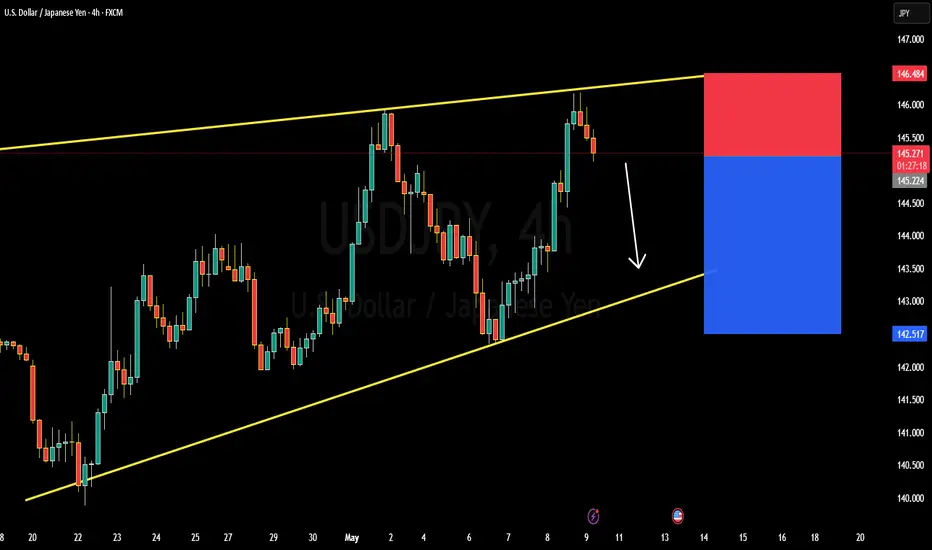
USDJPY BULLISH OR BEARISH DETAILED TECHNICAL AND FUNDAMENTALSUSDJPY is currently trading around 145.300 and showing clear signs of bearish pressure from the upper resistance of a broad ascending channel. The market structure suggests a potential rejection, and price action confirms the formation of a rising wedge pattern—a classically bearish setup indicating an upcoming correction. With momentum slowing and sellers starting to step in, I anticipate a move toward the 143.500 zone as price seeks support near the lower trendline.
From a fundamental standpoint, the US dollar is experiencing slight weakness today following softer-than-expected jobless claims data and a cooling CPI projection. Meanwhile, the Japanese yen is finding strength from renewed risk-off sentiment and speculation that the Bank of Japan may subtly shift its ultra-loose stance if inflationary pressures persist. This macro backdrop adds more weight to the potential downside in USDJPY over the next few sessions.
Technically, the price has tested the 146.000 resistance zone multiple times but failed to break above it with conviction. This repeated rejection near the top of the channel adds credibility to the bearish outlook. A breakdown from the rising wedge would likely accelerate selling pressure, pushing USDJPY toward the 143.500 level, which aligns well with previous demand zones and the channel’s lower boundary.
I’m closely watching for confirmation below the 145.000 level, which would act as a trigger for short positions. With risk-reward favoring the bears and fundamentals aligning with the technical setup, this is a solid opportunity for those looking to capitalize on a potential pullback in USDJPY.
Hanzo : NAS100 15m: Bullish Confirmed After Liquidity Trap Nas100 – Hanzo’s Strike Setup
🔥 Timeframe: 15-Minute (15M)
——————
💯 Main Focus: Bullish After Break at 19950
We are watching this zone closely.
👌 Market Signs (15M TF):
• Liquidity Grab + CHoCH at 19930
• Liquidity Grab + CHoCH at 19650
• Strong Rejections seen at:
➗ 19750 – Major support / Key level
➗ 20100 – Proven resistance
Hanzo : NAS100 15m: Breakout Zone Confirmed After Liquidity Trap

GBPJPY BULLISH OR BEARISH DETAILED ANALYSISGBPJPY is currently trading near 192.100 and has successfully broken out of a falling wedge pattern on the 12-hour chart. This classic bullish reversal structure indicates that buyers have regained control, with momentum building for a potential move toward the 197.400 target area. The breakout candle is strong and well-formed, confirming upside interest after a period of consolidation and price compression.
Fundamentally, the Japanese yen remains under pressure due to the Bank of Japan’s continued ultra-loose monetary policy, while the pound is gaining support ahead of this week's Bank of England rate decision. Traders are pricing in cautious optimism from the BOE as inflation persists, which adds strength to GBP. The divergence in policy stance between the BOE and BOJ creates a favorable environment for GBPJPY bulls.
Technically, the falling wedge breakout is happening in line with higher lows and sustained buying volume. The 190.000 region served as a strong support base, and the breakout above wedge resistance around 191.800 now turns that area into support. The next key resistance sits at 195.000, with potential extension toward the psychological zone of 197.400.
This setup aligns with a trend continuation following the recent impulsive wave, and the risk-reward profile remains attractive for swing buyers. As long as GBPJPY holds above 190.800, the upside thesis remains valid. Keep an eye on UK rate sentiment and BOJ updates to support this technical play.

Hanzo : NAS100 15m: Breakout Zone Confirmed After Liquidity Trap🆚 Nas100 – Hanzo’s Strike Setup
🔥 Timeframe: 15-Minute (15M)
——————
💯 Main Focus: Bullish After Break at 19950
We are watching this zone closely.
💯 Main Focus: Bearish After Break at 19715
We are watching this zone closely.
———
👌 Market Signs (15M TF):
• Liquidity Grab + CHoCH at 19930
• Liquidity Grab + CHoCH at 19650
• Strong Rejections seen at:
➗ 19750 – Major support / Key level
➗ 20100 – Proven resistance

NASDAQ (NDX) Market OutlookCurrently, the NASDAQ is trading around 19,723. We're anticipating a short-term pullback toward the 19,462 level, where a significant pool of liquidity awaits. This zone could act as a magnet for price in the near term. Once price reaches this area, we’ll closely monitor the lower timeframes for a potential bullish reaction or accumulation, which could signal the next leg higher.
Stay patient and let price confirm at key levels.

EURAUD DETAILED ANALYSIS BULLISH OR BEARISHEURAUD is currently trading around 1.75600, forming a classic falling wedge pattern on the 12-hour timeframe. This structure typically signals a bullish reversal, and with price compressing near the wedge’s apex, the likelihood of a breakout to the upside increases significantly. Momentum is slowing on the downside, while buyers are beginning to show signs of re-entering the market, suggesting the pair is gearing up for a potential bullish surge toward the 1.85600 level.
Fundamentally, the euro is holding firm amid persistent inflation data from the eurozone, increasing speculation that the ECB might remain hawkish longer than expected. On the other hand, the Australian dollar is facing pressure due to softer commodity demand and cautious rhetoric from the RBA. This divergence in central bank outlooks favors euro strength in the near term. Today's minor beat on euro PMI data and lackluster performance in Aussie retail sales reinforces the strength of this directional bias.
Technically, this falling wedge is forming after a strong bullish impulsive leg, which adds further credibility to the reversal setup. Buyers have successfully defended the 1.7500 psychological zone, and a breakout above the wedge resistance could trigger a sharp rally. A move above 1.7600 would likely act as confirmation for bulls, opening the door for a measured move toward the 1.85600 target area.
As long as price holds above the 1.7400 region, this remains a high-probability bullish setup with a strong risk-reward profile. Traders will be closely watching for volume increase and price rejection candles at resistance to confirm the breakout. This is a prime example of a technical and fundamental confluence setup that professional traders look for when positioning for medium-term swing trades.

Hanzo | Nas100 15 min Bearish Break – Next Move is Confirmed 🆚 Nas100 – Hanzo’s Strike Setup
🔥 Timeframe: 15-Minute (15M)
——————
💯 Main Focus: Bearish Break at 19870
We are watching this zone closely.
———
Analysis
👌 Market Signs (15M TF):
• Liquidity Grab + CHoCH at 20030
• Liquidity Grab + CHoCH at 19750
• Strong Rejections seen at:
➗ 19890 – Major support / Key level
➗ 20050 – Proven resistance
🩸 Key Zones to Watch:
• 19950 – 🔥 Bullish breakout level X 7 Swing Retest
• 19980 – Strong resistance (tested 5 times)
• 19900 – Equal lows
• 19980 – Equal highs

Will NASDAQ Continue Its Climb? Here's my Trade Plan.📈 NASDAQ 100 (NAS100) Technical & Price Action Outlook 💡🚀
The NASDAQ has been in a strong bullish trend, driven by optimism around interest rates, tech earnings, and positive momentum. 📰💻 While price has pushed up aggressively, it’s now trading near key highs and buy-side liquidity zones—a spot where I’m anticipating a possible pullback. 🔁💰
I’m watching closely for a retracement into the 50% Fibonacci zone—my point of interest for a potential long setup. 🎯📐 However, I’ll only consider entering if price breaks structure bullish (BoS) after the pullback. 📊🧠
The index is still recovering from earlier 2025 losses, and resistance lies just ahead—so risk management is key. 🧘♂️⚠️
Not financial advice.

SHORT ON NAS100Nice Double Top on NAS at a major resistance level.
I will be selling nas to the next demand level for 2000-3000 points.

Hanzo | Nas100 15 min Breaks – Will Confirm the Next Move🆚 Nas100 – Hanzo’s Strike Setup
🔥 Timeframe: 15-Minute (15M)
——————
💯 Main Focus: Bullish Break Out at 19980
We are watching this zone closely.
💯 Main Focus: Bearish Break at 19890
We are watching this zone closely.
———
Analysis
👌 Market Signs (15M TF):
• Liquidity Grab + CHoCH at 20030
• Liquidity Grab + CHoCH at 19750
• Strong Rejections seen at:
➗ 19890 – Major support / Key level
➗ 20050 – Proven resistance
🩸 Key Zones to Watch:
• 19950 – 🔥 Bullish breakout level X 7 Swing Retest
• 19980 – Strong resistance (tested 5 times)
• 19900 – Equal lows
• 19980 – Equal highs

USDCAD BULLISH OR BEARISH DETAILED ANALYSISUSDCAD is currently trading around 1.3820, exhibiting a bullish bias as it approaches the upper boundary of a consolidation range. The pair has been forming a symmetrical triangle pattern, indicating potential for a breakout. A decisive move above the 1.3850 resistance level could pave the way toward the 1.3920 target.
Fundamentally, the U.S. dollar has gained strength due to stronger-than-expected manufacturing data, with the ISM PMI rising to 48.7 in April, surpassing forecasts. This data has bolstered U.S. yields and supported the dollar. Conversely, the Canadian dollar has faced pressure from weaker domestic manufacturing activity, with the S\&P Global Canada Manufacturing PMI falling to 45.3, marking the sharpest contraction since May 2020 .
Additionally, recent U.S. tariff announcements on Canadian goods have introduced further uncertainty, potentially impacting Canada's export-driven economy. The Bank of Canada may consider easing monetary policy to counteract these challenges, which could further weaken the Canadian dollar.
In summary, USDCAD is poised for a potential breakout above 1.3850, driven by a combination of technical patterns and fundamental factors favoring the U.S. dollar. Traders should monitor key resistance levels and economic indicators to confirm the continuation of this upward trend.

NAS100 - Stock Market, Waiting for FOMC?!The index is above the EMA200 and EMA50 on the 4-hour timeframe and is trading in its ascending channel. I expect corrective moves from the specified range, but if the index continues to move upwards towards 21,000 points, we can look for the next Nasdaq short positions with a risk-reward ratio.
Last week, U.S. equity markets experienced $8.9 billion in capital outflows, while equity markets in Japan and the European Union saw net inflows. Additionally, U.S. Treasury bonds recorded an outflow of $4.5 billion—the largest since December 2023. Meanwhile, the gold market witnessed its first weekly investment decline since January.
Looking ahead, financial markets are focused on the upcoming earnings reports from major companies across sectors such as technology, healthcare, automotive, energy, and financial services. These reports are expected to significantly influence equity trends, investment strategies, and corporate outlooks. Below is a daily breakdown of key companies set to release earnings this week:
Monday, May 5, 2025
The week starts with a focus on the healthcare and biotech sectors:
• Before market open: Companies such as Palantir, Ford, Onsemi, and Tyson Foods will report earnings. Palantir and Ford are particularly noteworthy for investors in the tech and auto sectors.
• After market close: Healthcare firms like Hims & Hers Health, Axsome Therapeutics, and financial company CNA Financial will report.
Tuesday, May 6, 2025
Tuesday highlights several key tech earnings:
• Before market open: Celsius, Datadog, Rivian, and Tempus will publish their results. Rivian’s report is especially anticipated due to the intense competition in the electric vehicle space.
• After market close: Tech giants like AMD and Arista Networks will release earnings, along with Marriott from the hospitality sector.
Wednesday, May 7, 2025
A packed day for earnings reports:
• Before market open: Reports from Uber and Teva are expected, along with ARM Holdings, a key player in semiconductors.
• After market close: AppLovin, Unity, and Robinhood will release their reports—representing digital gaming, software, and fintech respectively.
Thursday, May 8, 2025
This day centers on digital health, cryptocurrency, and e-commerce:
• Before market open: Peloton and Shopify will report. Shopify’s performance is particularly critical in the online retail sector.
• After market close: Crypto firm Coinbase and online sports betting platform DraftKings are in focus.
Friday, May 9, 2025
Fewer companies will report, but some are of strategic interest:
• Firms like 1stdibs, Ani Pharmaceuticals, and Embecta are scheduled, as well as Telos and Algonquin—key names in energy and cybersecurity investing.
This week, markets are closely monitoring Wednesday’s FOMC meeting. At the March session, the Fed left rates unchanged and signaled only two potential cuts totaling 50 basis points for the year, based on its dot plot—suggesting a cautious approach to monetary easing.
Simultaneously, April’s U.S. Services PMI is set to be released today, providing clearer insights into post-tariff business activity.
Amazon’s CEO stated that, so far, there is no indication of reduced demand due to tariff concerns. Some inventory spikes were noted in specific categories, likely driven by stockpiling ahead of tariff implementation. Retail prices, on average, have not significantly increased, and most sellers have yet to raise prices—though that could change depending on how tariff policies evolve. Notably, essential goods have grown at twice the rate of other categories and now account for a third of all unit sales in the U.S.
Following April’s jobs report, the likelihood of a Fed rate cut in June dropped from 75% to 42%. With only one more employment report due before the June 18 meeting, hopes for an early policy shift have faded. Some analysts argue that without the tariff conflict, the Fed might already be cutting rates, given the downward trend in inflation, steady growth, and Congressional focus on fiscal measures.
The April jobs data showed that the U.S. labor market remains resilient—neither too strong to spark inflation fears nor too weak to trigger panic. After the release, with market confidence rebounding, Goldman Sachs forecasted the Fed’s first rate cut to come at the July 30 meeting.
The consensus expectation is for the Fed funds rate to remain in the current 4.25%-4.5% range, unchanged since January. The CME FedWatch tool currently assigns just a 1.8% chance of a rate cut at the upcoming meeting.
Economists warn that Trump’s newly imposed tariffs—active since April—could drive up prices and hurt employment, challenging the Fed’s dual mandate of controlling both inflation and joblessness. However, recent data shows inflation remained mild in March and the labor market held steady in April.
Nancy Vanden Houten, Chief U.S. Economist at Oxford Economics, wrote: “The data is strong enough for the Fed to stay on the sidelines and monitor how tariffs influence inflation and expectations.” While hard data remains stable, forecasts and sentiment surveys signal looming challenges. Business leaders and individuals express concern that rising costs may burden consumers and businesses in the coming months or years, possibly even tipping the economy into recession.

Nasdaq-100 H4 | Falling toward a pullback supportThe Nasdaq-100 (NAS100) is falling towards a pullback support and could potentially bounce off this level to climb higher.
Buy entry is at 19,595.55 which is a pullback support.
Stop loss is at 18,900.00 which is a level that lies underneath an overlap support.
Take profit is at 20,343.35 which is a swing-high resistance.
High Risk Investment Warning
Trading Forex/CFDs on margin carries a high level of risk and may not be suitable for all investors. Leverage can work against you.
Stratos Markets Limited (tradu.com):
CFDs are complex instruments and come with a high risk of losing money rapidly due to leverage. 63% of retail investor accounts lose money when trading CFDs with this provider. You should consider whether you understand how CFDs work and whether you can afford to take the high risk of losing your money.
Stratos Europe Ltd (tradu.com):
CFDs are complex instruments and come with a high risk of losing money rapidly due to leverage. 63% of retail investor accounts lose money when trading CFDs with this provider. You should consider whether you understand how CFDs work and whether you can afford to take the high risk of losing your money.
Stratos Global LLC (tradu.com):
Losses can exceed deposits.
Please be advised that the information presented on TradingView is provided to Tradu (‘Company’, ‘we’) by a third-party provider (‘TFA Global Pte Ltd’). Please be reminded that you are solely responsible for the trading decisions on your account. There is a very high degree of risk involved in trading. Any information and/or content is intended entirely for research, educational and informational purposes only and does not constitute investment or consultation advice or investment strategy. The information is not tailored to the investment needs of any specific person and therefore does not involve a consideration of any of the investment objectives, financial situation or needs of any viewer that may receive it. Kindly also note that past performance is not a reliable indicator of future results. Actual results may differ materially from those anticipated in forward-looking or past performance statements. We assume no liability as to the accuracy or completeness of any of the information and/or content provided herein and the Company cannot be held responsible for any omission, mistake nor for any loss or damage including without limitation to any loss of profit which may arise from reliance on any information supplied by TFA Global Pte Ltd.
The speaker(s) is neither an employee, agent nor representative of Tradu and is therefore acting independently. The opinions given are their own, constitute general market commentary, and do not constitute the opinion or advice of Tradu or any form of personal or investment advice. Tradu neither endorses nor guarantees offerings of third-party speakers, nor is Tradu responsible for the content, veracity or opinions of third-party speakers, presenters or participants.

Nas100 Buy Looking at the w1 chart we can spot out a strong pullback momentum which gave D1 TF a bullish bias and now on h4 price look to pullback towards an AOI for a bullish continuation. Fingers crossed

Bullish till March 26 High but open for retrace.We are at a daily -BPR at the moment. All daily candles have been bullish so far since April 22. The whole sentiment behind this has been the 90 day tariff pause.
There definitely is a mix of fundamental and technical reasons for both bullish and bearish bias once we achieve this target.
For this week, I would look for a long entry only if NQ retraces lower first. Otherwise would have to just watch it do its thing. Once we hit the March 26 High, I am very open for NQ to go to All time high again because that is what it historically does but I am also completely open for it to start dumping to monthly lows because it seems that the sell-side was not hit and the higher lows made on the 4H chart seem to be very low resistance targets.
Not a good time to marry a bias.

BUYS For the Markets. Wait for BUYS in Gold and Silver.In this video, we will analyze the S&P 500, NASDAQ, DOW JONES, Gold and Silver futures, for the week of May 5 - 9th.
The Indices are moving higher, and it's buys until they are not. Simple.
Gold is near potential support at 3201. This may present a great buying opportunity once the lows are swept. A weakened USD will help this cause.
Silver has made a bearish market structure shift (MSS), so buys are not yet on the table. If it disrespects a Daily -FVG, then sells are warranted. It is considerably weaker than Gold.
Enjoy!
May profits be upon you.
Leave any questions or comments in the comment section.
I appreciate any feedback from my viewers!
Like and/or subscribe if you want more accurate analysis.
Thank you so much!
Disclaimer:
I do not provide personal investment advice and I am not a qualified licensed investment advisor.
All information found here, including any ideas, opinions, views, predictions, forecasts, commentaries, suggestions, expressed or implied herein, are for informational, entertainment or educational purposes only and should not be construed as personal investment advice. While the information provided is believed to be accurate, it may include errors or inaccuracies.
I will not and cannot be held liable for any actions you take as a result of anything you read here.
Conduct your own due diligence, or consult a licensed financial advisor or broker before making any and all investment decisions. Any investments, trades, speculations, or decisions made on the basis of any information found on this channel, expressed or implied herein, are committed at your own risk, financial or otherwise.

NZDJPY BULLISH OR BEARISH DETAILED ANALYSIS ??NZDJPY has successfully completed a bullish breakout from the descending channel structure that has been forming since mid-2024. The price action respected the trend boundaries flawlessly, and the breakout above the upper trendline confirms a reversal from the previous downtrend. Now trading around 86.200, this pair is showing strong momentum, supported by both technical breakout validation and fresh bullish sentiment in the market.
The pair is now targeting a measured move towards 93.000 in the coming weeks. The breakout is supported by increasing risk appetite across markets, as investors shift from safe-haven currencies like the Japanese Yen toward riskier assets such as the New Zealand Dollar. The sharp rejection from the lower trendline and the steady climb through April and early May marks the beginning of a potential bullish cycle. Traders should watch for retests and bullish continuation patterns to ride this wave.
Fundamentally, the New Zealand economy is seeing upward momentum with recent improvements in dairy exports and a surprise drop in unemployment to 3.8%, beating expectations. On the other hand, Japan’s stagnant inflation data and dovish Bank of Japan stance have weakened the Yen further. The widening interest rate differential between the Reserve Bank of New Zealand and the Bank of Japan continues to favor the Kiwi. This macro backdrop aligns with the technical breakout, offering additional conviction to bullish traders.
With technicals and fundamentals now in alignment, NZDJPY offers a high-probability long setup. Breakout traders and trend followers should consider riding this move toward the 93.000 target, with trailing stops to lock in profits as momentum continues. Keep an eye on global risk sentiment, commodity prices, and upcoming economic data from New Zealand for confirmation along the way.

Is The Nasdaq Bullish? Moving Higher Tomorrow...?In this video, we will analyze the NASDAQ futures for Friday, May 2nd.
Markets are looking tradeable again.
NQ has swept an old high, and retraced today. I like the location of the bullish FVG right below... which price has just tapped into a little while ago.
Look for the reaction from that +FVG, and trade accordingly.
Enjoy!
May profits be upon you.
Leave any questions or comments in the comment section.
I appreciate any feedback from my viewers!
Like and/or subscribe if you want more accurate analysis.
Thank you so much!
Disclaimer:
I do not provide personal investment advice and I am not a qualified licensed investment advisor.
All information found here, including any ideas, opinions, views, predictions, forecasts, commentaries, suggestions, expressed or implied herein, are for informational, entertainment or educational purposes only and should not be construed as personal investment advice. While the information provided is believed to be accurate, it may include errors or inaccuracies.
I will not and cannot be held liable for any actions you take as a result of anything you read here.
Conduct your own due diligence, or consult a licensed financial advisor or broker before making any and all investment decisions. Any investments, trades, speculations, or decisions made on the basis of any information found on this channel, expressed or implied herein, are committed at your own risk, financial or otherwise.

AMAZON I Technical Forecast Welcome back! Let me know your thoughts in the comments!
** Amazon Analysis - Listen to video!
We recommend that you keep this pair on your watchlist and enter when the entry criteria of your strategy is met.
Please support this idea with a LIKE and COMMENT if you find it useful and Click "Follow" on our profile if you'd like these trade ideas delivered straight to your email in the future.
Thanks for your continued support!Welcome back! Let me know your thoughts in the comments!

IMXUSDT Forming Inverse Head and Shoulder
IMXUSDT is currently showcasing one of the most reliable bullish reversal patterns on the charts – the inverse head and shoulders. This formation typically signals a shift from a bearish to a bullish trend, and with the neckline nearing a potential breakout point, this setup is becoming increasingly attractive. The current price action reflects a strong bounce from a key support level, aligning perfectly with the right shoulder of the pattern.
Volume has started to rise significantly during this bounce, which further validates the possibility of a confirmed breakout once the neckline is breached. Such volume activity typically precedes large price movements, especially when it coincides with technical patterns like this. Traders and investors are beginning to recognize this potential and are showing renewed interest in IMX.
With an expected gain of 150% to 160% from current levels, this setup could be one of the most explosive moves in the altcoin space. The pattern targets suggest a move toward previous highs, making IMXUSDT a strong candidate for mid-term bullish trades. The broader market sentiment also supports altcoin rallies, adding fuel to the bullish thesis for this coin.
✅ Show your support by hitting the like button and
✅ Leaving a comment below! (What is You opinion about this Coin)
Your feedback and engagement keep me inspired to share more insightful market analysis with you!

EURUSD DETAILED ANALYSIS FUNDAMENTALS AND CRYPTOEURUSD is currently trading around 1.13, having completed a successful retest of the previous breakout zone. The pair is now showing signs of bullish momentum, suggesting a potential move toward the 1.17 target.
From a technical perspective, the recent price action indicates a strong support level around 1.13, where buyers have stepped in to halt the previous decline. This support aligns with the 50-day moving average, reinforcing its significance. The bullish engulfing candlestick pattern formed at this level further confirms the likelihood of an upward move.
Fundamentally, the euro has been supported by stronger-than-expected economic data from the Eurozone, including a 0.4% GDP growth in Q1 2025, surpassing forecasts. Additionally, the European Central Bank's recent rate cuts have provided a more accommodative monetary environment, boosting investor confidence. Conversely, the U.S. dollar faces headwinds due to concerns over economic slowdown and potential rate cuts by the Federal Reserve.
In summary, the confluence of technical and fundamental factors suggests that EURUSD is poised for a bullish move toward the 1.17 target. Traders should monitor key resistance levels and economic indicators to confirm the continuation of this upward trend.

XAUUSD DETAILED ANALYSIS TECHNICAL AND FUNDAMENTALS XAUUSD is currently trading around the 3256 level and is clearly respecting a descending channel on the 1-hour timeframe. The price is now pushing higher from the lower boundary of the channel, suggesting short-term bullish momentum. Based on the current technical structure, I am anticipating a clean breakout above the channel resistance, with the next key target at 3300. The marked purple resistance zone around 3310–3320 also acts as a magnet for price once the breakout is confirmed.
On the fundamental side, gold remains supported by ongoing geopolitical uncertainty and speculation around the Fed's next rate decision. With recent U.S. economic data showing mixed signals—strong labor market figures but slowing inflation momentum—the market is pricing in fewer rate hikes, which weakens the USD and favors upside in XAUUSD. Additionally, central bank gold demand remains strong globally, acting as a long-term support for bullion.
Traders are currently reacting to a softening dollar index and treasury yields, which further underpins bullish sentiment in gold. A clear break above the upper boundary of this channel, ideally with strong volume confirmation, could set the stage for a swift move to retest the 3300 psychological level. From a risk-reward perspective, the breakout trade setup here aligns well with institutional strategies that favor trend continuation post-consolidation.
In summary, XAUUSD is trading inside a clean descending channel, with buyers stepping in aggressively near the support zone. A breakout above the structure could trigger a bullish continuation move toward 3300, backed by strong macro tailwinds and technical confirmation. This setup offers an excellent opportunity for swing traders to capitalize on short-term momentum. Are you also tracking gold fundamentals this week?
