BTCUSDT forming a Bullish Flag patternBitcoin (BTCUSDT) is currently forming a classic bullish flag pattern on the daily chart, often regarded as a strong continuation setup in technical analysis. The breakout from the prior descending wedge has already provided strong bullish momentum, and now BTC is consolidating just below key resistance, signaling the next possible leg upward. With volume steadily increasing during this consolidation phase, this flag pattern holds significant potential for a breakout rally.
The price structure reflects healthy accumulation, where smart money seems to be stepping in before the anticipated surge. The flagpole leading up to the pattern shows strong bullish dominance, and the sideways flag structure suggests that Bitcoin is merely taking a breather before pushing higher. A confirmed breakout from the flag could target an upside of 20% to 30%+, aligning with the projected price move shown on the chart.
Fundamentally, Bitcoin continues to gain mainstream traction, and the broader crypto sentiment is turning positive again. The volume patterns and technical indicators reinforce the bullish outlook. Investors are showing renewed interest, especially as BTC holds above key psychological and structural levels, which adds confidence to the continuation narrative.
This setup is ideal for breakout traders and investors looking to capitalize on short to mid-term gains. If the bullish flag plays out as expected, BTC could make another significant move toward its all-time high zone.
✅ Show your support by hitting the like button and
✅ Leaving a comment below! (What is You opinion about this Coin)
Your feedback and engagement keep me inspired to share more insightful market analysis with you!
NASDAQ 100 CFD

NZDJPY DETAILED ANALYSIS TECHNICAL AND FUNDAMENTALS NZDJPY is currently trading near 85.80, forming a textbook falling wedge pattern on the daily chart. This structure typically signals a bullish reversal, and price action is nearing the apex, suggesting an imminent breakout. A confirmed breakout above the upper trendline could initiate a strong bullish wave, with a medium-term target set at 95.000.
Fundamentally, the New Zealand dollar is supported by expectations of stable monetary policy from the Reserve Bank of New Zealand, while the Japanese yen faces pressure due to the Bank of Japan's continued dovish stance. This divergence in monetary policies favors NZD strength against JPY, aligning with the bullish technical setup.
Technical indicators, including the Relative Strength Index (RSI) and Moving Average Convergence Divergence (MACD), are showing signs of bullish momentum. A decisive close above the wedge's resistance line would confirm the breakout, potentially attracting further buying interest and accelerating the move toward the 95.000 target.
In summary, NZDJPY is poised for a bullish breakout from the falling wedge pattern, supported by both technical and fundamental factors. Traders should monitor for a confirmed breakout and consider positioning accordingly to capitalize on the anticipated upward movement.

Nasdaq: Where should I buy from next? New bullish orderblockWe are hunting the next buyzone already. The correction zone is printing now.
This is how you accurately forecast your next entry ahead of time. Learn how corrections should work. Long below higher time frame (Hourly/Daily/Weekly) lows is the name of the game.
This should be easy work, and you can feel free to look for longs below 15m lows on the way to the targets above. Once we hit those, we should look for correction after closing below hourly candles, the same way we were able to freely take long after close above hourly candles today just as I prescribed while it was dropping.
This is just the rules of the game 🔓 gotta be sharp enough to observe them and trust the mechanics. Thanks for tuning in

Is Nasdaq still bullish? Steep correction today as expectedIf you look at my last post, you can see where I explained the expectation.
As range theory would state, the rejection from the bottom of a range creates a target in the high of the range. I have identified the candle top that I believe is the target for this rally.
If the bearish imbalance is stacked with too many orders we will not make it there. We are sitting right around the 50EMA for hourly as well as retesting the break point and bottom of the hourly bearish orderblock as I have marked.
It is in my opinion that the Void will act as a magnetic anomaly and assist in pulling price up as many institutional orders will be in that range, but we'll see 🔑
Share with a friend in need of real guidance 🫡

Finally a correction in indices collective imbalance belowBeen wanting to show you all the mechanics of the correction phase when it happened. A very good formation here, feast your eyes. EASY 🔓

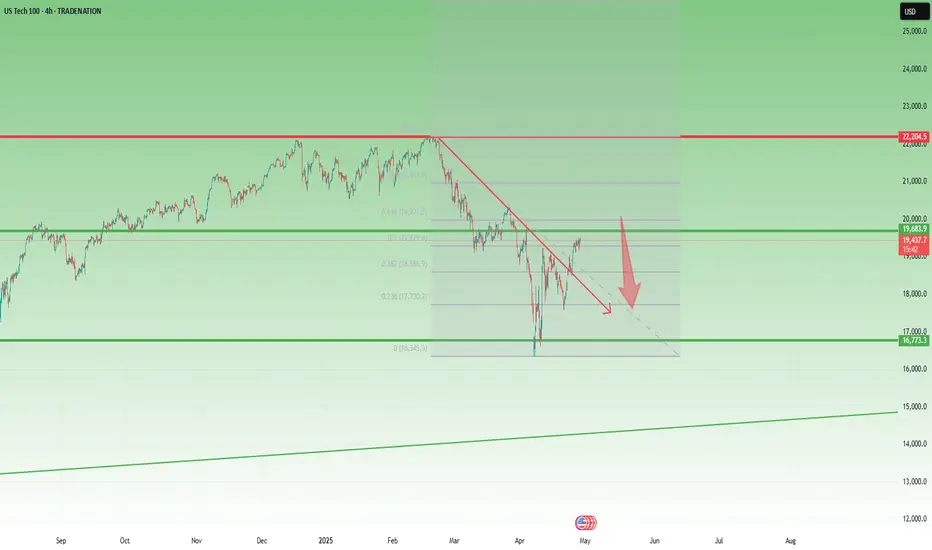
NASDAQ Recovery Looks Fragile Below 20,500After the steep drop to 16,300, NAS100 started to recover, forming a higher low and managing to break back above the falling trendline drawn from the all-time high (ATH).
While these are positive developments, in my opinion, the trend is likely to reverse to the downside soon.
Technically, the index is now entering a heavy resistance zone, marked by:
• The golden sell zone between the 50% and 61.8% Fibonacci retracement,
• Psychological resistance at 20,000,
• Major horizontal resistance around 20,500.
As long as the price remains below 20,500, I favor short trades, targeting a potential drop to at least 18,000
Disclosure: I am part of Trade Nation's Influencer program and receive a monthly fee for using their TradingView charts in my analyses and educational articles.
Nasdaq analysis: 30-APRIL-2025Good morning. Welcome to today's Nasdaq market analysis and educational insights for price action traders.

Hanzo | Nas100 15 min Bullish Break– Confirming the Next Move🆚 Nas100 – Hanzo’s Strike Setup
🔥 Timeframe: 15-Minute (15M)
——————
💯 Main Focus: Bullish Breakout at 19575
We are watching this zone closely.
📌 If price breaks with high volume, it confirms Smart Money is in control, and a strong move may follow.
———
Analysis
👌 Market Signs (15M TF):
• Liquidity Grab + CHoCH at 19460
• Liquidity Grab + CHoCH at 19000
• Strong Rejections seen at:
➗ 19100 – Major support / Key level
➗ 19450 – Proven resistance
🩸 Key Zones to Watch:
• 19450 – 🔥 Bullish breakout level X 3 Swing Retest
• 19460 – Strong resistance (tested 5 times)
• 19100 – Equal lows
• 19500 – Equal highs
Hanzo | Nas100 15 min Breaks – Will Confirm the Next Move

Hanzo | Nas100 15 min Breaks – Will Confirm the Next Move🆚 Nas100 – Hanzo’s Strike Setup
🔥 Timeframe: 15-Minute (15M)
——————
💯 Main Focus: Bullish Breakout at 19550
We are watching this zone closely.
💯 Main Focus: Bearish Breakout at 19450
We are watching this zone closely.
📌 If price breaks with high volume, it confirms Smart Money is in control, and a strong move may follow.
———
Analysis
👌 Market Signs (15M TF):
• Liquidity Grab + CHoCH at 19460
• Liquidity Grab + CHoCH at 19000
• Strong Rejections seen at:
➗ 19100 – Major support / Key level
➗ 19450 – Proven resistance
🩸 Key Zones to Watch:
• 19450 – 🔥 Bullish breakout level X 3 Swing Retest
• 19460 – Strong resistance (tested 5 times)
• 19100 – Equal lows
• 19500 – Equal highs
Hanzo | Nas100 15 min Breaks – Will Confirm the Next Move

CADCHF BULLISH OR BEARISH DETAILED ANALYSISCADCHF is currently trading around 0.59 and is showing a strong bullish wave setup on the 8H chart. Price has bounced cleanly from a key demand zone, with a visible bullish engulfing structure, suggesting buyers are stepping in aggressively. My target for this setup is 0.61, aligning with a previous major resistance level seen on the chart.
Fundamentally, CAD is supported by firm oil prices and hawkish sentiment from the Bank of Canada, while CHF has been under mild pressure due to reduced demand for safe-haven assets amid improving global sentiment. This macro backdrop favors CAD strength in the near term, adding fuel to the bullish technicals.
If the current momentum sustains, we could see a smooth continuation toward 0.61, with a favorable risk-reward ratio. As always, trade management and patience are key, especially as the pair approaches resistance. I remain bullish on CADCHF in the short term, based on both structure and fundamentals.

Bullish bounce?NAS100 is falling towards the support level which is an overlap support that is slightly above the 38.2% Fibonacci retracement and could bounce from this level to our take profit.
Entry: 18,908.67
Why we like it:
There is an overlap support level that is slightly above the 38.2% Fibonacci retracement.
Stop loss: 18,461.05
Why we like it:
There is an overlap support that lines up with the 50% Fibonacci retracement.
Take profit: 20,200.53
Why we like it:
There is an overlap resistance level that is slightly above the 161.8% Fibonacci extension.
Enjoying your TradingView experience? Review us!
Please be advised that the information presented on TradingView is provided to Vantage (‘Vantage Global Limited’, ‘we’) by a third-party provider (‘Everest Fortune Group’). Please be reminded that you are solely responsible for the trading decisions on your account. There is a very high degree of risk involved in trading. Any information and/or content is intended entirely for research, educational and informational purposes only and does not constitute investment or consultation advice or investment strategy. The information is not tailored to the investment needs of any specific person and therefore does not involve a consideration of any of the investment objectives, financial situation or needs of any viewer that may receive it. Kindly also note that past performance is not a reliable indicator of future results. Actual results may differ materially from those anticipated in forward-looking or past performance statements. We assume no liability as to the accuracy or completeness of any of the information and/or content provided herein and the Company cannot be held responsible for any omission, mistake nor for any loss or damage including without limitation to any loss of profit which may arise from reliance on any information supplied by Everest Fortune Group.

Hanzo | Nas100 15 min Breaks – Will Confirm the Next Move🆚 Nas100 – Hanzo’s Strike Setup
🔥 Timeframe: 15-Minute (15M)
——————
💯 Main Focus: Bullish Breakout at 19450
We are watching this zone closely.
💯 Main Focus: Bearish Breakout at 19300
We are watching this zone closely.
📌 If price breaks with high volume, it confirms Smart Money is in control, and a strong move may follow.
———
Analysis
👌 Market Signs (15M TF):
• Liquidity Grab + CHoCH at 19460
• Liquidity Grab + CHoCH at 19000
• Strong Rejections seen at:
➗ 19100 – Major support / Key level
➗ 19450 – Proven resistance
🩸 Key Zones to Watch:
• 19450 – 🔥 Bullish breakout level X 3 Swing Retest
• 19460 – Strong resistance (tested 5 times)
• 19100 – Equal lows
• 19500 – Equal highs

GBPUSD BULLISH OR BEARISH DETAILED ANALYSIS ??GBPUSD is looking extremely bullish on the daily timeframe, showing strong signs of continuation after a healthy pullback. Currently trading around 1.33000, the pair has respected key Fibonacci levels and is now building momentum to target 1.37000. The structure remains intact with higher highs and higher lows, indicating strong buyer control and potential for further upside movement.
From a fundamental perspective, the British pound continues to outperform as the Bank of England maintains a relatively hawkish tone amid sticky inflation pressures, while the US dollar shows signs of weakening with softer economic data and growing expectations of Fed rate cuts later this year. This divergence between the monetary policies is creating a favorable environment for GBPUSD buyers to dominate.
Technical analysis also supports the bullish bias as price action remains well above the 0.786 Fibonacci retracement level, holding strong support near 1.31650. If price maintains above this zone and breaks past minor resistance near 1.33500, it could ignite a fresh bullish rally toward the psychological level of 1.37000, offering excellent risk-reward opportunities for trend-following traders.
Overall, GBPUSD is positioned perfectly for a strong bullish wave. Traders should stay focused on potential breakout confirmations and capitalize on the momentum, as current market conditions and fundamentals are aligned with a profitable bullish move. This setup remains one of the most attractive trending opportunities on the board right now.

Nasdaq market analysis: 28-APRIL-2025Good morning. Welcome to today's Nasdaq market analysis and educational insights for price action traders.

HEIUSDT Falling Wedge Pattern Targets 150%-160% Gains!HEIUSDT is currently forming a strong falling wedge pattern, a classic bullish reversal signal. The price has been consolidating within this wedge for some time, and we are now starting to see a breakout attempt with good supporting volume. This setup is gaining attention among investors who are looking for promising opportunities in the altcoin market.
Volume has notably increased, suggesting strong buying pressure is building up. Historically, falling wedges often lead to explosive upward moves once a breakout is confirmed. In this case, the projected gain is around 150% to 160%, which makes HEIUSDT a very interesting pair to watch in the coming days and weeks.
Many traders are keeping a close eye on HEIUSDT due to the solid technical pattern and growing market interest. If momentum continues and broader crypto sentiment remains positive, this breakout could lead to substantial price appreciation. Risk management is key, but the potential reward here looks highly attractive.
✅ Show your support by hitting the like button and
✅ Leaving a comment below! (What is You opinion about this Coin)
Your feedback and engagement keep me inspired to share more insightful market analysis with you!

NASDAQ Bullish Monday (MMBM, Quarterly Theory) Hello guys, looking at the current weekly profile, as well as the 4h bullish outbreak, im expecting to see Monday pushing into my marked weekly Orderblock. This scenario is especially to my liking of a high probability for a London Reversal. I want to see London sweep Sell Side Liquidity and tap into a Discount Area.

EURUSD BULLISH OR BEARISH DETAILED ANALYSISEURUSD is currently in a critical retesting phase after a strong bullish breakout. Price action is finding solid support around the 1.1200–1.1300 zone, an area that has previously acted as major resistance. As long as this zone holds, I expect a healthy bullish bounce that could fuel a continuation toward the 1.1800 level. Market structure remains bullish, and this pullback seems more like a technical correction before the next rally.
Fundamentally, the euro is being supported by a weaker US dollar sentiment due to growing expectations of Federal Reserve rate cuts later this year. At the same time, improving Eurozone data and stabilizing inflation pressures are adding positive momentum to the EURUSD pair. If the US GDP numbers and inflation figures continue to disappoint, we could see further downside pressure on the dollar, pushing EURUSD higher.
Technically, the weekly chart shows a clean breakout from a long-term consolidation, and now the price is retesting the broken resistance as new support. The structure aligns perfectly with a bullish continuation setup. A strong bullish candle from this zone would be a major confirmation for buyers to target 1.1800 in the coming weeks.
In my view, EURUSD remains one of the strongest setups on the forex board, supported by both technical and fundamental factors. Traders should monitor key economic releases like US PCE data and Eurozone CPI, as they will drive volatility and direction. I stay bullish above the 1.1200 level and see excellent risk-reward potential in this trade idea.

US100 - Corrective Pullback into FVG + Golden Pocket setup?This 1H Nasdaq chart paints a classic structure of retracement within a bullish leg, offering potential for continuation after a clean corrective move into inefficiency. It's all about balance restoration before the next impulse.
---
1. Resistance Reaction & Local Distribution
Price faced strong rejection at a clearly defined Resistance Zone , marking a point of supply where sellers stepped in with aggression.
- The sharp rejection indicates profit-taking from earlier longs or a short-term distribution zone.
- Structure is transitioning from impulsive to corrective, suggesting a pullback is unfolding rather than a trend reversal (at least for now).
---
2. Short-Term Demand Zone Holding Price (Gray Box)
Before reaching deeper liquidity, price is hovering above a local demand block —a previously unmitigated consolidation that supported the last push up.
- This gray zone may provide temporary support, but lacks depth of imbalance.
- It's a weak floor, and smart money typically seeks deeper fills for proper re-accumulation.
---
3. Fair Value Gap Below (Primary Draw on Liquidity)
The key area of interest lies just below, where a clean Fair Value Gap (FVG) is formed. This imbalance represents a void in price action where buy-side inefficiency remains.
- Aligned with the 0.618–0.65 Fibonacci retracement range (confluence entry).
- Price is likely to seek this inefficiency for proper rebalancing.
- It’s not just a “fill the gap” play—it’s a liquidity grab where smart money is most likely waiting.
This zone is ideal for reaccumulation before resuming the move higher.
---
4. Internal Structure Suggests Bullish Intent After Fill
Price is forecasted to:
- Step 1: Break beneath the short-term demand to draw in liquidity
- Step 2: Tag the FVG zone, tapping into fresh demand
- Step 3: Shift structure via higher low formation and breakout
This is the behavior of an engineered retracement—not panic selling.
---
5. Macro Bias Still Bullish – Controlled Pullback
While the short-term price action looks bearish, the context remains supportive of upward continuation:
- No signs of aggressive selling below structure
- Current flow is corrective, not distributive
- FVG zone is strategically placed in alignment with optimal trade entry levels (OTE)
If this zone holds, expect a return to bullish expansion targeting inefficiencies left behind on the push down.
---
Conclusion:
This setup is textbook:
- Efficient rejection at resistance
- Controlled retracement into FVG with Fibonacci confluence
- Potential structural shift post-rebalance
Watch for bullish intent to return once the imbalance is filled. Until then, this is not a breakdown—it's a setup.

Analysis of Nasdaq 100 (US100) based on Price ActionThis analysis examines the recent price action of the Nasdaq 100 (US100) and identifies potential scenarios based on key technical levels.
Current Situation:
The price has recently moved above a short-term downtrend line, which could indicate a shift in momentum. This development suggests a possibility of upward movement.
Potential Bullish Scenario:
A decisive break and sustained close above the recent resistance level of 19,224 may open the door for further gains. In such a scenario, the index might target the 20,329 level. A successful move beyond that could potentially lead to a test of the historical peak at 22,245.
Potential Bearish Scenario:
Conversely, if the index fails to overcome the 19,224 resistance, there is a chance it could retest previous support levels. These levels are identified at 17,592 and, subsequently, at 16,322.
Conclusion:
The US100 is currently at a critical juncture. The ability of the price to sustain a move above 19,224 may determine its short-to-medium-term trajectory. Both bullish and bearish scenarios remain possible, and traders should monitor price action closely around these key levels.

NASDAQ Potential DownsidesHey Traders, in today's trading session we are monitoring NAS100 for a selling opportunity around 19,400 zone, NASDAQ is trading in a downtrend and currently is in a correction phase in which it is approaching the trend at 19400 support and resistance area.
Trade safe, Joe.

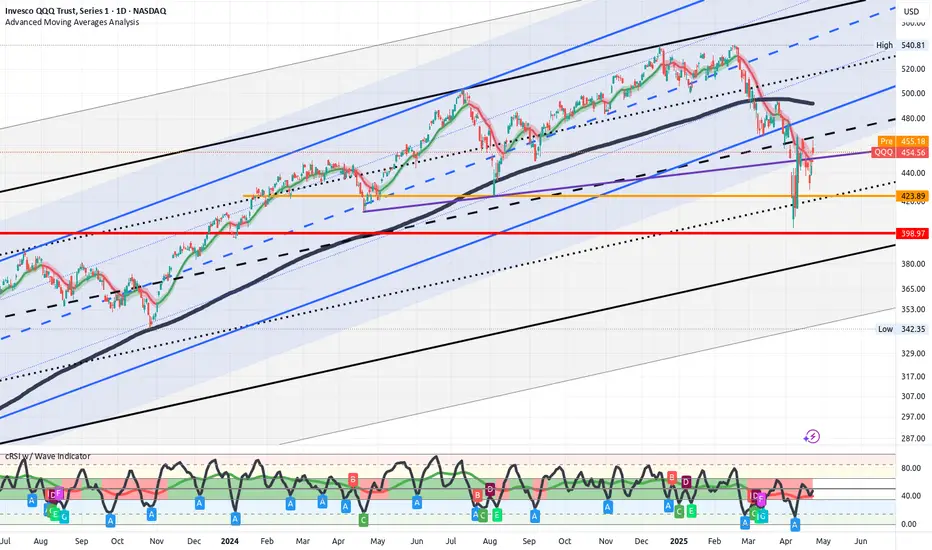
QQQ - Your guess is as good as mineMarkets are all over the place. I know ground breaking info. I don't think there is any clear answer to what is next.
Even if Trump does reduce tariffs on China, they are still going to be some of the highest in recent history. However, it looks like Trump has flinched and China has the upper hand. That is just likely going to make Trump more erratic since his policies are emotional/ego driven and not strategic.
Overall, there are likely some short-term gains to be have as the market likes to always push up when not in an panic sell. For now, the worst of the news is over and the low from the other week is likely going to be the bottom for the near future. I expect stock to continue this up and down until the tariffs work there way through the system and we see the true effect on the economy.
We punched above the 20 day SMA yesterday and will likely test it for support today and tomorrow. If it holds, I wouldn't be surprised to see prices test the 200 day. Hard to know what crazy stuff Trump will do over the weekend, so we will have to see. Good luck and enjoy the ride.
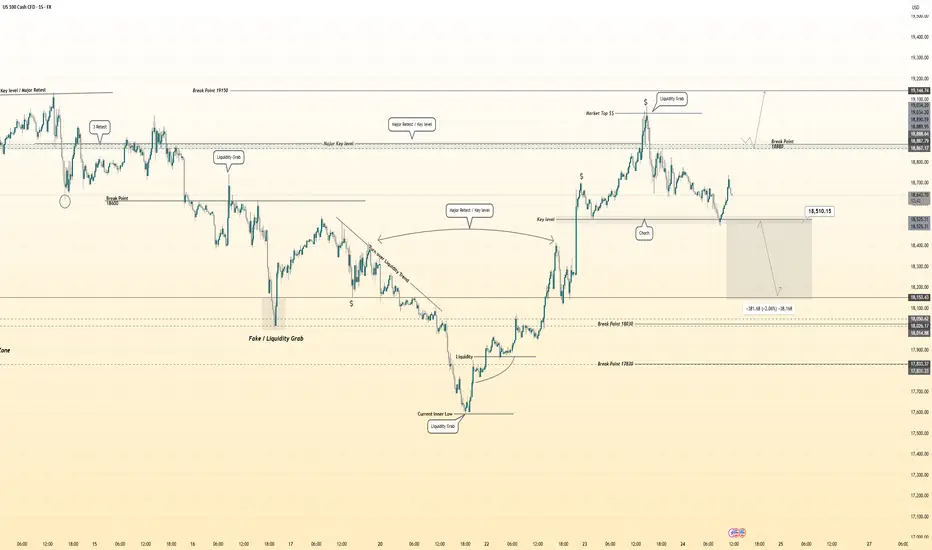
Hanzo | Nas100 15 min Breaks – Will Confirm the Next Move🆚 Nas100 – Hanzo’s Strike Setup
🔥 Timeframe: 15-Minute (15M)
——————
💯 Main Focus: Bullish Breakout at 18880
We are watching this zone closely.
💯 Main Focus: Bearish Breakout at 18510
We are watching this zone closely.
📌 If price breaks with high volume, it confirms Smart Money is in control, and a strong move may follow.
———
Analysis
👌 Market Signs (15M TF):
• Liquidity Grab + CHoCH at 19050
• Liquidity Grab + CHoCH at 18500
• Strong Rejections seen at:
➗ 18500 – Major support / Key level
➗ 18900 – Proven resistance
🩸 Key Zones to Watch:
• 18500 – 🔥 Bullish breakout level X 4 Swing Retest
• 18900 – Strong resistance (tested 6 times)
• 18500 – Equal lows
• 19050 – Equal highs
Hanzo | Nas100 15 min Breaks – Will Confirm the Next Move
NASDAQ MEGA BOUNCE ZONEI want to see a super bounce from this demand zone tomorrow due to the recent reactions around this price level. Lots of interest being shown here. I am sized in pretty heftily on MNQ futures. In a $0 or HERO position. WIll be closing my laptop now...
