Will the stock market turn positive again?!The index is trading below the EMA200 and EMA50 on the four-hour timeframe and is trading in its descending channel. If the index moves down towards the specified demand zone, we can look for further buying opportunities in Nasdaq. A break of the resistance range and the channel ceiling will also cause the Nasdaq to continue its short-term upward trend.
In February 2025, the U.S. labor market grew at a slower pace than anticipated. According to published data, non-farm employment increased by 151,000 jobs in January, while expectations were set at 160,000.This indicates that while job growth continues, its momentum has been weaker than projected.
The unemployment rate rose to 4.1% in February, slightly above the expected 4%. Meanwhile, labor force participation declined by 0.2 percentage points to 62.4%. Average hourly earnings increased by 0.3% during the month, aligning with forecasts. On an annual basis, wage growth reached 4%, slightly below the estimated 4.1%.
Among various sectors, the highest job gains were recorded in healthcare (52,000 jobs), finance (21,000 jobs), and local government (20,000 jobs). Employment also rose in construction, transportation, social assistance, and manufacturing.
Conversely, some industries experienced job losses. The hospitality sector shed 16,000 jobs, retail lost 6,000, and the federal government reduced employment by 10,000 positions. Additionally, temporary jobs declined by 12,000, signaling a potential slowdown in economic growth.
Overall, the report suggests that while the U.S. labor market remains stable, certain indicators, such as rising unemployment and a decline in full-time jobs, may point to a deceleration in economic expansion. Following the report’s release, the U.S. dollar weakened slightly, but the market reaction was muted due to prior concerns over a more significant decline.
Hassett, the White House economic advisor, stated that future reports are likely to show further reductions in government employment. He emphasized the administration’s plan to cut government jobs and spending while boosting employment in the manufacturing sector. He also confirmed that tariffs are inevitable, arguing that such measures will support the expected 3% to 4% economic growth. Hassett expressed doubt that President Trump would grant exemptions for steel tariffs.
As investors try to adjust to Trump’s evolving trade policies, the U.S. Consumer Price Index (CPI) report for February is set to be released on Wednesday. Given the recent Personal Consumption Expenditures (PCE) index data from January, it is possible that CPI could be entering a new downward trend.
The Federal Reserve’s battle against inflation remains challenging, and the recent rise in price pressures has undoubtedly been frustrating for policymakers. However, signs indicate that U.S. inflation may be shifting course, with expectations of a decline in the coming months.
One major uncertainty remains: tariffs. Trump’s decision to impose a 25% tariff on Canadian and Mexican imports and a 20% increase on Chinese goods, along with additional sector-specific and retaliatory tariffs still under discussion, could undermine the Fed’s efforts to bring inflation down to 2%.
In January, the overall CPI climbed to 3%, marking its highest level since June 2024. Core inflation also reached 3.3%. However, February’s data is expected to ease months of concern about inflationary resurgence, with projections indicating a decline in overall CPI to 2.9% and core inflation to 3.1%. Monthly estimates for both indices stand at 0.3%.
Later in the week, Thursday’s Producer Price Index (PPI) for February will provide further insights into inflationary pressures, while on Friday, investors will closely monitor the University of Michigan’s preliminary consumer sentiment survey for March. Last month’s survey raised alarms, as consumer inflation expectations climbed to their highest level in 30 years.
NASDAQ 100 CFD

NASDAQ Potential DownsidesHey Traders, in today's trading session we are monitoring NASDAQ for a selling opportunity around 20400 zone, NAS100 is trading in a downtrend and currently is in a correction phase in which it is approaching the trend at 20400 support and resistance area.
Trade safe, Joe.

S&P, NASDAQ, DOW JONES Weekly Market Forecast: Mar 10-14 In this video, we will analyze the S&P 500, NASDAQ, AND DOW JONES Futures. We'll determine the bias for the upcoming week, and look for the best potential setups.
Markets have been bearish due to mixed numbers employment, Fed statements, and uncertainty in US trade policies. Are the markets poised for a bounce back week? Perhaps. Traders will need to exercise patience before jumping in these volatile markets, waiting for the proper confirmations before we determine a bias. Once the markets tip their hand in that way, we can take advantage.
Enjoy!
May profits be upon you.
Leave any questions or comments in the comment section.
I appreciate any feedback from my viewers!
Like and/or subscribe if you want more accurate analysis.
Thank you so much!
Disclaimer:
I do not provide personal investment advice and I am not a qualified licensed investment advisor.
All information found here, including any ideas, opinions, views, predictions, forecasts, commentaries, suggestions, expressed or implied herein, are for informational, entertainment or educational purposes only and should not be construed as personal investment advice. While the information provided is believed to be accurate, it may include errors or inaccuracies.
I will not and cannot be held liable for any actions you take as a result of anything you read here.
Conduct your own due diligence, or consult a licensed financial advisor or broker before making any and all investment decisions. Any investments, trades, speculations, or decisions made on the basis of any information found on this channel, expressed or implied herein, are committed at your own risk, financial or otherwise.

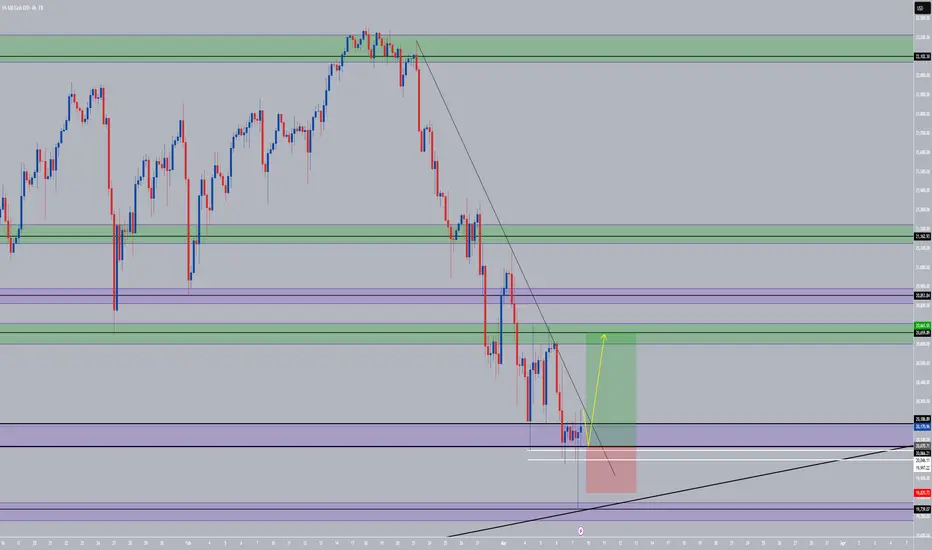
NAS100 - Bullish Possibility- Resistance zone has push price down but price came right back up testing the resistence zone for the 3rd time... making the chances higher for price to break the resistence area this time.
- The downtrend line has been hit 3 times previously, Very high chances of a bullish break out on the 4th or 5th time.
- Last confirmation, as you look my analysis, you can see a double support in white. If price respect this support zone then it will give a great boost to push price right back up for a great bullish reaction.
* Educational purpose only

EURUSD Bullish Surge: Targeting 1.1000 with 200+ Pips GainEURUSD is currently trading at 1.0700, moving exactly as predicted and showing strong bullish momentum toward the 1.1000 target. The pair has gained significant traction, with price action aligning with technical expectations for a 200+ pip rally. If this momentum continues, EURUSD could push higher, testing key resistance levels before reaching its final target.
From a technical standpoint, the bullish structure remains intact, supported by strong price action and increased buying pressure. A break above minor resistance levels near 1.0800 could accelerate the move toward 1.1000. Traders should monitor volume and price action confirmations to ensure sustained bullish momentum, while also keeping an eye on potential retracements for re-entry opportunities.
Fundamentally, the euro’s strength is driven by market expectations surrounding the European Central Bank’s (ECB) monetary policy, as well as potential weakness in the US dollar. If the Federal Reserve signals a dovish stance or weaker economic data emerges from the US, the dollar could see further declines, supporting EURUSD’s bullish move. Additionally, any positive Eurozone economic data could further fuel the rally.
In summary, EURUSD is following its projected bullish path, with 1.1000 as the next key target. Traders should watch for continued bullish confirmations while staying cautious of economic events that could impact the pair’s momentum. With technical and fundamental factors aligning, the pair remains well-positioned for further upside.

Actionable Nasdaq insights: 05-Mar-2025Rise and shine, traders! Start your day with actionable Nasdaq insights. Let's grow your skills together, one chart at a time.

POSITION REVERSED ON NASDAQWe reversed our position after that we got an IFVG to target the DLQ we have at 19785.48.

NASDAQ Potential DownsidesHey Traders, in today's trading session we are monitoring NAS100 for a selling opportunity around 20700 zone, NASDAQ is trading in a downtrend and currently is in a correction phase in which it is approaching the trend at 20700 support and resistance area.
Trade safe, Joe.

BUY NASDAQI'm sharing with you our trade this morning on NASDAQ which is based on the FVG after the LQ grab, to target the BUYSIDE LIQUIDITY.
Follow for more!

Nasdaq market analysis: 04-Mar-2025Good morning, traders! Welcome to today's Nasdaq market analysis. Compare my price action insights with your own charts and enhance your trading skills.

NAS100 Bearish (Descending Trend, DOW LLs)NAS100 Unable to sustain above previous daily high. Overall indexes are seeing sell pressure with RISK ON instruments such as AUD and NZD showing sell off. Technically, bearish trend is not broken and DOW Lower Lows (LLs) still intact. Fundamentally Indexes will remain bearish.
Trade Setup:
Entry at Previous Day High (CMP)
SL at previous LH.
TP at 1:1 and 1:2
TP FILLED ON NASDAQCouple minutes ago, I posted to sell NASDAQ, and now the market reached our TP.
Follow for more trades!

SELL NASDAQGood morning Traders
I'm sharing with you one of the trades I'm taking today, we sold after that the Minor BUYSIDE LQ got swept and based on the IFVG. And our target is the Daily LQ.
Follow for more!

NAS100 - Nasdaq, won't it go below 20k?!The index is below the EMA200 and EMA50 on the four-hour timeframe and is trading in its medium-term ascending channel. If the index rises towards the suggested zones, we can look for the next Nasdaq sell-off.
The composition of investors’ financial assets from 1990 to 2025 reveals shifts in the allocation of equities, bonds, and cash. Currently, the share of equities in investment portfolios has reached an all-time high of 54%, indicating a growing preference for the stock market among investors.
Conversely, the share of bonds and cash has declined to 18% and 13%, respectively, suggesting reduced interest in holding fixed-income assets and liquidity. At present, more than half of investors’ financial assets are concentrated in equities, which could reflect optimism about the market’s future growth.
This situation calls for increased caution from the Federal Reserve and the Trump administration, as a significant portion of American households’ surplus income is now directed toward stocks. As a result, any downturn in the U.S. stock market could have more severe consequences for the public than before.
Scott Bassett, the U.S. Treasury Secretary, responded to a recent survey indicating that Americans want President Donald Trump to focus more on reducing inflation. He stated that he is confident consumer price inflation in the United States will decline throughout the year.
In an interview with CBS and Face the Nation, Bassett defended Trump’s economic policies, emphasizing that the president is pursuing a comprehensive approach that includes tariffs, deregulation, and a gradual reduction in energy costs.
Meanwhile, following weaker-than-expected preliminary Purchasing Managers’ Index (PMI) data for February and a decline in the University of Michigan’s Consumer Sentiment Index, investors are now pricing in approximately 60 basis points of rate cuts by the Federal Reserve for this year. This projection is 10 basis points higher than the forecasts from the December dot plot.
Market pricing indicates that traders still expect the Federal Reserve to cut interest rates in June, particularly after the release of Personal Consumption Expenditures (PCE) data. However, with Trump ramping up tariff threats against key U.S. trading partners such as China, Canada, and Mexico, outlining a clear economic roadmap has become more challenging. Tariff impositions pose a serious risk of reigniting inflation, prompting many Federal Reserve officials who have recently expressed their views to adopt a “wait and see” approach.
This week, market attention will once again turn to employment data, as investors eagerly anticipate the release of the February Non-Farm Payrolls (NFP) report. Other key events include the preliminary Consumer Price Index (CPI) estimates for the Eurozone and the ISM U.S. Manufacturing PMI on Monday, the ADP Employment Report and ISM Services PMI on Wednesday, and the weekly jobless claims data on Thursday. Additionally, the European Central Bank’s monetary policy decision on Thursday will be closely watched, with economists expecting another interest rate cut.

Nasdaq volatility NOT OVER YET!!Make note of the following liquidity targets this wk
Buy-side near term tp @ 21110-21160 (selling from there)
Sell-side tp @ 20378 (scaling into long buy positions from there)

Nasdaq 100 Hits Yearly Low, Led by NVDA DeclineNasdaq 100 Hits Yearly Low, Led by NVDA Decline
The Nasdaq 100 (US Tech 100 mini on FXOpen) has fallen below 20,500 for the first time since November 2024.
Bearish sentiment driven by:
→ The latest US jobless claims report, which showed the highest figures of 2025.
→ Concerns over the destabilising and economically damaging potential of Donald Trump’s trade policies.
Nvidia (NVDA) Among the Biggest Losers
While the Nasdaq 100 lost over 2.5% in yesterday’s session, Nvidia (NVDA) shares plunged nearly 8% despite a stronger-than-expected quarterly report, as we noted yesterday.
Technical Analysis of the Nasdaq 100 (US Tech 100 mini on FXOpen)
The ongoing decline has resulted in a bearish breakout of the trendline (marked in blue) that originated in 2024. Based on key reversals (highlighted with red circles), the chart now outlines a descending channel. An attempted breakout (indicated by an arrow) failed, forming a bearish Rounding Top pattern.
If bearish sentiment prevails—especially with focus on inflation data, as the Core PCE Price Index is set to be released today at 16:30 GMT+3—Nasdaq 100 (US Tech 100 mini on FXOpen) may drop further towards the lower boundary of the descending channel.
Trade on TradingView with FXOpen. Consider opening an account and access over 700 markets with tight spreads from 0.0 pips and low commissions from $1.50 per lot.
This article represents the opinion of the Companies operating under the FXOpen brand only. It is not to be construed as an offer, solicitation, or recommendation with respect to products and services provided by the Companies operating under the FXOpen brand, nor is it to be considered financial advice.

USTEC,NAS100USTEC price is at resistance zone 22210. If price cannot break through, we expect a correction. Consider selling red zone.
🔥Trading futures, forex, CFDs and stocks carries a risk of loss.
Please consider carefully whether such trading is suitable for you.
>>GooD Luck 😊
❤️ Like and subscribe to never miss a new idea!

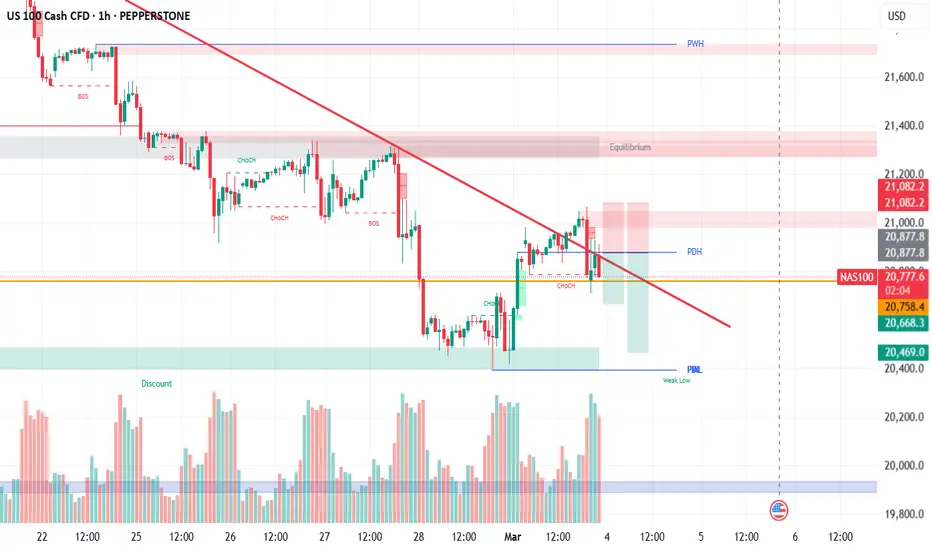
Nasdaq-100 H4 | Rising into pullback resistanceNasdaq-100 (NAS100) is rising towards a pullback resistance and could potentially reverse off this level to drop lower.
Sell entry is at 20,775.39 which is a pullback resistance that aligns with the 23.6% Fibonacci retracement level.
Stop loss is at 21,000.00 which is a level that sits above a pullback resistance that aligns with a confluence of Fibonacci levels i.e. the 23.6% and 50.0% retracements.
Take profit is at 20,354.08 which is a swing-low support.
High Risk Investment Warning
Trading Forex/CFDs on margin carries a high level of risk and may not be suitable for all investors. Leverage can work against you.
Stratos Markets Limited (www.fxcm.com):
CFDs are complex instruments and come with a high risk of losing money rapidly due to leverage. 63% of retail investor accounts lose money when trading CFDs with this provider. You should consider whether you understand how CFDs work and whether you can afford to take the high risk of losing your money.
Stratos Europe Ltd (www.fxcm.com):
CFDs are complex instruments and come with a high risk of losing money rapidly due to leverage. 63% of retail investor accounts lose money when trading CFDs with this provider. You should consider whether you understand how CFDs work and whether you can afford to take the high risk of losing your money.
Stratos Trading Pty. Limited (www.fxcm.com):
Trading FX/CFDs carries significant risks. FXCM AU (AFSL 309763), please read the Financial Services Guide, Product Disclosure Statement, Target Market Determination and Terms of Business at www.fxcm.com
Stratos Global LLC (www.fxcm.com):
Losses can exceed deposits.
Please be advised that the information presented on TradingView is provided to FXCM (‘Company’, ‘we’) by a third-party provider (‘TFA Global Pte Ltd’). Please be reminded that you are solely responsible for the trading decisions on your account. There is a very high degree of risk involved in trading. Any information and/or content is intended entirely for research, educational and informational purposes only and does not constitute investment or consultation advice or investment strategy. The information is not tailored to the investment needs of any specific person and therefore does not involve a consideration of any of the investment objectives, financial situation or needs of any viewer that may receive it. Kindly also note that past performance is not a reliable indicator of future results. Actual results may differ materially from those anticipated in forward-looking or past performance statements. We assume no liability as to the accuracy or completeness of any of the information and/or content provided herein and the Company cannot be held responsible for any omission, mistake nor for any loss or damage including without limitation to any loss of profit which may arise from reliance on any information supplied by TFA Global Pte Ltd.
The speaker(s) is neither an employee, agent nor representative of FXCM and is therefore acting independently. The opinions given are their own, constitute general market commentary, and do not constitute the opinion or advice of FXCM or any form of personal or investment advice. FXCM neither endorses nor guarantees offerings of third-party speakers, nor is FXCM responsible for the content, veracity or opinions of third-party speakers, presenters or participants.

Nasdaq NQ Update . High probability Long Setup In this video I look at the NQ on the daily and pinpoint whats possibly next for longs and shorts . I highlight a key zone to look for Longs that you need to mark on your chart .

LONG ON NAS100Nas is oversold and has rejected a major demand area.
I will be buy nas to the next resistance level

NASDAQ Potential UpsidesHey Traders, in today's trading session we are monitoring NAS100 for a buying opportunity around 20650 zone, NASDAQ is trading in an uptrend and currently is in a correction phase in which it is approaching the trend at 20650 support and resistance area.
Trade safe, Joe.

Nas100 Correction: Why a Drop Below 20K is LikelySince reaching its recent all-time high of 22,232, the PEPPERSTONE:NAS100 has dropped 1,000 points. While this might seem like a significant decline, it actually represents less than a 5% correction—hardly a major pullback.
This drop has brought the index into a key confluence support zone, raising the common question: Is the correction over?
In my opinion, it’s not. For a healthy correction, a dip below 20,000 is necessary.
Technical Perspective
🔹 Since the "bullish" event marked by Trump’s election, the index hasn’t made substantial progress. While it has technically risen, the gains have been marginal, suggesting more distribution than true bullish strength.
🔹 The index remains confined within a large rising wedge, as seen on the chart. This type of structure often signals topping and potential reversal rather than sustainable upside momentum.
What’s Next?
In the medium term, I expect a drop below 20,000. For traders looking to speculatively trade the Nas100, potential sell zones would be around 22,000 and 23,000— in the event of a new all-time high.
