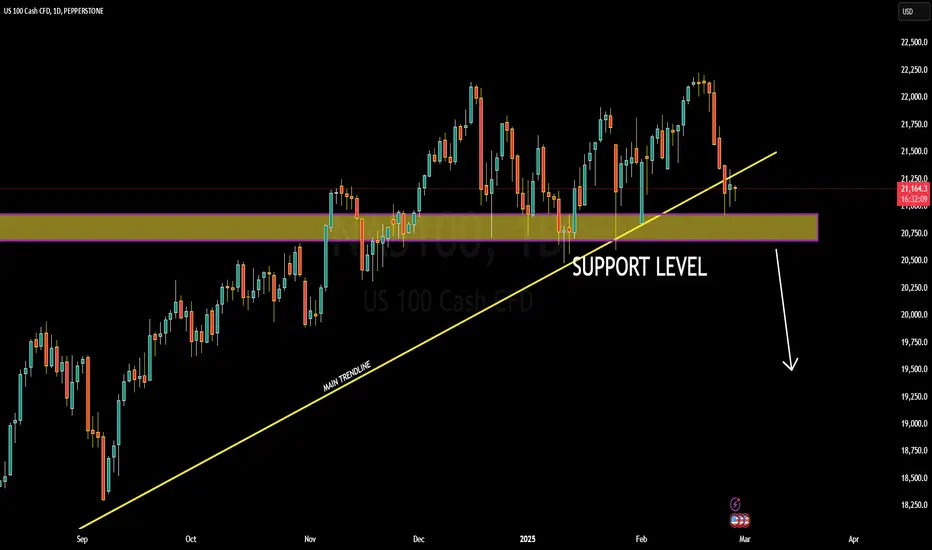
NAS100 at Critical SupportNAS100 is currently trading at 21,150, having completed a falling wedge breakout and now holding at a key support level. The falling wedge is typically a bullish pattern, but in this case, price action suggests a crucial test of support. If this level fails to hold, NAS100 could see significant downside momentum, potentially targeting the 19,000 level.
Technically, a breakdown below this support could confirm a bearish continuation, triggering a strong sell-off. Traders should watch for increased selling pressure and a sustained move below the support zone, which could accelerate bearish momentum. If the support holds, however, NAS100 could attempt a recovery, making this a decisive level to monitor.
Fundamentally, NAS100 remains under pressure due to concerns over Federal Reserve policy, interest rate expectations, and broader market sentiment. Any signs of prolonged high rates or weak earnings from major tech companies could fuel further downside pressure. Additionally, rising bond yields and a stronger US dollar may continue to weigh on the index.
In summary, NAS100 is at a critical support level after a falling wedge breakout, with the potential for a sharp drop if the support breaks. Traders should closely monitor price action, volume, and macroeconomic developments to confirm the next move. A break below this level could open the door for further downside toward 19,000.
NASDAQ 100 CFD
QQQ running out of steam?Seems to me that QQQ is starting to run out of steam. The strong AI rally seems like it may have reached peak FOMO and the Trump chaos is taking its toll. Trump's policies will likely be good for businesses and stocks in the long run if they don't put economy in a recession first. Any data showing that inflation is ramping back up will be bad. Typically markets prefer stability and not chaos. Either way, QQQ is trending flat and running at long term market resistance. Bubbles can always go higher, but something like the dot.com just rallied on upwards after short strong pullbacks. The AI bubble clearly looks like it is flat lining. We could continue to grind it out sidesways and upwards. A long-term sideways move could also give QQQ the headroom for a bigger run up later without a big pull back. Going to be a fun ride the next few months.

OUR SMALL TRADE TODAY ON NASDAQMy students and I earlier took this small trade on NASDAQ which was what we had for the day, as you can see, we entered based on the daily opening range and the FVG to target the LQ.
For any questions, the comment section is all yours!
Follow for more!

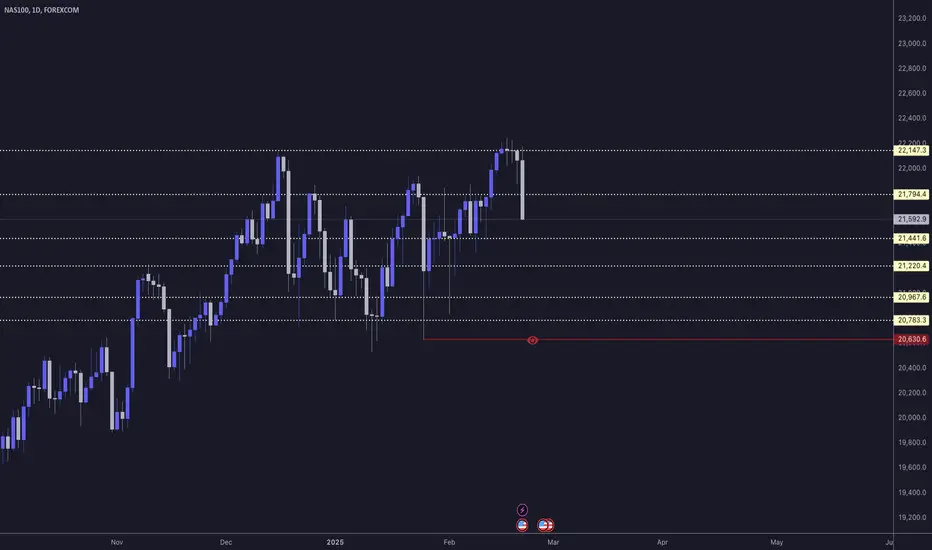
Nasdaq-100 H4 | Overhead pressures persistNasdaq-100 (NAS100) is rising towards a pullback resistance and could potentially reverse off this level to drop lower.
Sell entry is at 21,391.40 which is a pullback resistance that aligns close to the 38.2% Fibonacci retracement level.
Stop loss is at 21,650.00 which is a level that sits above the 50.0% Fibonacci retracement and a pullback resistance.
Take profit is at 20,777.93 which is a swing-low support.
High Risk Investment Warning
Trading Forex/CFDs on margin carries a high level of risk and may not be suitable for all investors. Leverage can work against you.
Stratos Markets Limited (www.fxcm.com):
CFDs are complex instruments and come with a high risk of losing money rapidly due to leverage. 63% of retail investor accounts lose money when trading CFDs with this provider. You should consider whether you understand how CFDs work and whether you can afford to take the high risk of losing your money.
Stratos Europe Ltd (www.fxcm.com):
CFDs are complex instruments and come with a high risk of losing money rapidly due to leverage. 63% of retail investor accounts lose money when trading CFDs with this provider. You should consider whether you understand how CFDs work and whether you can afford to take the high risk of losing your money.
Stratos Trading Pty. Limited (www.fxcm.com):
Trading FX/CFDs carries significant risks. FXCM AU (AFSL 309763), please read the Financial Services Guide, Product Disclosure Statement, Target Market Determination and Terms of Business at www.fxcm.com
Stratos Global LLC (www.fxcm.com):
Losses can exceed deposits.
Please be advised that the information presented on TradingView is provided to FXCM (‘Company’, ‘we’) by a third-party provider (‘TFA Global Pte Ltd’). Please be reminded that you are solely responsible for the trading decisions on your account. There is a very high degree of risk involved in trading. Any information and/or content is intended entirely for research, educational and informational purposes only and does not constitute investment or consultation advice or investment strategy. The information is not tailored to the investment needs of any specific person and therefore does not involve a consideration of any of the investment objectives, financial situation or needs of any viewer that may receive it. Kindly also note that past performance is not a reliable indicator of future results. Actual results may differ materially from those anticipated in forward-looking or past performance statements. We assume no liability as to the accuracy or completeness of any of the information and/or content provided herein and the Company cannot be held responsible for any omission, mistake nor for any loss or damage including without limitation to any loss of profit which may arise from reliance on any information supplied by TFA Global Pte Ltd.
The speaker(s) is neither an employee, agent nor representative of FXCM and is therefore acting independently. The opinions given are their own, constitute general market commentary, and do not constitute the opinion or advice of FXCM or any form of personal or investment advice. FXCM neither endorses nor guarantees offerings of third-party speakers, nor is FXCM responsible for the content, veracity or opinions of third-party speakers, presenters or participants.

Nasdaq market analysis: 26-Feb-2025Good morning! Here's your daily Nasdaq market analysis. Learn, grow, and trade wisely.

QQQ Thrives Amidst Trump Administration's UnpredictabilityQQQ still bullish amid all of the chaos of Trump's first few weeks. Friday saw a high that was just a touch shy of a new ATH. Next week will give us a good idea what the future is, if we pull back we may be seeing a double top if you are bearish or we could make a new ATH and power on higher with bulls in control.

TP FILLED ON NASDAQMinutes ago, I posted to sell NASDAQ targeting the 4H LQ, and the market filled our target.
Follow for more!

SELL NASDAQToday we entered in a bearish position on NASDAQ in which we're trgeting the 4H LQ
I don't post at the same time we enter since I share it to my students.
Follow for more!

Aditxt (NASDAQ: ADTX) Set for 3,000% Surge Amidst Falling Wedge Aditxt Inc. (NASDAQ: ADTX) is on the brink of a potential game-changing breakout.
We believe NASDAQ: ADTX could deliver a staggering 3,000% surge, presenting a massive short-term opportunity while holding long-term potential as a leader in the biotech space.
About Aditxt Inc. (NASDAQ: ADTX)
Aditxt Inc. (NASDAQ: ADTX), a cutting-edge biotechnology company founded in 2017 and headquartered in Richmond, Virginia, is revolutionizing immune system monitoring and modulation through its groundbreaking technologies aimed at improving health outcomes. Operating within the healthcare sector, Aditxt specializes in developing and commercializing innovative solutions such as AditxtScore, a pioneering platform designed to help individuals understand, manage, and monitor their immune profiles, offering critical insights into immune responses and potential threats.
Technical Overview
Aditxt Inc. (NASDAQ: ADTX) shares have seen a 5.35% decline in the past 24 hours, currently trading within a steep falling wedge pattern—a historically bullish structure that often precedes explosive breakouts. This wedge has been forming since August 2023, signaling a prolonged consolidation phase. With RSI at 19, ADTX is in deeply oversold territory, making it an attractive setup for a significant reversal.
The support level has already been established, preventing further downside pressure. If ADTX breaks above the 38.2% Fibonacci retracement level, it could act as the catalyst for a 3,000% surge, as traders recognize the wedge breakout and align with the strengthening biotech sector trend.
Despite being listed on NASDAQ, ADTX has an intraday market cap of just $6.879 million, an unusually low valuation given its positioning. This makes it a prime candidate for a revaluation, especially as trading volume continues to rise, indicating increased interest from buyers.
Further reinforcing the bullish thesis is the fact that ADTX is trading below the 50-day, 100-day, and 200-day moving averages. Historically, when a stock is far below these levels with growing volume, it often signals a reversal is on the horizon. The combination of a tight trading range, declining seller pressure, and increasing accumulation suggests that ADTX is nearing a breakout point, with technical conditions aligning for a massive upward move.
#Sponsored

Nasdaq market analysis: 25-Feb-2025Let’s dive into today's Nasdaq market analysis. Share insights, and potentially spot opportunities for good pips.

NAS100 Analysis: Key Levels & Bearish Trade Setup📊 NAS100 Analysis and Trade Idea | Key Levels & Bearish Bias Explained 📉
Dive into a detailed analysis of the NAS100 (NZ 100) with a focus on key support zones, retracement levels, and a bearish trading bias. Learn how to identify overextended price movements, imbalances, and potential short setups using the daily and 4-hour timeframes. Perfect for traders looking to refine their strategies in indices trading! 💡 💬 Share your thoughts and trading ideas in the comments below!

Nas100 sudden crash heading towards which level?Hello Guys. Wish you a Great weekend.
A quick update on nas100 cfd, which we will witness moving below 21400 level , which is very high probability. just waiting for the Monday London session to frame the entry and stoploss.
stay tuned to this post. i will update the entry , stoploss and risk reward about this setup
good luck good trading

Nasdaq market analysis: 24-Feb-2025Let’s dive into today's Nasdaq market analysis. Share insights, and potentially spot opportunities for good pips.

Possible push down for NAS100After A strong Bearish push, price action is filling the inefficiency left behind. Price is currently testing the structure lows previous support. The bearish move and retracement is the 78.6% PRZ
Wait for your lower time frame play to enter. This is an over all counter trend trade, however this could have a nice quick move down to retest the Daily previous structure high area of 21,843
Daily Chart has a Bearish Divergence that is playing out.
**Caution** on the macro bullish trend, this recent pull back retraced back to the 23.6 lvl with a wick while "retesting" the previous structure high on the H4 time frame....Enter with caution.

NAS100NAS100 goes to redline.Because it can not jump upward support line .Last end of the week all news was bad.Target Redline .
$NAS100 IdeaIf the monthly close occurs as projected, we will confirm a double liquidity purge, signaling a bearish scenario. Additionally, buyer liquidity will have been absorbed, with the price closing within the range, further reinforcing the downside perspective for NAS100. However, we still have one more week to validate this bias. On the daily chart, we will wait for a market structure shift before considering short positions.

OUR TRADE TODAY ON NASDAQToday again we caught another good trade on NASDAQ which was based on the DOR and FVG, and our target was the Liquidity.
PS: THE ENTRY SCREENSHOT WAS TAKEN ON THE 1 MIN CHART!!
Follow for more!

Nasdaq analysis: 21-Feb-2025Good morning, everyone! Today's Nasdaq analysis is designed to educate and empower. Use these insights to refine your price action trading strategy.

SHORT ON NAS100Nas has been failing to break highs.
Highs continue to get Lower coming from a major resistance area.
Telsa, Amazon and others facing back lash for many political reasons. (negative)
I will be selling nas before unemployment news today that expect more people to be unemployed. (negative)
News could set this trade on Fire to the downside.

NAS100 H4Rules:
If price break point 2,4, 6, 8 cancel the setup
Price needs to break point 1, 3, 5, or 7 to confirm the setup
When price reach the 100FE (blue box) it normally does a pullback/retest or reversal
The market can Truncate (fall short)

Actionable Nasdaq insights: 20-Feb-2025Rise and shine, traders! Start your day with actionable Nasdaq insights. Let's grow your skills together, one chart at a time.

NASDAQ Potential UpsidesHey Traders, in today's trading session we are monitoring NAS100 for a buying opportunity around 21800 zone, NASDAQ is trading in an uptrend and currently is in a correction phase in which it is approaching the trend at 21800 support and resistance area.
Trade safe, Joe.

OUR TRADE ON NASDAQThis is our trade for today on nasdaq in which we sold and recovered the loss we made on gold and made more profits on it.
I didn't share it to public since I gave it to my students, now after the TP reached here you are watching it!
Follow us for more!
