Falling towards pullback support?NAS100 is falling towards the support level which is a pullback support that is slightly below the 23.6% Fibonacci retracement and could bounce from this level to our take profit.
Entry: 21,526.66
Why we like it:
There is a pullback support level that is slightly below the 23.6% Fibonacci retracement.
Stop loss: 21,287.96
Why we like it:
There is a pullback support that is slightly below the 50% Fibonacci retracement.
Take profit: 21,910.11
Why we like it:
There is a pullback resistance level.
Enjoying your TradingView experience? Review us!
Please be advised that the information presented on TradingView is provided to Vantage (‘Vantage Global Limited’, ‘we’) by a third-party provider (‘Everest Fortune Group’). Please be reminded that you are solely responsible for the trading decisions on your account. There is a very high degree of risk involved in trading. Any information and/or content is intended entirely for research, educational and informational purposes only and does not constitute investment or consultation advice or investment strategy. The information is not tailored to the investment needs of any specific person and therefore does not involve a consideration of any of the investment objectives, financial situation or needs of any viewer that may receive it. Kindly also note that past performance is not a reliable indicator of future results. Actual results may differ materially from those anticipated in forward-looking or past performance statements. We assume no liability as to the accuracy or completeness of any of the information and/or content provided herein and the Company cannot be held responsible for any omission, mistake nor for any loss or damage including without limitation to any loss of profit which may arise from reliance on any information supplied by Everest Fortune Group.
NASDAQ 100 CFD

EURNZD Analysis , Support Bounce and Bullish PotentialEURNZD is currently trading at 1.83300, with a target price of 1.89000. This suggests a potential upward movement of 500+ pips. The price is bouncing off a strong support level, indicating a possible bullish reversal. The support and resistance pattern highlights key price zones where buying and selling pressure increase. A successful bounce from support strengthens the bullish outlook. Traders anticipate the price moving towards the next resistance level at 1.89000. Confirmation through candlestick patterns and volume analysis is essential. Risk management should include a stop-loss below the support level. Fundamental factors like interest rate decisions can impact price action. Monitoring market sentiment and economic news is crucial for trade execution.

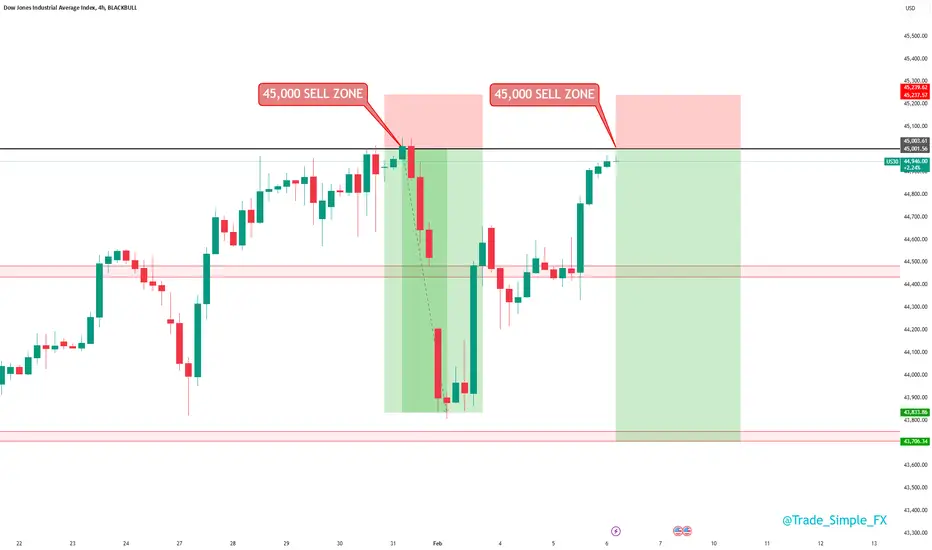
US30 H8 - Short SignalUS30 H8
We are yet again approaching that key psychological price level, 45,000 coming into play. We are very close currently, but alerts have been set. Last time this setup came into this 45,000 territory, we sold off an attractive 5R.
Looking to see if this setup can offer something similar again, we would love to see price trade closer to 44,000 this time round.
Nasdaq market analysis: 06-Feb-2025Good morning Dear Traders! Join me for Nasdaq market analysis. Share your charts, ask questions, and let's discuss trading strategies.

Thursday Nasdaq Analysis 25.02.06Hello, this is Greedy All-Day.
Today's analysis is focused on the Nasdaq.
Chart Link:
Let’s start by reviewing Wednesday’s briefing.
We entered a buy position after the resistance trendline was broken, with the first entry occurring at the yellow box.
The second entry was made after breaking above the previous high of 21,694.
With the horizontal line set as the target, the price rose about $180 from the first entry, resulting in a $3,600 profit per contract.
As for sell positions, there was no entry since the upward trendline held and no trend reversal occurred.
Chart Link:
Let’s review the daily chart.
The Nasdaq is still consolidating within the pattern.
If this consolidation is broken, we could see a trend reversal, which could further strengthen the upward momentum. However, for now, it seems the price is still moving within the pattern.
Chart Link:
Here’s today’s trading strategy:
Buy Position
No planned entry.
Reason: Although the uptrend is clear, the price is approaching a critical area marked by the black box on the daily chart.
In this area, the price could either break out and then retrace or lead to a trend reversal. It could also continue to gain buying momentum, making this zone highly uncertain. Therefore, no buy signals are planned.
Sell Position
Entry 1: Upon a break below the upward trendline at the orange box.
Reason: The current uptrend has been following a staircase-like expansion pattern, making the timing of a trend reversal uncertain. Thus, we’ll prioritize observing a break below a trendline slightly higher than the previous one.
Entry 2: Upon a break below the upward trendline at the blue box.
Context: The first trendline break and the trendline we've been monitoring since Monday will be critical.
Conclusion
Since the gap down on Monday, the Nasdaq has been continuously rising.
This once again confirms that we should focus on reacting to the charts rather than making premature predictions.
Wishing you all profitable trades today!

Wednesday Nasdaq Analysis 25.02.05Hello, this is Greedy All-Day.
Today’s analysis focuses on the NASDAQ.
Tuesday’s Briefing Results
Chart:
Let's begin by reviewing Tuesday’s briefing results.
On Tuesday, as the price broke above the resistance trendline, our first long entry was taken. A second long entry followed when the price broke above 21600. The target—a horizontal line at 21685—was reached before a correction occurred.
From the entry point, the price rose by approximately $245, yielding a profit of about $4,900 per contract on the long side.
On the sell side, no entry signal was triggered, so no sell position was taken.
Daily Chart Analysis
Chart:
Looking at the daily chart, the NASDAQ appears to still be converging within a narrowing range.
The current position seems to be right before a directional decision is made, positioned near the middle of the Ichimoku Cloud. However, this sideways movement may persist, and the longer it continues, the more likely it is that a breakout in either direction could trigger a significant trend reversal.
Key Support and Resistance Zones on the Daily Chart
Chart:
Buy Perspective:
Entry Trigger: Breakout above the purple box at 21200.
Rationale: Rather than trading impulsively, a long entry is recommended based on the possibility of filling the gap if today’s high is broken.
Risk: The overall trend remains bearish.
Sell Perspective:
Entry Trigger:
Option 1: A break of the short-term ascending trendline, or
Option 2: A break below today’s low at 20943.
Rationale:
This signal indicates significant risk and suggests that the market is overheated—possibly nearing a bubble burst.
Risk:
Although the trend is bearish, entering a short position late in the move raises concerns about how far the price may fall. It is advisable to set targets based on major support levels.
Conclusion
The NASDAQ is currently in a converging state, and it seems best to trade only when clear breakout signals emerge, while staying on the sidelines in ambiguous zones.
For Buyers: Focus on breakouts above the key levels (21779 and 21812) for potential continuation of the uptrend.
For Sellers: Monitor for a break below the ascending trendline or 20943 to confirm a trend reversal.
Stay patient, watch key levels closely, and trade strategically. Happy trading, and let’s finish the week strong! 🚀

NZDUSD Falling Wedge Breakout – 400+ Pips Opportunity!NZDUSD forex pair is currently trading at 0.56800, with a target price of 0.60000, offering a potential gain of 400+ pips. This bullish outlook is supported by a falling wedge breakout, a technical pattern indicating a reversal from a downtrend to an uptrend. The breakout is further strengthened by a good bounce from a key support level, suggesting strong buying interest at lower prices. The rising momentum and breakout signal a shift in market sentiment, potentially attracting more buyers. The target of 0.60000 represents a significant resistance level, and reaching it would require sustained upward pressure. Traders may view this as a buying opportunity, aligning with the breakout’s direction. However, factors like economic data, global risk sentiment, and commodity prices (e.g., dairy exports for NZD) should be monitored. Proper risk management, including stop-loss orders below the support level, is crucial to manage potential reversals. This setup combines a strong technical pattern with clear profit potential, making it appealing for short-to-medium-term trading strategies.

GBP/USD Trend Reversal? Smart Money Entering the Market!GBP/USD is a major forex pair representing the exchange rate between the British Pound (GBP) and the US Dollar (USD). The current price is 1.25100, and the target price is set at 1.27000, indicating an expected upward movement. This trade setup suggests a potential gain of over 200 pips if the price reaches the target. A pip, or "percentage in point," is a standard unit of movement in forex trading, where 1 pip in GBP/USD is 0.0001. The trend line breakout confirms a bullish signal, meaning the price has moved above a key resistance level. Strong volume support indicates that many traders are participating in this move, adding to the momentum. A breakout with high volume often leads to sustained price movement, increasing the likelihood of hitting the target. If the trend continues, traders might see further gains beyond the expected 1.27000 level. However, risk management is crucial, as market conditions can change unexpectedly. Keeping an eye on economic news and key events related to the UK and US economies is essential. Overall, this setup suggests a strong buying opportunity for traders looking to capitalize on the breakout.

Nasdaq insights: 05-Feb-2025Good morning, traders! As a seasoned price action trader, I'll share my Nasdaq insights to help you improve your trading skills.

NASDAQ Potential UpsidesHey Traders, in today's trading session we are monitoring NASDAQ for a buying opportunity around 21,300 zone, NAS100 is trading in an uptrend and currently is in a correction phase in which it is approaching the trend at 21,300 support and resistance area.
Trade safe, Joe.

NASDAQ is potentially OVER pricedSeeing that Nas has been getting weaker against the market makes me think its been propped up a bit and we are open to seeing a decent sized correction to the downside. This will likely shock the media and news but I belive it'll just help the asset reach new highs with a re evaluation of its components at a lower price. Trade Safe, Trade Smart, Trade Drippy!

Why USDCHF is in Retesting Phase? and Expected Trend ReversalUSDCHF is currently trading at 0.91000, with a target price of 0.89900, indicating a short-term bearish movement. The expected price drop of 100+ pips suggests a potential short-selling opportunity. The pair is in a retesting phase, meaning it is re-evaluating a previously broken trendline. This retest occurs after a downtrend, confirming bearish momentum. However, after this small decline, a strong bullish wave is anticipated. The price is expected to recover and move upward toward the 0.93000 level. This suggests a trend reversal after the retracement phase. Traders may consider shorting until 0.89900, then looking for bullish confirmation. Risk management is crucial due to potential market volatility. Analyzing support, resistance, and market sentiment can help refine entry and exit points.

Nasdaq analysis: 04-Feb-2025Good morning, trading community! Today's Nasdaq analysis is for you. Share your thoughts, ask questions, and let me help you grow.

Tuesday Nasdaq Analysis 25.02.04Hello, this is Greedy All-Day.
Today’s analysis focuses on the NASDAQ.
Monday’s NASDAQ Briefing Results
Chart:
Let’s start by reviewing Monday’s briefing results. On the buy side, after the breakout above 21200, the bullish trend continued without any reversal to a sell perspective, and the gap was completely filled. From the entry point, the price increased by about $360, yielding a profit of roughly $6,000 per contract.
On the sell side, no sell entries were triggered, so there were neither profits nor losses.
Daily Chart Analysis
Chart:
Looking at the daily chart, although the gap was filled, the price started to decline again. Overall, the market appears to be converging, and if a breakout occurs in either direction, a major trend reversal is likely. The upper target seems to be around 22100, and the lower target is approximately 20640.
Convergence Movement
Chart:
Since the market is showing converging movement, it makes sense to trade on a breakout from within this convergence.
Buy Perspective:
Entry 1: Enter long on a breakout above the resistance trendline.
Take Profit (TP): At the horizontal level indicated on the chart.
Entry 2: Enter long on a breakout above 21600.
TP: At the horizontal level.
Rationale:
The resistance trendline reflects a short-term trend, and a breakout above 21600—which is near the high of the U.S. session close—confirms bullish momentum.
Sell Perspective:
Entry 1: Enter short if the ascending trendline is broken.
TP: At the horizontal level.
Entry 2: Enter short if the price breaks below 21113.
TP: At the horizontal level.
Entry 3: Enter short if the price breaks below 20943.
Rationale:
The ascending trendline has been in place since February 3, 2025, and has not been broken since.
In a gap-filled scenario, if a break of the trendline is confirmed, it is appropriate to enter a short position.
The level 21113 represents the lower boundary of a short-term supply zone and is considered a critical support level.
For 20943, which is the low of the sharp drop on February 3, a break could trigger a move down to the major convergence level of 20640.
The white and black boxes on the chart denote areas where significant trend reversals have been observed on the daily chart.
Conclusion
The gap has been filled, so there is no further reason for the price to continue rising, and it’s difficult to confirm a bearish trend solely based on that. We believe that it is best to trade according to the market’s movement.
Let’s adapt our strategy accordingly. Have a great day of trading!

NAS 100/SPX 500you can see liquidty on both pairs you had a nice sweep and bullish structure and its also been holding. which ever one gets to the zone last is the one i want to buy and also looking at US30 to sweep

PayPal's Market Crossroads: Rebound or Further Downside?Is PayPal Ready for a Comeback? Key Levels to Watch Now
The digital payment giant PayPal (NASDAQ: PYPL) is at a crucial market intersection. Trading at $88.27, the stock has slipped 14.3% from its absolute high of $103.03, recorded over 900 days ago, but remains 75.6% above its multi-year low of $50.25. With recent buy-side volume spikes and a key resistance challenge at $89.34, the question arises: Is PYPL gearing up for a bullish breakout, or will sellers take control again?
The RSI14 at 33.35 signals an oversold condition, while the MFI60 at 38.5 suggests weakening selling pressure. Meanwhile, major moving averages remain clustered near $89.2-$89.49, hinting at a decisive moment ahead. Adding to the mix, the VSA Buy Pattern Extra 1st recently emerged, a sign of potential accumulation after a sharp decline.
Market sentiment is further fueled by macroeconomic uncertainties, interest rate expectations, and sector-wide volatility in tech and fintech stocks. Will buyers push past resistance, or is another wave of selling ahead? For investors and traders alike, this could be the defining moment to make a move.
PYPL Roadmap: Decoding the Market’s Next Move
The market never moves in a straight line—it's a battlefield of buyers and sellers, where every pattern leaves a footprint. Let's break down PayPal’s (NASDAQ: PYPL) recent price action using the roadmap of confirmed patterns that actually played out, filtering out the noise and focusing on what mattered.
January 27, 2025 - Buy Volumes Max (Buy Signal) PYPL opened at $89.57, climbed to $90.29, and closed at $90.24, with strong buy-side dominance. This signaled the start of an accumulation phase, pushing the price upward.
January 28, 2025 - Buy Volumes Max (Buy Confirmation) The momentum carried forward as PYPL opened at $87.87, surged to $89.36, and closed at $89.16. This confirmed the previous buy signal, proving that demand was actively stepping in. The low of the last three bars at $86.88 acted as the trigger, validating the long setup.
January 28, 2025 - Sell Volumes Max (Reversal Signal) Right after buyers showed strength, sellers hit back hard. The stock opened at $88.82, peaked at $88.85, but closed weak at $88.17. This shift hinted that smart money might be cashing out after the recent rally.
January 30, 2025 - Increased Sell Volumes (Bearish Confirmation) The downward momentum continued as PYPL opened at $90.11, dropped to $88.84, and closed at $89.56. The trigger was met—the breakdown from the previous low played out, confirming that sellers had control.
January 31, 2025 - VSA Buy Pattern Extra 1st (Bullish Reversal) The market didn’t stay bearish for long. A new buy pattern formed as PYPL hit a low of $88.28, bounced off, and closed at $88.56. This was a classic Volume Spread Analysis (VSA) buy signal—a sign that buyers were absorbing supply before a potential upward move.
What’s next? With resistance looming at $89.34, the market is at a crossroads. If bulls take charge, we could see a push to $91.44 and beyond. But if resistance holds, another leg down might be in the cards.
Technical & Price Action Analysis: Key Levels to Watch
When it comes to trading, levels are everything. Whether you’re scalping, swing trading, or positioning for the long haul, understanding where price reacts is what separates winners from bag holders. Here’s the must-watch roadmap for PayPal (NASDAQ: PYPL). If these levels fail, expect them to flip into resistance—because in this game, what was support can quickly become a selling zone.
Support Levels (Dip-Buy Zones)
85.905 – First line of defense. If bulls hold, expect a bounce play. If lost, it’s a new ceiling.
80.96 – Mid-range safety net. A break below would signal real weakness.
79.16 – The last soft support before things get messy.
71.19 – A break here sends alarms—this level needs to hold.
59.9 – If we hit this, something bigger is at play. A strong reaction is expected.
Resistance Levels (Profit-Taking & Rejection Zones)
89.34 – Immediate wall. Bulls need to flip this to keep momentum alive.
91.445 – Strong barrier. A clean break could open breakout conditions.
93.85 – High probability rejection zone. Needs volume to push through.
96.12 – Final boss before a larger rally.
Powerful Support Levels (Last Line of Defense)
102.57 – If we ever reclaim this, it’s game on for higher timeframes.
Powerful Resistance Levels (Big Money Zones)
81.46 – Needs to turn into support for a true trend shift.
70.46 – Heavy weight here. Any test is make-or-break.
58.5 – Historical battleground. Expect strong reactions.
51.09 – If bulls conquer this, deep discount buyers will wake up.
💡 Trading Playbook: If support doesn’t hold, don’t marry the trade—watch for the level to flip into resistance. Same applies in reverse—if resistance breaks, it could be the fuel for a strong bullish continuation. Stay sharp. 🚀
Trading Strategies Using Rays: Precision Entries & Probable Targets
The market moves in waves and phases, not in straight lines. That’s why using Fibonacci-based dynamic rays allows traders to catch moves from ray to ray instead of chasing price at random levels. Each ray is constructed from the beginning of a movement, not traditional highs and lows, making it a leading indicator for upcoming reversals or continuations.
The interaction with rays is what defines trade opportunities. A position is taken only after price touches a ray and confirms movement. Each next ray becomes the target for the trade. Alongside this, the Moving Averages (MA50, MA100, MA200, MA233) act as dynamic factors of support and resistance, strengthening key zones.
💡 Two Trade Scenarios: Be Ready for Both
Optimistic Scenario (Breakout & Trend Continuation)
If PYPL pushes above $89.34 resistance and secures a close, momentum traders can look for:
Entry: After interaction with the ray at $89.34
Target 1: $91.445 (next ray)
Target 2: $93.85 (if buying volume confirms)
Target 3: $96.12 (longer-term extension)
🚀 Trade Rationale: Bullish confirmation through ray breakout & support retest. RSI & MFI confirming strength.
Pessimistic Scenario (Rejection & Drop to Lower Rays)
If PYPL fails to break $89.34 and shows weakness:
Entry: After rejection from the ray at $89.34
Target 1: $85.905 (next lower ray)
Target 2: $80.96 (if bearish continuation forms)
Target 3: $79.16 (major liquidity grab zone)
🔥 Trade Rationale: If price rejects resistance and closes below MA50/MA100, sellers gain control.
💰 Potential Trade Setups Based on Ray Interactions
Ray-to-Ray Breakout Trade (Momentum Play)
If price closes above $89.34 → Enter long targeting $91.445.
If price closes above $91.445 → Ride the wave to $93.85.
Ray-to-Ray Breakdown Trade (Short Play)
If price fails at $89.34 → Enter short to $85.905.
If price loses $85.905 → Target next ray at $80.96.
Moving Average Interaction Play (Reversal Signal)
If price bounces off MA233 ($88.67) → Go long, targeting next ray up.
If price breaks below MA233 → Short it down to next key ray.
These strategies allow flexibility—reacting to price instead of guessing moves. Whether it’s a breakout ride or a rejection short, the market always provides opportunities for those watching the right signals. Stay ready. 🚀🔥
What’s Next? Let’s Talk in the Comments!
Trading isn’t just about setups—it’s about understanding the game and watching how price reacts to key levels. That’s why I want you to do one thing: save this idea, hit Boost, and check back later to see how price moves according to my ray-based system.
Have questions or want to discuss a specific asset? Drop a comment! I always read them and will answer whenever I can. Want a full breakdown on your favorite stock, crypto, or forex pair? Let’s talk—I can do some analysis publicly or, if you want to keep it private, we can work something out.
My indicator automatically maps out all rays and key levels—no guesswork, just clean structure. But it's available only in Private. If you’re interested, send me a message, and I’ll explain how you can get access.
And if you want a custom markup for any asset, I can do that too. Just hit Boost, drop your request in the comments, and I’ll add it to my list. If you're serious about improving your trading, follow me here on TradingView—this is where I post real setups that actually play out.
Markets move, opportunities come and go—let’s make sure you catch the next one. 🚀🔥

NASDAQ-REGN at a Crossroads: Breakdown or Breakout?The Market’s Dilemma: Is REGN Ready for a Reversal?
The biotech giant Regeneron Pharmaceuticals (NASDAQ: REGN) is hovering at a critical juncture. Trading at $672.98, the stock has plummeted 44.4% from its all-time high of $1211.19 just five months ago. With the RSI at 38.8, the market is edging toward oversold conditions—but does that mean a bounce is imminent, or is further downside in store?
Recent sell volume spikes and bearish VSA patterns suggest institutional distribution, while key support at $669.24 is under pressure. If buyers fail to hold this level, the next move could be decisive. Meanwhile, resistance looms at $693.67, creating a tight battlefield between bulls and bears.
With momentum indicators flashing caution and a looming test of critical levels, traders must ask: Is REGN poised for a short-term rally, or are we witnessing the start of an extended breakdown? Stay sharp—this might be the last chance to act before the next major move.
NASDAQ-REGN Roadmap: A Pattern-Driven Journey
The price action on Regeneron Pharmaceuticals (NASDAQ: REGN) has been painting a vivid picture of institutional maneuvering. By analyzing the sequential Volume Spread Analysis (VSA) and buy/sell volume patterns, we can uncover the footprints of smart money and determine where the next big move might emerge. Let’s break it down step by step.
January 22: The Battle Between Bulls and Bears
A VSA Buy Pattern Extra 1st appeared, signaling a potential reversal after prolonged selling. The open was at $682.89, but the close dipped to $679.24, showing hesitation. However, a competing Sell Volumes Max pattern on the same day added to the confusion. The key takeaway? The market was indecisive, but the tug-of-war suggested a major breakout was brewing.
January 23: Buyers Step Up
A surge in buy volumes confirmed the bullish bias. With an open at $692.165 and a close at $694.36, bulls showed their dominance. This validated the previous buy setup and confirmed that institutions were stepping in.
January 24: A Bullish Fake-Out?
The VSA Manipulation Buy Pattern 3rd hinted at continued strength. The market opened at $680.78 and closed higher at $683.75, pushing past short-term resistance. However, the presence of a Buy Volumes Takeover pattern earlier in the day, which was immediately sold off, hinted at hidden distribution. The market was climbing, but the undercurrent wasn’t as strong as it seemed.
January 27-31: Sellers Take Control
A clear shift in sentiment emerged as Sell Volumes Max patterns took over. On January 27, the market opened at $685.17 but barely moved, closing at $684.67—a sign of exhaustion. Then, on January 30-31, massive sell volumes hit, confirming distribution. The price tumbled from $684.17 to $676.50, sealing the bearish outlook.
Key Takeaway: Where Do We Go From Here?
The January 23-24 bullish patterns initially suggested an upside continuation, but the surge in selling pressure from January 27 onward negated that move. The market failed to hold its ground, confirming the strength of the selling signals. With support at $669.24 under fire, the next key zone to watch is $652-655. If bulls don’t reclaim momentum soon, REGN could be setting up for a deeper correction. Stay sharp—the next move is brewing.
Technical & Price Action Analysis: Key Levels in Play
The market structure on NASDAQ-REGN is shifting, and traders need to keep an eye on these critical levels. If support zones fail to hold, they flip into resistance—trapping late buyers and fueling further downside moves. Likewise, if resistance levels break, they become new bases for continuation plays.
Support Levels:
669.24 – The immediate support zone; losing this level could open the floodgates for deeper selling.
592.7 – A major downside target if sellers gain full control. This level previously acted as a demand zone.
547.57 – The last stand for bulls before things get ugly. Below here, expect a momentum flush.
Resistance Levels:
693.67 – The first wall bulls need to break for any short-term recovery. A failure here keeps the bears in charge.
707.835 – A psychological pivot; clearing this would suggest a trend shift.
752.54 – Major battle zone. If reached, expect serious profit-taking.
784.1 – Key breakout threshold; breaking and holding above opens the door for a bigger upside run.
810.53 – The big league level. Any rally stalling here signals trend exhaustion.
Powerful Support Levels:
945.71 – Long-term structure zone. If the price ever reclaims this level, bulls are fully back in control.
985.9 – The pivot point for a full-blown trend reversal.
1175.16 – The holy grail for long-term investors; reclaiming this would signal a multi-month rally.
Powerful Resistance Levels:
575.46 – A historical battleground; failure to hold here sends a strong bearish signal.
549.69 – A make-or-break level for dip buyers. If sellers push below, expect panic exits.
The playbook is simple: react, don’t predict. Watch for confirmations, volume shifts, and price reactions at these levels. No clean break? No trade. The market always shows its hand—just follow the footprint.
Trading Strategies Using Rays: Precision in Action
The "Rays from the Beginning of Movement" concept is built on dynamic Fibonacci-based levels that adapt to market conditions. Unlike traditional support and resistance levels, these rays adjust automatically as price action evolves, providing a leading rather than lagging perspective. The goal is not to predict exact levels but to identify high-probability zones where price interactions signal trend continuation or reversal.
These rays interact with VSA dynamics and moving averages, making them powerful confirmation tools. The price will move from ray to ray, establishing first, second, and third trade targets accordingly. Entries should be made only after interaction with the ray and confirmation of direction.
Optimistic Scenario: Bullish Ray Interaction
Entry near 669.24 (support level + interaction with a rising ray)
First target: 693.67 (resistance level aligned with MA50)
Second target: 707.83 (breakout level with confirmation from VSA)
Third target: 752.54 (major resistance, completion of the wave)
💡 If momentum is strong, price could extend toward 784.1, aligning with long-term trend acceleration.
Pessimistic Scenario: Bearish Ray Interaction
Entry after breakdown of 669.24 (failure to hold as support flips to resistance)
First target: 592.7 (next structural level, confirming bearish intent)
Second target: 547.57 (full breakdown level, aligning with MA200 interaction)
Third target: 575.46 (major psychological barrier—either reversal or trend continuation)
💡 If the bearish wave extends, price may push toward 549.69, signaling further downside.
Potential Trades Based on Ray Interaction
Buy from 669.24 → Target 693.67 – Confirmation required via VSA buy volumes.
Breakout above 693.67 → Target 707.83 – Only valid if price holds above MA50.
Sell below 669.24 → Target 592.7 – Valid only after a strong bearish volume surge.
Rejection at 707.83 → Short to 669.24 – Reversal signal from VSA sell zones.
Your Turn: Let’s Trade Smart Together! 🚀
If this analysis makes sense to you, hit that Boost and save this idea—because the key to trading is understanding the levels where trades can be executed. Follow how the price moves and compare it to my setup. The market always speaks to those who listen.
Got questions? Drop them in the comments! Let’s break things down together. If you need an analysis of another asset, let me know—we can figure out the best way to do it. Some I can share for free, while for private setups, we can discuss the details.
My strategy automatically plots all rays and levels, but the indicator is available only in Private. If you want to trade using this system, send me a direct message.
These rays work on all assets, and price moves like clockwork along them. If you want me to chart your asset, hit Boost and comment below. The more interest, the higher the chance I’ll cover your instrument next!
Follow me here on TradingView—no fluff, no hype, just **clear levels and market logic.**🔥

Nasdaq-100 H1 | Potential bearish reversalNasdaq-100 (NAS100) is rising towards a pullback resistance and could potentially reverse off this level to drop lower.
Sell entry is at 21,179.71 which is a pullback resistance.
Stop loss is at 21,382.00 which is a level that sits above the 50.0% Fibonacci retracement and an overlap resistance.
Take profit is at 20,777.93 which is a swing-low support.
High Risk Investment Warning
Trading Forex/CFDs on margin carries a high level of risk and may not be suitable for all investors. Leverage can work against you.
Stratos Markets Limited (www.fxcm.com):
CFDs are complex instruments and come with a high risk of losing money rapidly due to leverage. 63% of retail investor accounts lose money when trading CFDs with this provider. You should consider whether you understand how CFDs work and whether you can afford to take the high risk of losing your money.
Stratos Europe Ltd (www.fxcm.com):
CFDs are complex instruments and come with a high risk of losing money rapidly due to leverage. 63% of retail investor accounts lose money when trading CFDs with this provider. You should consider whether you understand how CFDs work and whether you can afford to take the high risk of losing your money.
Stratos Trading Pty. Limited (www.fxcm.com):
Trading FX/CFDs carries significant risks. FXCM AU (AFSL 309763), please read the Financial Services Guide, Product Disclosure Statement, Target Market Determination and Terms of Business at www.fxcm.com
Stratos Global LLC (www.fxcm.com):
Losses can exceed deposits.
Please be advised that the information presented on TradingView is provided to FXCM (‘Company’, ‘we’) by a third-party provider (‘TFA Global Pte Ltd’). Please be reminded that you are solely responsible for the trading decisions on your account. There is a very high degree of risk involved in trading. Any information and/or content is intended entirely for research, educational and informational purposes only and does not constitute investment or consultation advice or investment strategy. The information is not tailored to the investment needs of any specific person and therefore does not involve a consideration of any of the investment objectives, financial situation or needs of any viewer that may receive it. Kindly also note that past performance is not a reliable indicator of future results. Actual results may differ materially from those anticipated in forward-looking or past performance statements. We assume no liability as to the accuracy or completeness of any of the information and/or content provided herein and the Company cannot be held responsible for any omission, mistake nor for any loss or damage including without limitation to any loss of profit which may arise from reliance on any information supplied by TFA Global Pte Ltd.
The speaker(s) is neither an employee, agent nor representative of FXCM and is therefore acting independently. The opinions given are their own, constitute general market commentary, and do not constitute the opinion or advice of FXCM or any form of personal or investment advice. FXCM neither endorses nor guarantees offerings of third-party speakers, nor is FXCM responsible for the content, veracity or opinions of third-party speakers, presenters or participants.

New Monday to trade in Nasdaq 25.02.03Hello, this is Greedy All-Day.
Today’s analysis focuses on the NASDAQ.
NASDAQ Daily Chart Analysis
Chart:
Let’s start by examining the daily chart. Although the chart from the past week is packed with material for a briefing, I intentionally took a break from watching the NASDAQ during the holiday period.
What we observe now is that the red box level corresponds to the deep dip that appeared last Monday.
There was a gap down at the green box, and before Friday’s close, the gap was filled via an upper wick.
Today, however, the NASDAQ has experienced another gap down, and even the lower boundary of the Ichimoku Cloud failed to hold as support. The market broke down and is now trading sideways.
Major Support and Resistance Zones on the Daily Chart
Chart:
On the daily chart, the green box zone indicates that if today’s open at 21200 manages to break upward, the gap could be filled up to around 21534.
Regarding the yellow box, due to the sharp drop on 25.01.27, the low was set higher than on 25.01.13; support has been established in the range of 20763–20694.
Thus, if the price declines further, whether the yellow box support holds will be critical.
Where to Trade Today? – 15-Minute Chart Analysis
Chart:
Buy Perspective:
Entry Trigger: A breakout above the purple box at 21200.
Rationale: Rather than trading impulsively, I recommend a long entry based on the possibility of filling the gap if today’s high is broken.
Risk: The overall trend remains bearish.
Sell Perspective:
Entry Trigger:
Option 1: A break of the short-term ascending trendline.
Option 2: A break below today’s low at 20943.
Rationale:
This signal indicates significant risk and suggests that the market is overheated—possibly on the verge of a bubble burst.
Risk:
Although the trend is bearish, entering a short position at the tail-end of a move raises questions about how far the price may fall. It is advisable to set targets based on major support levels.
Conclusion
I am observing a chaotic market, and it appears that this downtrend may just be getting started.
Stay patient and cautious, and always trade based on key levels and strategic risk management.
Happy trading, and let’s finish the week strong! 🚀

Nasdaq market analysis: 03-Feb-2025Good morning! Happy New Week! Happy New Month! Here's your daily Nasdaq market analysis. Learn, grow, and trade wisely.

Navigating NAS100 with Key Levels and Market SentimentKey Levels:
Resistance remains at 21,600–21,700, where price is struggling to sustain higher levels.
Support lies around 20,800–21,000, a strong buy zone on higher timeframes.
Fundamental Outlook:
With upcoming key data (FOMC and GDP), markets are likely to remain volatile.
A hawkish FOMC statement may lead to bearish pressure, pushing NAS100 lower toward the 20,800–21,000 support zone.
Conversely, dovish commentary or weak GDP figures could provide a bullish breakout above 21,600, targeting 21,800–22,000.
Rationale:
The price is testing a major resistance zone (21,600–21,700) but shows signs of hesitation and rejection on multiple timeframes.
A hawkish FOMC decision or commentary could trigger a sell-off, aligning with the probability of bearish momentum.
Action:
If price fails to break and hold above 21,600, short near 21,550–21,600.
Stop Loss: 21,700
Take Profits:
TP1: 21,300
TP2: 21,000
TP3: 20,800
Focus on a short position, especially if price fails to sustain above 21,600 during the London or New York sessions

NASDAQ Breakout And Potential RetraceHey Traders, in today's trading session we are monitoring NAS100 for a selling opportunity around 21400 zone, NASDAQ was trading in an uptrend and successfully managed to break it out. Currently is in a correction phase in which it is approaching the retrace area at 21400 support and resistance area.
Trade safe, Joe.

