Nasdaq Insights: Today’s Tips 17-OCT-2024Good morning, trading community! Today's Nasdaq analysis is for you. Share your thoughts, ask questions, and let's grow together.
NASDAQ 100 CFD

WOLFSPEED Rallies! Long Trade Hits All Targets, Bulls DominateTechnical Analysis: Wolfspeed – 15-Minute Timeframe (Long Trade)
Wolfspeed demonstrated strong bullish momentum, with a long trade entry at 10.23 and successfully reaching all profit targets.
Key Levels
Entry: 10.23 – The long position was initiated at this level, marking the start of a strong upward movement.
Stop-Loss (SL): 9.75 – Positioned below recent support to manage risk and protect against potential downside.
Take Profit 1 (TP1): 10.83 – The first target was achieved, confirming the strength of the bullish trend.
Take Profit 2 (TP2): 11.80 – Continued momentum pushed the price to this level.
Take Profit 3 (TP3): 12.77 – The bullish rally extended further, reaching this target.
Take Profit 4 (TP4): 13.37 – The final target, signaling a complete and highly successful upward move.
Trend Analysis
The price has consistently remained above the Risological Dotted trendline, affirming the strength of the uptrend. The bullish surge indicates strong market interest, supporting further upward moves, though all profit targets have been met.
The long trade on Wolfspeed performed exceptionally well, hitting all designated targets. The final TP4 at 13.37 reflects a robust upward trend, well-supported by the Risological Dotted trendline. The sustained buying pressure indicates that the bulls have maintained control throughout the move.

ASML Holding Falls! Short Trade Hits TP1, More Targets AheadASML Holding has shown a strong bearish movement, reaching Take Profit 1 (TP1) at 742.16.
Key Levels
Entry: 792.37 – A short position was initiated at this level, guided by the precision of the Risological Swing Trader.
Stop-Loss (SL): 832.99 – Positioned above recent resistance to protect against a potential reversal.
Take Profit 1 (TP1): 742.16 – Already achieved, confirming the effectiveness of the short setup.
Take Profit 2 (TP2): 660.92 – The next target in line as downward momentum continues.
Take Profit 3 (TP3): 579.68 – A further target if the bearish trend persists.
Take Profit 4 (TP4): 529.48 – The ultimate target, indicating a significant decline.
Trend Analysis
The price is moving firmly below the Risological Dotted trendline, indicating a strong downtrend. The sustained bearish pressure suggests the potential for further declines towards TP2 and beyond.
With TP1 already hit, ASML Holding continues to show promise for further downside, guided by the Risological Swing Trader. The short trade remains positioned to capture additional opportunities as the trend continues to favor the bears.

Nasdaq Sell Idea Looking for a potential sell with a shift in market structure on the lower 1 minute timeframe.

NAS100 Technical Analysis & Trade Idea PLUS Navigating S&R👀👉 The NAS100 has been showing a solid bullish trend on the higher time frames, however we are seeing a pullback currently. I'm closely watching for a potential buying opportunity based on key conditions outlined in the video. We'll explore the critical price action signals to watch for and how to position yourself effectively to capitalize on the next move. Disclaimer: This analysis is provided for informational purposes only and should not be considered financial advice.📊✅

Nasdaq Overview: Market Analysis 16-OCT-2024Good morning! Here's your daily Nasdaq market analysis. Learn, grow, and trade wisely.

NASDAQ 100 Drops! Short Trade Confirmed, Eyeing First TargetThe NASDAQ 100 has confirmed a short trade with a strong bearish move below the entry at 20263.46. The price is progressing towards the first profit target (TP1), though it has not yet been reached.
Key Levels
Entry: 20263.46 – The short position was confirmed as the price broke below this level, signaling bearish momentum.
Stop-Loss (SL): 20378.68 – Placed above the recent resistance to protect against potential upside reversals.
Take Profit 1 (TP1): 20121.04 – The first target, not yet reached, but in close proximity as the downward trend continues.
Take Profit 2 (TP2): 19890.59 – The next target in case of continued bearish pressure.
Take Profit 3 (TP3): 19660.15 – A further downside target, aligning with the next support zone.
Take Profit 4 (TP4): 19517.73 – The ultimate profit target, marking a significant decline.
Trend Analysis
The price has broken below the Risological Dotted trendline, confirming strong bearish sentiment. The market is likely to move toward TP1 if the selling pressure continues. The downward momentum suggests further potential to reach deeper profit targets.
The NASDAQ 100 short trade is progressing well after confirmation, with TP1 at 20121.04 in sight. If the bearish trend holds, further downside targets are expected to be reached.
NAS100 H4 | Falling to pullback supportNAS100 is falling towards a pullback support and could potentially bounce off this level to climb higher.
Buy entry is at 20,333.22 which is a pullback support that aligns with the 23.6% Fibonacci retracement level.
Stop loss is at 20,020.00 which is a level that lies underneath an overlap support and the 50.0% Fibonacci retracement level.
Take profit is at 20,789.44 which is a level that aligns with the 161.8% Fibonacci extension level.
High Risk Investment Warning
Trading Forex/CFDs on margin carries a high level of risk and may not be suitable for all investors. Leverage can work against you.
Stratos Markets Limited (www.fxcm.com):
CFDs are complex instruments and come with a high risk of losing money rapidly due to leverage. 62% of retail investor accounts lose money when trading CFDs with this provider. You should consider whether you understand how CFDs work and whether you can afford to take the high risk of losing your money.
Stratos Europe Ltd (www.fxcm.com):
CFDs are complex instruments and come with a high risk of losing money rapidly due to leverage. 59% of retail investor accounts lose money when trading CFDs with this provider. You should consider whether you understand how CFDs work and whether you can afford to take the high risk of losing your money.
Stratos Trading Pty. Limited (www.fxcm.com):
Trading FX/CFDs carries significant risks. FXCM AU (AFSL 309763), please read the Financial Services Guide, Product Disclosure Statement, Target Market Determination and Terms of Business at www.fxcm.com
Stratos Global LLC (www.fxcm.com):
Losses can exceed deposits.
Please be advised that the information presented on TradingView is provided to FXCM (‘Company’, ‘we’) by a third-party provider (‘TFA Global Pte Ltd’). Please be reminded that you are solely responsible for the trading decisions on your account. There is a very high degree of risk involved in trading. Any information and/or content is intended entirely for research, educational and informational purposes only and does not constitute investment or consultation advice or investment strategy. The information is not tailored to the investment needs of any specific person and therefore does not involve a consideration of any of the investment objectives, financial situation or needs of any viewer that may receive it. Kindly also note that past performance is not a reliable indicator of future results. Actual results may differ materially from those anticipated in forward-looking or past performance statements. We assume no liability as to the accuracy or completeness of any of the information and/or content provided herein and the Company cannot be held responsible for any omission, mistake nor for any loss or damage including without limitation to any loss of profit which may arise from reliance on any information supplied by TFA Global Pte Ltd.
The speaker(s) is neither an employee, agent nor representative of FXCM and is therefore acting independently. The opinions given are their own, constitute general market commentary, and do not constitute the opinion or advice of FXCM or any form of personal or investment advice. FXCM neither endorses nor guarantees offerings of third-party speakers, nor is FXCM responsible for the content, veracity or opinions of third-party speakers, presenters or participants.

Nasdaq Update: Today’sInsights 15-OCT-2024Hey traders! Ready to dive into today's Nasdaq market analysis? Let's compare notes, share insights, and become better traders together.

NAS100 Price ActionIf you followed the previous setup where I marked the 4H high, you’ll notice it’s already swept and made a new high. The strategy is simple: wait for the liquidity sweep, then look for a Fair Value Gap (FVG) at lower timeframe 5M or 15M for entry and target the next 4H Swing Low. I also recommend targeting FVGs, as you can see I’ve set my Take Profit at the Fair Value Gap zone. This is a liquidity-based strategy, so there’s no need to follow the daily bias—just flow with the market movement.
Wishing you all the best and happy trading!
Thank you.

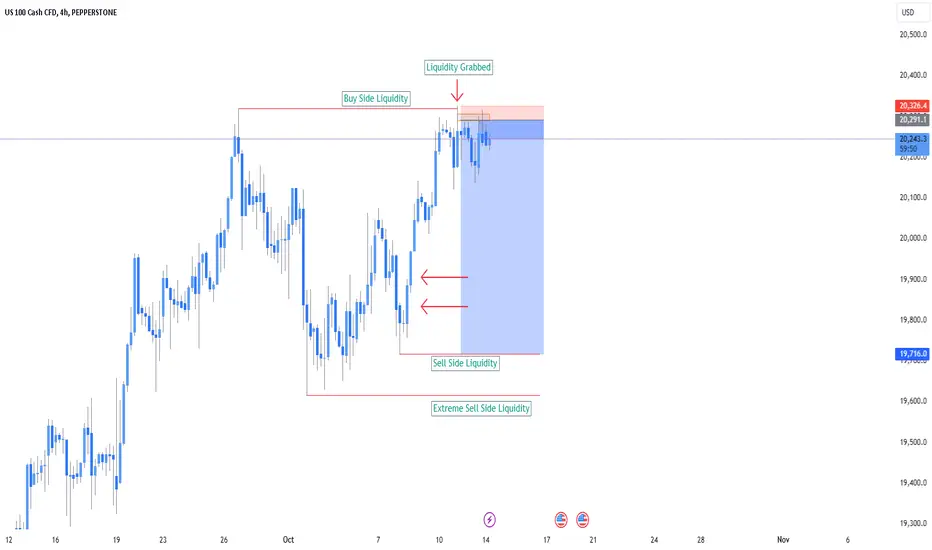
NAS100 Will Go Lower! Short!
Take a look at our analysis for NAS100.
Time Frame: 9h
Current Trend: Bearish
Sentiment: Overbought (based on 7-period RSI)
Forecast: Bearish
The market is approaching a significant resistance area 20,310.2.
Due to the fact that we see a positive bearish reaction from the underlined area, I strongly believe that sellers will manage to push the price all the way down to 19,716.0 level.
P.S
We determine oversold/overbought condition with RSI indicator.
When it drops below 30 - the market is considered to be oversold.
When it bounces above 70 - the market is considered to be overbought.
Like and subscribe and comment my ideas if you enjoy them!

Dotcom Burst vs Tech Burst- i wanted to make this chart for long but i had to wait some confirmations, because i took an higher TF.
- Right now is really interesting to compare the dot-com bubble burst in 2000 versus the actual situation.
- like always i won't talk too much about FA because everything can happen in our world :
- Aliens destroy us.
- Putin push the red button.
- Meteorite hits earth.
- Jerome H. Powell printers no more electricity.
- let's back to the chart and i will try to make it simple :
- This chart is based on a 3 Months Timeframe, so 1 columns = 3 months.
- This graph is based purely on MACD and his Death Cross ( i will call it "DC" to short it)
The Dotcom Burst :
1/ in 2000, Nasdaq took a violent dip before MACD DC. ( 12 Months before ) ( Red Vertical Line )
2/ after that MACD DC, Nasdaq continued his downtrend but the dip started to be lighter for 15 Months. (Orange Vertical Line)
3/ The Storm was over in 2002 and Nasdaq started a consolidation to prepare his next parabolic move. ( Green Vertical Line )
The Tech Burst :
1/ The real dip happened already 12 months from now (Before MACD DC). ( Red Vertical Line )
2/ The MACD DC happened already 3+ months ago from now. ( Orange Vertical Line )
3 / We are still in a downtrend and not yet entered a recovery phase.
- What we can conclude is simple :
- When MACD Death Cross. The big dip is already behind us.
- Right now nothing is really different from 2000 in matter of TA, only the big numbers are different.
- " Mastering trading is anticipating movements, following the flow in real time means you are already late ".
Happy Tr4Ding !
PS : There's also something different in matter of time if u compare those charts. if you find it.. i will congratulate you !

Nasdaq Market Review: 14-OCT-2024Good morning, everyone! Today's Nasdaq analysis is designed to educate and empower. Use these insights to refine your price action trading strategy.

NASDAQ SHORT TRADE IDEAMarket Makers' Bias:
-Fund Managers are currently holding net selling positions and signaling a bearish divergence on the Weekly price chart.
The last time Fund Managers showed net buying positions with a bullish divergence, the market rallied for an entire week afterward; Now a bearish divergence
Additional Fundamental Bias:
-The Nasdaq appears overvalued relative to U.S. Treasury bonds, suggesting that tech stocks within the Nasdaq Index, such as #AAPL, #META, and #GOOG, may be similarly overvalued and likely to experience a downturn.
-We also have Price gaps, they normally act as a magnet to be filled.
Technical Analysis portion:
-We are just hit the weekly covered daily Supply zone, price could be ready for a bearish move now.
-Opposing gap zones and Demand zone can be your potential profit target.
OTHERS:
>Scalpers can ride the bullish trending week
>Long term traders can position for a Sell for next week or position a Long trade at Supply for a retest.
***As always, trade safe and make sure to do your due diligence when analyzing the charts.***
Let’s see how this plays out... 👀👀

NAS100 Price ActionHello Traders,
The market is open, and today I’d like to share a simple yet effective strategy that can help you achieve a risk-to-reward ratio of 1:5, or even up to 1:15.
Start with a higher timeframe – I personally prefer using the 4-hour chart. Identify the swing high (which represents buy-side liquidity) and the swing low (representing sell-side liquidity).
Once the price grabs either the buy-side or sell-side liquidity, switch to a 5-minute or 15-minute chart.
Look for a Fair Value Gap (FVG), which will be your entry point. Set your target at the next swing low, just like I’ve done in this setup.
NOTE - Make sure trades are open or active during London/New York Session!
Even with a 40% win rate, this strategy can put you ahead in the long run.
Good luck, and thank you!
WEEKLY FOREX FORECAST OCT. 14-18th: BUY THE NASDAQ 100? YES!The NASDAQ looks to have supporting structure for higher prices. The bullish momentum is there, but it lacks the +FVGs that are present in the S&P500. Bullish, yes, but a bit weaker
There is some potential for a limited pullback, though. But I would view it as a better price for a possible long entry.
What are your thoughts....?
Check the comments section below for updates regarding this analysis throughout the week.
Enjoy!
May profits be upon you.
Leave any questions or comments in the comment section.
I appreciate any feedback from my viewers!
Like and/or subscribe if you want more accurate analysis.
Thank you so much!
Disclaimer:
I do not provide personal investment advice and I am not a qualified licensed investment advisor.
All information found here, including any ideas, opinions, views, predictions, forecasts, commentaries, suggestions, expressed or implied herein, are for informational, entertainment or educational purposes only and should not be construed as personal investment advice. While the information provided is believed to be accurate, it may include errors or inaccuracies.
I will not and cannot be held liable for any actions you take as a result of anything you read here.
Conduct your own due diligence, or consult a licensed financial advisor or broker before making any and all investment decisions. Any investments, trades, speculations, or decisions made on the basis of any information found on this channel, expressed or implied herein, are committed at your own risk, financial or otherwise.

NAS100 I Potential correction and more growth Welcome back! Let me know your thoughts in the comments!
** NAS100 Analysis - Listen to video!
We recommend that you keep this pair on your watchlist and enter when the entry criteria of your strategy is met.
Please support this idea with a LIKE and COMMENT if you find it useful and Click "Follow" on our profile if you'd like these trade ideas delivered straight to your email in the future.
Thanks for your continued support!Welcome back! Let me know your thoughts in the comments!


Nasdaq Analysis: Outlook for Oct-11-2024Rise and shine, traders! Start your day with actionable Nasdaq insights. Let's grow your skills together, one chart at a time.

NAS100 played out awesome!last night we did a break video where we wanted nas to do a pull back for potential buys and it worked out great!

US100 after CPIAfter 2:30 PM news, and a little fake descent, US100 is back on track for its uptrend.
Supposed to hit a higher high before friday night.

Nasdaq Market Insights - Oct 10, 2024Good morning, traders! Welcome to today's Nasdaq market analysis. Compare my price action insights with your own charts and enhance your trading skills.

WEEKLY FOREX FORECAST SEPT 7-11th: SP500, NASDAQ, DOW JONESThe 3 Indices are in position to move higher. I am looking for long setups only, as my bias is bullish. My targets are the PWHs, and potentially ATHs.
My bias changes with a break below the Weekly FVGs.
Check the comments section below for updates regarding this analysis throughout the week.
Enjoy!
May profits be upon you.
Leave any questions or comments in the comment section.
I appreciate any feedback from my viewers!
Like and/or subscribe if you want more accurate analysis.
Thank you so much!
Disclaimer:
I do not provide personal investment advice and I am not a qualified licensed investment advisor.
All information found here, including any ideas, opinions, views, predictions, forecasts, commentaries, suggestions, expressed or implied herein, are for informational, entertainment or educational purposes only and should not be construed as personal investment advice. While the information provided is believed to be accurate, it may include errors or inaccuracies.
I will not and cannot be held liable for any actions you take as a result of anything you read here.
Conduct your own due diligence, or consult a licensed financial advisor or broker before making any and all investment decisions. Any investments, trades, speculations, or decisions made on the basis of any information found on this channel, expressed or implied herein, are committed at your own risk, financial or otherwise.
