Nasdaq continuation sellsH4: STILL BULLISH INTERNALLY WITH OUR LAST SIGNIFICANT HL AT 21000
-Possible major chOch on H4 is very possible due to the HTF major zone we at
-Wait for proper H1 & lower tineframe confirmations before jumping in any trades
H1: BEARISH MARKET STRUCTURE STARTING TO PLAY WITH LAST LH AT 21925
-Potential continuation of sells all the way down to take out H4 hl a 21000
-We recently broke below a buying range on H1 & created a selling range
-Possible pullback buys before sells within that range are imminent
M15: We have a nice supply+fvg for sells at 21835
-Wait for price to pullback in there then M1 chOch then attack
NASDAQ 100 CFD

NASDAQ READY TO CONTINUE THE LONG-TERM WEEKLY BULLISH RUN
FX:NAS100
I just entered this buy trade on Nasdaq on the daily time frame.
The trade setup is a Swing trade following the monthly and weekly orderflow.
The Monthly is bullish, the weekly is also bullish, so I entered on the daily time frame retracement.
My overall take profit is a risk reward of 1:4.

NASDAQ Potential UpsidesHey Traders, in the coming week we are monitoring NAS100 for a buying opportunity around 21,500 zone, NASDAQ is trading in an uptrend and currently is in a correction phase in which it is approaching the trend at 21,500 support and resistance area.
Trade safe, Joe.

Hanzo / Nas100 30 Min ( Accurate Tactical Break Out Zones )🔥 Nas100 – 30 Min Scalping Analysis (Bearish Setup)
⚡️ Objective: Precision Breakout Execution
Time Frame: 30-Minute Warfare
Entry Mode: Only after verified breakout — no emotion, no gamble.
👌Bullish After Break : 21710
Price must break liquidity with high volume to confirm the move.
👌Bullish After Break : 21550
Price must break liquidity with high volume to confirm the move.
☄️ Hanzo Protocol: Dual-Direction Entry Intel
➕ Zone Activated: Strategic liquidity layer detected — mapped through refined supply/demand mechanics. Volatility now rising. This isn’t noise — this is bait for the untrained. We're not them.
🩸 Momentum Signature Detected:
Displacement candle confirms directional intent — AI pattern scan active.
— If upward: Bullish momentum burst.
— If downward: Aggressive bearish rejection.
Hanzo / Nas100 30 Min ( Accurate Tactical Break Out Zones )

NASDAQ - UniverseMetta - Signal#NASDAQ - UniverseMetta - Signal
D1 - Formation of a narrowing diagonal + price broke through the lower trend line through a 3-wave structure. It is better not to increase risks. Stop behind the maximum of the 1st wave.
Entry: 21509.0
TP: 20986.3 - 20372.2 - 19784.5 - 18396.7
Stop: 22160.6

Nas100 target reached.I uploaded a trade idea of this yesterday and these are the results, I used proper risk management and proper execution approach!

Nasdaq 100 Trade idea for the day and bias.This is what I'm expecting Nas100 to do today looking at the higher timeframe structure.

Hanzo / Nas100 30 Min ( Accurate Tactical Break Out Zones )🔥 Nas100 – 30 Min Scalping Analysis (Bearish Setup)
⚡️ Objective: Precision Breakout Execution
Time Frame: 30-Minute Warfare
Entry Mode: Only after verified breakout — no emotion, no gamble.
👌Bullish After Break : 21840
Price must break liquidity with high volume to confirm the move.
👌Bullish After Break : 21930
Price must break liquidity with high volume to confirm the move.
👌Bearish After Break : 21755
Price must break liquidity with high volume to confirm the move.
☄️ Hanzo Protocol: Dual-Direction Entry Intel
➕ Zone Activated: Strategic liquidity layer detected — mapped through refined supply/demand mechanics. Volatility now rising. This isn’t noise — this is bait for the untrained. We're not them.
🩸 Momentum Signature Detected:
Displacement candle confirms directional intent — AI pattern scan active.
— If upward: Bullish momentum burst.
— If downward: Aggressive bearish rejection.
🦸♂️ Tactical Note:
The kill shot only comes after the trap is exposed and volume betrays their position.
Hanzo / Nas100 30 Min ( Accurate Tactical Break Out Zones )

NASDAQ Consolidation: Why Sitting Out Is Sometimes the Best PlayI'm currently monitoring the NASDAQ (US100) closely, and on the 4-hour chart, we can clearly see that the market is in a phase of consolidation 🔍
Yesterday, I was anticipating a bullish breakout, which could have signaled the start of a structure with higher highs and higher lows — something that would have presented a clean long opportunity 📈. However, during the U.S. session, the NAS100 momentum shifted and we instead saw a bearish breakdown, invalidating the previous setup 🚫
As things stand now, there's no clear directional bias on the 4H — just a sideways range with neither bulls nor bears in full control 🤝. This type of environment calls for patience and discipline.
It's worth noting that knowing when not to trade is just as important as knowing when to pull the trigger. Sitting on the sidelines and allowing the market to make the next move — whether that’s a break above or below this consolidation range — is a valid and often wise decision 🧘♂️📊
At the moment, my preference is to remain neutral and let price show its hand before committing to a position.
⚠️ Disclaimer:
This analysis is for educational purposes only and does not constitute financial advice. Always do your own research and apply proper risk management when trading.

Missiles in the Middle East, Headwinds on Nasdaq: NAS100 onHey There;
The trend line on the NAS100 has been broken to the downside. My target level after this breakout is 21,299.47. If the price moves towards this level, I think it will reach my target in line with fundamental analysis due to the broken trend line and Iran-Israel war tensions.
I meticulously prepare these analyses for you, and I sincerely appreciate your support through likes. Every like from you is my biggest motivation to continue sharing my analyses.
I’m truly grateful for each of you—love to all my followers💙💙💙

Hanzo / Nas100 30 Min ( Accurate Tactical Break Out Zones )🔥 Nas100 – 30 Min Scalping Analysis (Bearish Setup)
⚡️ Objective: Precision Breakout Execution
Time Frame: 30-Minute Warfare
Entry Mode: Only after verified breakout — no emotion, no gamble.
👌Bullish After Break : 21930
Price must break liquidity with high volume to confirm the move.
👌Bearish After Break : 21770
Price must break liquidity with high volume to confirm the move.
☄️ Hanzo Protocol: Dual-Direction Entry Intel
➕ Zone Activated: Strategic liquidity layer detected — mapped through refined supply/demand mechanics. Volatility now rising. This isn’t noise — this is bait for the untrained. We're not them.
🩸 Momentum Signature Detected:
Displacement candle confirms directional intent — AI pattern scan active.
— If upward: Bullish momentum burst.
— If downward: Aggressive bearish rejection.
🦸♂️ Tactical Note:
The kill shot only comes after the trap is exposed and volume betrays their position.

QQQ - NASDAQ Has Never Been This ExpensiveQQQ relative to the money supply reveals that markets have never been this expensive in history. Despite the significant amount of money pumped in during the COVID-19 pandemic, the economy has not kept pace with all the zeros added to Gov debt.
If we can't lower deficits now at max employment, when will we?
Tulips!
Caution is in order despite what "experts" may tell you.
Click like Follow Subscribe, let's get to 5,000 followers.

NASDAQ 100 Bullish Breakout Potential: What to Watch NextI'm currently monitoring the NASDAQ 100 (NAS100) very closely. Building on yesterday’s outlook, we've now seen a clear bullish structural shift — price is holding firm above a recent higher high and higher low, suggesting the early stages of a potential trend continuation 📈
Zooming into the 30-minute chart, we can track price action more precisely. I’m watching for a decisive break above the current range high on this timeframe. If we get the break → retest → rejection pattern, this would confirm bullish momentum and provide a long opportunity 🚀
Should this scenario play out, we could also see JPY pairs strengthen to the upside, as a risk-on sentiment flows through the markets 🧭
🔍 This setup is developing — as always, patience and precision are key.

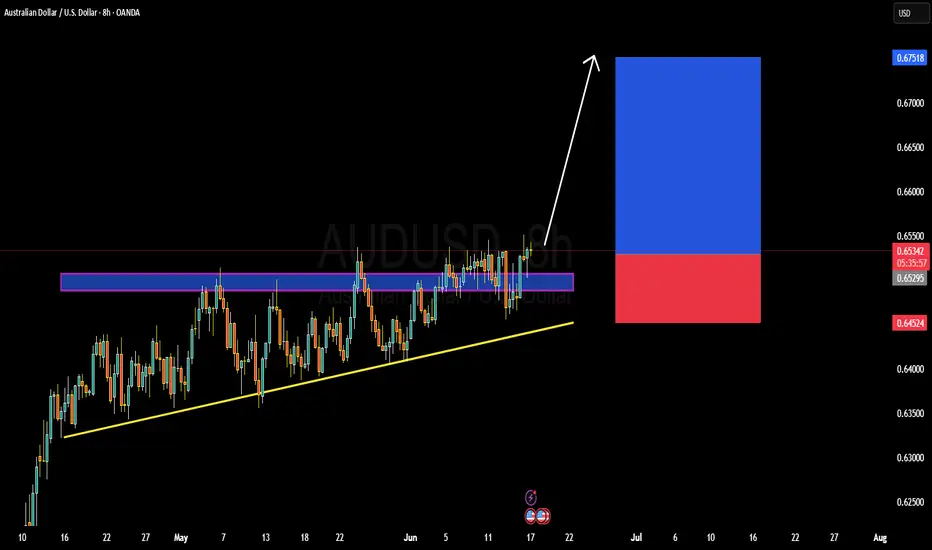
AUDUSD TECHNICALS AND FUNDAMENTALS DETAILED ANALYSISAUDUSD has officially broken out of a multi-week ascending triangle structure, and momentum is now building for a bullish continuation. The price is currently trading around 0.6533 after a strong breakout above the 0.6520 resistance zone. This consolidation was forming higher lows, signaling accumulation and bullish intent. The clean breakout above the horizontal resistance confirms buyers are in control. With this pattern validated, my short-term target is 0.6700–0.6750, aligning with the measured move projection.
From a macro perspective, AUD is gaining strength due to a divergence in monetary policy outlooks. The Reserve Bank of Australia remains hawkish, supported by sticky inflation data and a tight labor market, while the Federal Reserve has recently hinted at a dovish turn, acknowledging signs of economic slowdown. Additionally, a weaker U.S. dollar index (DXY) and rising commodity prices—especially iron ore and copper—are tailwinds for the Australian dollar. These fundamental shifts are reinforcing the bullish technical breakout.
On the 8H chart, the ascending triangle is a clear signal of bullish pressure. The zone around 0.6450–0.6520 acted as strong demand during the consolidation phase. A successful breakout retest of this zone could offer secondary entry opportunities. The risk-reward ratio is attractive, with a defined invalidation below the trendline and a target extending toward yearly highs near 0.6750.
This setup stands out as high-probability. With bullish price action, supportive fundamentals, and risk-on sentiment returning across FX majors, AUDUSD is primed for further upside. I’m holding long with conviction, expecting continuation toward the projected breakout target. This trade aligns with current market structure, trend strength, and macro drivers—perfect timing in a trending market environment.
An update on my NAS100 trade idea I shared over the weekend.I analyzed over the weekend and ended up breaking down a weak high, my mistake was not considering some of the information the chart was communicating at that time.
I ended up not getting any entry opportunity on the POI I was targeting. As I was waiting, I noticed I was looking for entry on the push of a weak high which was now acting as an inducement then reevaluated my analysis and noticed price was going to look for liquidity above that weak high.

USTECH Long Opportunity USTECH is currently on a break out to the upside, resuming the bullish trend. Price broke out above $21820 and is currently on a retracement where it could potentially provide a break and retest level at $21820.
Price is trading above the 50 SMA and is currently showing bullish momentum coming out of the RSI.
There is bullish structure amidst the consolidation present thus its important to trade cautious. Looking to the ride the bullish wave from the $21820 to the resistance at $22050.

Hanzo / Nas100 30 Min ( Accurate Tactical Break Out Zones )🔥 Nas100 – 30 Min Scalping Analysis (Bearish Setup)
⚡️ Objective: Precision Breakout Execution
Time Frame: 30-Minute Warfare
Entry Mode: Only after verified breakout — no emotion, no gamble.
👌Bullish After Break : 21810
Price must break liquidity with high volume to confirm the move.
👌Bearish After Break : 21640
Price must break liquidity with high volume to confirm the move.
☄️ Hanzo Protocol: Dual-Direction Entry Intel
➕ Zone Activated: Strategic liquidity layer detected — mapped through refined supply/demand mechanics. Volatility now rising. This isn’t noise — this is bait for the untrained. We're not them.
🩸 Momentum Signature Detected:
Displacement candle confirms directional intent — AI pattern scan active.
— If upward: Bullish momentum burst.
— If downward: Aggressive bearish rejection.
🦸♂️ Tactical Note:
The kill shot only comes after the trap is exposed and volume betrays their position.

NZDJPY TECHNICALS AND FUNDAMENTALS DETAILED ANALYSISNZDJPY is currently trading around the 87.00 handle and has just bounced strongly from a well-respected support zone. The pair is now showing clear signs of recovery after a brief corrective dip, and price action on the 8H chart confirms a bullish reversal structure. The support held firmly, and we’ve already seen a solid rejection wick forming the foundation of this new impulsive leg up. With this momentum in play, I’m targeting the 90.00 zone in the coming sessions.
On the macro front, the New Zealand dollar is benefiting from a relatively hawkish RBNZ stance. Inflation pressures remain sticky in New Zealand, and the central bank has reiterated its cautious approach toward rate cuts. Meanwhile, the Japanese yen remains under persistent selling pressure due to the Bank of Japan's ultra-loose policy and intervention uncertainty. These diverging central bank outlooks are fueling continued upside in NZDJPY as carry trade flows remain in favor of the kiwi.
From a technical perspective, the market structure remains bullish. After retesting a previous higher low, price is climbing within a clean channel and has broken minor resistance levels convincingly. This aligns well with a swing continuation pattern toward the 90.00 mark. Momentum is supported by increasing bullish volume, and as long as we remain above 86.00, the bulls are firmly in control.
In my analysis, this is a textbook setup. We’re seeing higher lows, strong trend continuation, and a macro-backed directional bias. I’m long from 87.00 with a bullish outlook into 90.00. I’ll reassess price action as we approach major resistance levels, but until then, I remain confidently positioned with a clear technical and fundamental confluence.

NASDAQ Analysis: Navigating Uncertainty in a Shifting LandscapeThe NASDAQ has been on a rollercoaster ride lately 🎢, reflecting both global macro shifts and sector-specific dynamics. After dipping into bear market territory earlier in the year, the index has rebounded strongly, powered by mega-cap tech and the ongoing AI boom 🤖. However, the mood remains cautious as investors weigh political and economic cross-currents. Note how price action is stalling at the current level.
Fundamentals & Earnings 💼
Earnings Resilience: Q1 2025 earnings for NASDAQ heavyweights were robust, with tech giants posting double-digit growth. Yet, forward guidance is more muted, as companies brace for the impact of higher tariffs and global supply chain adjustments.
Valuations: The recent rally has pushed forward P/E ratios well above long-term averages, making the market more sensitive to any negative surprises 📈.
AI & Innovation: Capital expenditure on AI is set to exceed$300 billion this year, keeping the sector in the spotlight and fueling optimism for long-term growth.
Political & Geopolitical Factors 🌍
Trade Policy: The U.S. and China have agreed to a temporary pause on new tariffs, easing some immediate concerns. However, the average effective tariff rate remains much higher than last year, and uncertainty lingers as legal challenges and further negotiations loom.
Fiscal Policy: U.S. deficit worries are back in focus, with new legislation projected to add trillions to the national debt over the next decade. This has contributed to higher Treasury yields and a weaker dollar 💵.
Global Competition: International equities have outperformed U.S. stocks over the past six months, but history suggests this may be stretched, and a reversal could be on the horizon.
Market Sentiment & Technicals 📊
Volatility: While volatility has eased from its spring highs, sentiment remains fragile. Consumer and business confidence indices are at multi-year lows, even as hard economic data (like jobless claims) remains resilient.
Sector Rotation: Growth and cyclical sectors—especially tech, consumer discretionary, and industrials—have led the rebound, but investors are increasingly selective, favoring companies with strong fundamentals and global reach.
Outlook: The NASDAQ is cautiously optimistic for the second half of 2025. The market is pricing in a couple of Fed rate cuts by year-end, but the path forward depends on inflation trends, trade clarity, and corporate earnings.
Key Takeaways 🚦
The NASDAQ is in recovery mode, but faces headwinds from trade policy, fiscal uncertainty, and stretched valuations.
Political developments—especially around tariffs and fiscal policy—will be key drivers of volatility.
Long-term, the AI and tech innovation wave remains a powerful tailwind, but near-term caution is warranted.
Disclaimer:
This analysis is for informational purposes only and does not constitute investment advice. Markets are volatile and subject to rapid change. Always do your own research and consult a financial advisor before making investment decisions.

NAS100 - Stock market awaits an important week!The index is above the EMA200 and EMA50 on the 4-hour timeframe and is trading in the specified pattern. If it does not rise again above the broken trend line, I expect a correction.
If the index returns above the broken trend line, we can expect a new ATH to be recorded on the Nasdaq. It is better to wait for confirmation on the breakout in order to control further risk.
Last week, U.S. stock markets—particularly the Nasdaq index—experienced significant volatility, driven by a combination of economic and geopolitical factors:
• A reduction in trade tensions due to ongoing U.S.-China negotiations
• The release of inflation indicators
• Heightened geopolitical tensions
According to Politico, as G7 leaders meet in Canada, the escalating conflict between Israel and Iran will top the agenda. Politico reported that leaders of the free world have gathered in the Rocky Mountains to discuss the very real threat of a full-scale war in the Middle East. The initial sessions of the G7 summit will take place in Kananaskis, where the worsening Israel-Iran conflict will be the primary focus. Donald Trump, who in recent days has fueled tensions through social media, is now expected to join discussions aimed at de-escalation.
On the economic front, lower-than-expected inflation in May could encourage the Federal Reserve to cut interest rates sooner than markets had previously anticipated. On Wednesday, the Bureau of Labor Statistics reported that inflation rose 2.4% in May compared to a year earlier. Housing costs were identified as the primary driver of this inflation, while price increases in categories most affected by high tariffs were not as pronounced as economists had expected. So far this year, the Fed has refrained from cutting its benchmark interest rate, citing concerns that tariffs might push consumer prices higher. While the likelihood of a rate cut at this week’s meeting remains low, the latest report could ease some of these worries and accelerate the timeline for potential cuts.
Meanwhile, Bloomberg reported that a growing group of President Trump’s advisers is urging him to consider Besant for the Fed chair position. Jerome Powell’s current term extends until May 2026, and he was originally nominated by Trump in November 2017. Other names reportedly under consideration include Kevin Warsh (considered a favored candidate), Kevin Hassett (head of the White House National Economic Council), Christopher Waller (a current Fed board member), and David Malpass (former World Bank president).
After a week dominated by U.S. inflation data, investor attention in the coming days will shift toward central bank decisions and potential signals regarding the future path of interest rates. The trading week kicks off Monday with the Empire State Manufacturing Index, offering an initial snapshot of the industrial sector in New York. Later that day, the Bank of Japan will announce its first interest rate decision, an event that could shape Asian market trends and the yen’s valuation.
On Tuesday, May’s U.S. retail sales data will be released—a key indicator of consumer strength. Signs of weakness in this report could bolster expectations for rate cuts. Wednesday will be the focal point of the week, as the Federal Reserve announces its policy decision. While markets have already priced in a pause in tightening, investors will scrutinize Jerome Powell’s remarks for clues on the likelihood of rate cuts in the months ahead. Additionally, data on May housing starts and weekly jobless claims will also be released that day.
On Thursday, with U.S. markets closed for Juneteenth, attention will turn to monetary policy decisions from the Swiss National Bank and the Bank of England. Changes in tone or interest rates from these key European central banks could influence currency market volatility. Finally, the week will conclude Friday with the release of the Philadelphia Fed Manufacturing Index—a leading indicator closely watched by traders for insights into the health of the manufacturing sector in the U.S. East.

Nasdaq-100 H1 | Approaching a pullback resistanceThe Nasdaq-100 (NAS100) is rising towards a pullback resistance and could potentially reverse off this level to drop lower.
Sell entry is at 21,719.73 which is a pullback resistance.
Stop loss is at 21,870.00 which is a level that sits above the 78.6% Fibonacci retracement and a swing-high resistance.
Take profit is at 21,477.88 which is a multi-swing-low support.
High Risk Investment Warning
Trading Forex/CFDs on margin carries a high level of risk and may not be suitable for all investors. Leverage can work against you.
Stratos Markets Limited (tradu.com ):
CFDs are complex instruments and come with a high risk of losing money rapidly due to leverage. 63% of retail investor accounts lose money when trading CFDs with this provider. You should consider whether you understand how CFDs work and whether you can afford to take the high risk of losing your money.
Stratos Europe Ltd (tradu.com ):
CFDs are complex instruments and come with a high risk of losing money rapidly due to leverage. 63% of retail investor accounts lose money when trading CFDs with this provider. You should consider whether you understand how CFDs work and whether you can afford to take the high risk of losing your money.
Stratos Global LLC (tradu.com ):
Losses can exceed deposits.
Please be advised that the information presented on TradingView is provided to Tradu (‘Company’, ‘we’) by a third-party provider (‘TFA Global Pte Ltd’). Please be reminded that you are solely responsible for the trading decisions on your account. There is a very high degree of risk involved in trading. Any information and/or content is intended entirely for research, educational and informational purposes only and does not constitute investment or consultation advice or investment strategy. The information is not tailored to the investment needs of any specific person and therefore does not involve a consideration of any of the investment objectives, financial situation or needs of any viewer that may receive it. Kindly also note that past performance is not a reliable indicator of future results. Actual results may differ materially from those anticipated in forward-looking or past performance statements. We assume no liability as to the accuracy or completeness of any of the information and/or content provided herein and the Company cannot be held responsible for any omission, mistake nor for any loss or damage including without limitation to any loss of profit which may arise from reliance on any information supplied by TFA Global Pte Ltd.
The speaker(s) is neither an employee, agent nor representative of Tradu and is therefore acting independently. The opinions given are their own, constitute general market commentary, and do not constitute the opinion or advice of Tradu or any form of personal or investment advice. Tradu neither endorses nor guarantees offerings of third-party speakers, nor is Tradu responsible for the content, veracity or opinions of third-party speakers, presenters or participants.

My trade idea on NASDAQ 100 For the coming week I'm seeing NAS100 dropping lower to pull/draw on liquidity below there heading to where we have what looks like a strong POI...
Drop your comment below if you're seeing something totally different from what I'm seeing here and lets have a discussion about our views.
