NAS100
simple trading - follow the trend
A very bullish market always needs a pullback. What a great Head and Shoulders pattern for a reversal to the downside. NAS100 has officially broken below all bullish trend lines on the Daily. NAS100 is looking to create more sell pressure. With NAS100 being at the top of its weekly trend, look for a correction. Massive sell if NAS100 cannot remain above the 4hr support zone.
BULLS :
Buy at 17588 4hr support,
If candles remain above this area and create bullish momentum, look for a target at 17661. A new higher lower should be a confirmation for continuation to the upside.
BEARS :
Wait for a retest to 17661 with bearish candles, Do NOT sell now but wait for a retest
*Previous sell opportunity:
17730
17665
This week's trading:
Look for NAS100 to consolidate and respect market support and resistance areas. Once the market has made a decision, then we trade!
Nas100analysis

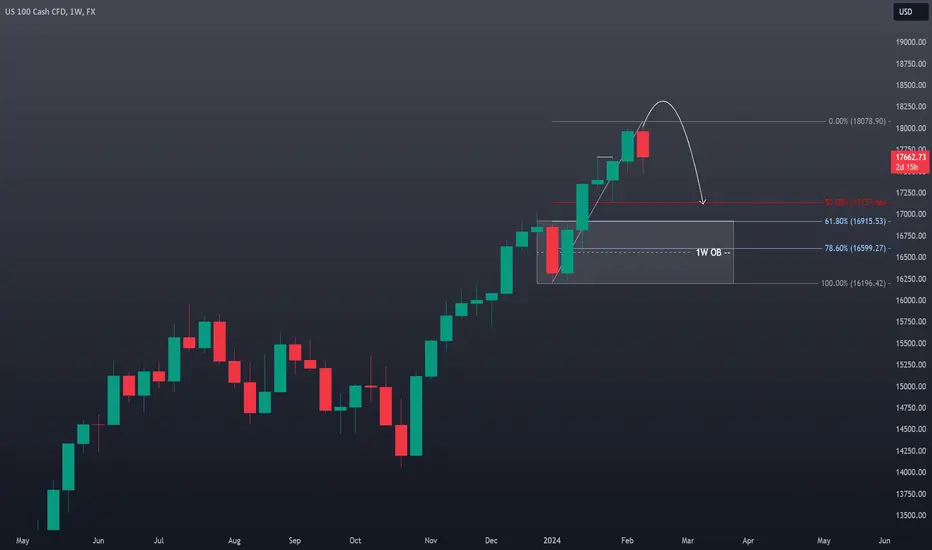
NAS100 Technical Analysis and Trade Idea - Full ExplanationMarket Observations: The #NAS100 has maintained a bullish trajectory. However, price action on the monthly timeframe suggest the #US100 is overextended. Additionally, the weekly chart reveals a double top pattern, hinting at a potential retracement down to the 50-61.8% Fibonacci levels. This area could provide the liquidity needed for major market players to fill long orders.
Trade Strategy: Consider an intraday/swing trade short entry following a potential stop run above the current range. Target an initial profit level around the previous lows near 17250, with a secondary target at 17000 (slightly above the 61.8% Fibonacci level on a 1W chart). Implement a well-placed stop-loss order to manage risk effectively.
Disclaimer: This analysis is based on my observations and does not constitute financial advice. Conduct your own independent research and carefully assess your risk tolerance before making investment decisions.

NAS100 Technical Analysis and Trade Idea
Market Observations: The #NAS100 has maintained a bullish trajectory. However, price action on the monthly timeframe suggest the #US100 is overextended. Additionally, the weekly chart reveals a double top pattern, hinting at a potential retracement down to the 50-61.8% Fibonacci levels. This area could provide the liquidity needed for major market players to fill long orders.
Trade Strategy: Consider an intraday/swing trade short entry following a potential stop run above the current range. Target an initial profit level around the previous lows near 17250, with a secondary target at 17000 (slightly above the 61.8% Fibonacci level on a 1W chart). Implement a well-placed stop-loss order to manage risk effectively.
Disclaimer: This analysis is based on my observations and does not constitute financial advice. Conduct your own independent research and carefully assess your risk tolerance before making investment decisions.
NAS100 Technical AnalysisThe #NAS100 has been on an upward trend, but a potential triple top pattern is forming on the chart. If the #DXY retraces further and rebounds from support, the #US100 could spike above the current high, potentially taking out buy-side stop-loss orders before pulling back down to the 61.8% Fibonacci level. Remember, trading the #NASDAQ involves significant risk. This analysis is just my opinion and shouldn't be considered financial advice.

NAS100 - MONDAY'S SMALL SHORT FOR BIG LONG! (TARGET 17265)As you might have noticed, the Nasdaq is on fire and I'm more of a reversal trader so times are harder. But, there is an old saying that states: "the trend is your ". I forgot the rest but I'll let you figure out the last word. So in homage of this old saying, we'll tighten our bullish running shoes and propose a setup that satisfies both camps. Here's what I see happening on Monday (29/01/2024):
What is on the chart? (follow the steps)
1) We have our liquidity target level which gave place to the continuation of the rally. So far so good for bulls, price is going up and their net worths too.
2) Our first reversal structure, with a low taken out and the high intact.
3) This is our retracement signal, confirming the market structure shift to the downside. This is paired with the fact that price broke the hourly Tenkan and Kijun + the Tenkan and the Kijun crossed over + breaking the Kumo + breaking the latest low. Additionally, the 4H Kijun and Tenkan reside within the 1H Kumo so those too were broken (not shown on the chart to promote clarity). These are reliable reversal signals. I am not trying to be a contrarian against the general trend but, this is how we spot general highs and lows. The daily is simply bullish so it's harder to spot a minor intraday opportunity such as this one.
4) This rejection confirms our reversal idea, and strengthens the probability of sellside liquidity getting taken out.
5) This is our final target, ideally the 1 Hour FVG. Again, on Monday anything can happen of course but this seems the most likely. I want these lows taken out before anything and, therefore we can short in anticipation of these lows getting taken out!
Most importantly, take some rest and have a great weekend! ;)

Nasdaq Intraday Review – Monday 29 Jan 2024I trade Nasdaq intraday exclusively
Trading in GMT time zone
Sharing my post day review & analysis in case it can help you :)
Did my analysis at +- 5:20am.
My feeling about today’s price action was that price would just consolidate as we all wait for this action packed week to kick off.
No amount of technical analysis will help – bears or bulls will step in depending on the earnings + guidance provided this week and FOMC.
My ideal plan would be to get a buy in as low as possible and then hopefully market would start pushing up in anticipation for the earnings on Tuesday. Then I would just hold as I expect earnings + guidance to be good and a further rally to ensue.
At time of analysis I noted the following:
Formation of a consolidation triangle (marked with turquoise lines)
Double top had formed on 1H TF (marked at yellow dot with purple lines), reached profit target (at B.) and now coming back to test neckline
Bears stepped in previously at A. (as seen by the red candles at A. on the 1H TF) but support of pivot point and 30min + 4H EMA was holding strong.
Turquoise uptrend line confirmed with 3rd touch and close above at B. therefore validating this uptrend line.
Green doji candle close on 1H TF at C.
I entered a buy at D. – confirmations:
S&R – price respecting 30min EMA well (when market is very bullish then this EMA is respected). When price started closing above the 1H EMA and 4H EMA, I knew that these EMA’s would not act as resistance.
Candlesticks – 1H green doji right on pivot point
Fib – none
Trendline – Turquoise uptrend line respected
It was an aggressive entry as 1H neckline still had not been broken through, but I felt that if market was going to drop from the neckline, then it would have done so at A. already.
Due to aggressive nature of this entry, I entered only 20% of my usual position size.
Mental stop was placed at thick pink line.
Market moved up, I secured at entry but bulls could not break through the 4H neckline at E. on this attempt.
Unfortunately, market came back down to take me out at entry.
I decided to stay out as market was choppy.
Unfortunately, price eventually took off without me. So I missed out on the move that I was anticipating and hoping for.
But Nasdaq is never short of entry opportunities, and I live to trade another day.
Hope you caught the buy!
What could I have done differently:
I should have set a buy limit at B. the night before, because price had not travelled the full distance as the height of the market pattern at the yellow dot.
This would have been such a great level to enter and hold for earnings!
Next time ;)
TF = timeframe
TP = take profit
1H = 1 hour
4H = 4 hour
D = day
W = week
M = month
S&R = support and resistance
EMA = exponential moving average

NAS100 | The continued rip and runNAS100 has been on a beautiful tear to the upside. The question is can it still continue?
If so, the best price to continue buying above is 17,300.80.
Why this price?
This is where the buyers push price back up before continuing the increase of price up to 17,687.20.
Price has now pulled back to provide a discount in price once again.
For this discount to remain valid buying above 17,300.80 is sensible.
What needs to be seen?
The evidence buyers can come show themselves, basically, price action candlesticks.
We can see price pushed off of structure(green line) before increasing. Now price is back at structure.
Again, we will need to see if the buyers can push price back up.
And again, price action is going to be the evidence or entering the trade upon open with the belief price can rise.
As Van Tharp states in his book Trading Beyond The Matrix , " we don't trade the markets we trade our beliefs."
My belief is price can rise if price doesn't strongly fall below the lower price of 17,300.80. If it does, this trade idea will be invalidated.
Should you trade this?
If you share the belief price will rise? Yes.
If you do not believe price will continue to rise? no.
Let's keep it that simple.
Like and share this trade idea ❤️
Shaquan

Nas100 HTF Analysis I expect Nas to reach 17k in the next few weeks. Nas has been pushing up relentlessly last few weeks so expecting ATLEAST a nice pullback. Once we hit 17k tho we could see all time highs again!


NAS100 - MY DAILY AND INTRADAY ANALYSES (TARGET 17300)Yes this is contrarian, markets are booming but it's quite overextended and going long at a top is the most monkey trader thing to do. I'll do a reverse analysis where I start with the intraday and follow up with the daily. So here's my take on things:
What's on the intraday chart? (Follow the steps)
1) A 4 hour bearish FVG. This will serve as my entry zone.
2) Our 'support line'. You'll notice price keeps on making lower lows.
3) Our liquidity target. This is the price magnet. We know for certain (discretionary) that price will take this out.
4) The entry point. Again, do your own research. Do not follow the analysis from some random stranger on the internet and go all in (you degenerate).
5) The intraday target. The order of things matter. If we hit this before hitting the short entry then you might wanna reverse the idea but I do not like the idea of longing in an overextended market!
What's on the daily chart? (Follow the steps)
1) The previous all time high that was violently broken.
2) Our swing extension target area. This is great to know where to take partials or close entire positions in new price territories. Of course price can always go further towards 2 or 2.618 or anything else (it's up to you where you wanna take partials).
3) The bearish candle pattern: kind-of a mix between a gravestone, a spinning top, a shooting star and whatever other label I can muster to justify my bias lol. To me this is the main driver of the bearish bias!
4) Maximum target. I do not see price going any lower and the intraday target is more sane so I don't really expect price to go that low either.
5) The continuation of the rally. People love buying. I do not see that changing anytime soon.
As always, have a lovely day and happy trading! ;)

Nasdaq Crash Loading - The Black Swan The current state of the NASDAQ indicates an extreme overbought condition, with a rally influenced by speculation surrounding six potential rate cuts in 2024. However, the risk arises from the Federal Reserve's concern about inflation. If the Fed, in response to persistent inflation, opts to raise rates, it could lead to a market decline. Conversely, a decision to cut rates may not be sufficient to buoy the stock market if the number of cuts is lower than expected.
Examining current fundamentals, the housing market has stabilized with low prices and mortgage rates. Although there is a rebound, a potential increase in housing speculation and mortgage rates could prompt a reassessment. Improved employee wages contribute to consumer confidence against inflation.
President Joe Biden's initiatives, such as pausing student loan payments in November and plans to provide homes for 500,000 Americans, may stimulate housing demand, causing prices to rise. This could prompt a review of interest rates and a tightening of monetary policies.
While I maintain a long-term bullish outlook, anticipating a correction of at least 50%, it is prudent to reevaluate macroeconomic indicators at that point to determine whether to take profits or continue holding.

NAS100 Trade IdeaThe NAS100 experienced a substantial rally towards the end of last week, displaying signs of being significantly overextended. A retracement may be in store, particularly if the Dollar Index (DXY) maintains and strengthens its position, considering the general inverse correlation between DXY and US100. It is essential to emphasize that this analysis is provided exclusively for educational purposes and should not be construed as financial advice.

Nasdaq Intraday Review – Friday 19 Jan 2024I trade Nasdaq intraday exclusively
Trading in GMT time zone
Sharing my post day review & analysis in case it can help you :)
Did my analysis at +- 5:20am.
At time of analysis I noted the following:
The early morning bulls had pushed up significantly.
This means that my bias would definitely be bullish and that I would look exclusively for a buy. Exclusively bullish because market broke the purple downtrend line and also the previous all-time high level.
I had a small runner open from yesterday’s position (runner = 10% of my original position size). I noted the weakness in the price action at C. and the 4H red doji candle close at 7am GMT, I thought market would retrace and maybe test the previous all-time high level (marked in green) before reaching to the top of the Day ascending triangle (at B.)
Unfortunately I closed my runner at C. and waited for a nice re-entry.
For my trading style, no re-entry signal was given….bulls just pushed straight up.
There was a small double bottom on the 15min TF, but I did not feel confident enough to enter a buy based on this alone.
Ideally I would have liked to keep my runner open to grab those extra 1000 pips. I closed my runner at about 2600 pips profit, which isn’t bad, but 3600 would have been better!
Weekend starts now!
Hope you caught the buy!
TF = timeframe
TP = take profit
1H = 1 hour
4H = 4 hour
D = day
W = week
M = month
S&R = support and resistance
EMA = exponential moving average

NAS100 & SPX500 - WHAT IS HAPPENING TODAY? (CONFLICTED)We are at a pivoting point in the markets, everything seems to be bullish and yet I have this bearish itch. Markets seem to be overpriced, notably the NQ. However the S&P500, has had a healthier correction and the continuation of its rally makes more sense.
Since both markets are highly correlated, it would be absurd to short the NQ while the S&P500 looks so bullish. Why do I want to short the NQ? Technically it hasn't retraced as sanely as the S&P500 but that may be the nature of both markets. The NQ being more irrational (more speculative) than the rest, especially with the AI craze.
So here's my two cents worth on the matter!
What is on the charts? (follow the steps)
1) Highs that wicked many times in the daily bearish FVG.
2) Significant high that as I'm writing this has been taken out.
3) The retail sales session that took out lows and this is also what has me question the rally. If it is supposed to be bearish info why isn't price dropping? These are the reasons why I do not trade on certain days because I do not see clearly all the time.
4) Asian session lows, a great target for shorts.
5) A retest (or break of the daily FVG). I am not a breakout trader which is why I am not focusing on the bullish outcome because I couldn't tell you how to trade it optimally.
6) The bearish structure (that may never present itself). This all depends on the S&P500, for me to accept a short I need that double confirmation. So right now I accept everything as bullish unless shown otherwise.
7) Asian session lows taken out.
8) Finally the healthier correction that I'd want for the NQ to accept a more bullish approach.
As always, happy trading everyone and have a lovely day! ;)

NASDAQ Sell OpportunityPrice provided with a head & shoulder pattern plus an AB=CD pattern. I am anticipating bearishness after a long the newly formed Lower Low

NAS100 - MY INTRADAY ANALYSIS (TARGET 16630)Here I'm trying to change things up with a smaller timeframe (15min) analysis because the daily is nice but how does one trade that? Well here you have it.
What is on the chart?
1) Yesterday's session low, aka sellside liquidity, that hasn't yet been taken out which gives us a juicy target for the day.
2) Yesterday's consolidation that gave the upper hand to bulls in the AM session but now it serves us for our bearish bias of the day.
3) Price wicking once more in the daily FVG and not taking out the high. Great news for bears.
4) Price retraced back into the reload zone (0.702 notably) and furthered its descent into bear territory.
5) Bearish 1 hour order block. Will be used partly for our entry coupled with the fibs.
6) London session lows that will also serve as a target. When there's an accumulation of targets it increases the probability of success when placing a trade aiming in that direction.
7) My ideal entry. To your own discretion, I can afford losing 1%, can you? (affording something isn't just monetary can also be psychological. Can you cope with losing your money once more because of the idea of a stranger on the internet?)
8) The outcome I'm looking for. If we're going for a bearish scenario this is what should (I want to) happen.
NOTE: Retail Sales data release 08:30 NY time. Could make it or break it.
Happy trading and have a nice day! ;)

NASDAQ100 TECHNICAL ANALYSIS INTRADAY Here I present my technical Analysis for Nas100 , with key zones where I will be more interested in taking some trades.

NAS100 - MY BEARISH SCENARIO (TARGET 16500)What are we looking at?
1) An all-time-high (ATH) to end 2023 with fireworks and champagne.
2) A sneaky daily bearish FVG that we know is relevant thanks to step 5 and 7.
3) A retracement creating a range that ends on the notorious 0.618 fib level (weekly fib).
4) The continuation of the general trend, price pulls back into the range and creates a daily bullish FVG. It is indeed plausible that price does continue and forms a new ATH but for arguments sake, I prefer the probabilities a short gives me in a premium market with more liquidity to grab on the sellside.
5) Price halts in the bearish FVG mentioned in step 2 and prior to that created a 4H bullish FVG.
6) The CPI release had price wick into the 4H FVG and back into the consolidation we go!
7) Price wicking at multiple occasions in the daily bearish FVG which is to me a primary signal for a short setup despite all the bullish price action around it. Listen, if price breaks buyside aggressively, no short will be taken. We need price to break a low and then a short structure may present itself.
8) Here we have the potential break to the downside, taking out sellside liquidity. We can also call this a break-of-structure.
9) A pullback for a potential short entry and voilà.
10) 2 targets for partials.
NFA and happy trading guys! ;)

Will Nadsaq start a deep correction?The year 2023 proved to be exceptional for PEPPERSTONE:NAS100 , witnessing a 70% increase in the index. However, the onset of 2024 brought about a correction in the index.
Notably, the rise observed in December is confined within a rising wedge, suggesting a potential reversal. The index has indeed breached the rising trend line of the wedge, and the recent rebound serves as confirmation of this break.
Also NAS100 appears to face challenges surpassing the 17k mark.
Confirmation for a new downward move would occur with a break below 16500.
In such a scenario, levels to monitor for bearish targets include 16200, 15700, and a significant 14500.

NASDAQ100 INTRADAY ANALYSISI will be looking to buy nasdaq100 at lows, where am exactly more comfortable to buy Nas100.

Nasdaq Intraday Review – Friday 12 Jan 2024I trade Nasdaq intraday exclusively
Trading in GMT time zone
Sharing my post day review & analysis in case it can help you :)
After yesterday’s volatility, I knew that today’s PPI would be important for investors.
As the day progressed a double top formed on the 1H TF and a head and shoulders formed on the 4H TF, both sharing the same neckline.
The pivot had been holding as strong support on a few occasions, but the bearish mood in the market/price action was tangible.
Usually I am looking for a buy only, but after yesterday’s CPI I decided to go with what the candles were telling me.
I took a sell at A. as price started breaking through the pivot point – Confirmations:
- Market pattern – 4H head and shoulders, as well as 1H double top had formed and neckline was broken
- Candlesticks: Bulls were failing to break through the resistance at the level indicated by the hand. Four failed attempts had been made.
- Fib: Candles were failing to move higher roughly at the 0.618 1H fib level
- Trend: There was a temporary downtrend line marked in green
- S&R: The pivot point was starting to fail as a support.
Took a small position as it was before the PPI and this news release could change market bias.
Market moved about 520 pips from my position and I secured at entry.
Ultimately price moved back up and I was out at entry.
Price reversing at B. was due to this area being one of strong confluences:
- Fib: 0.05 buy fib level (fib drawn from swing low at C. to swing high at D.)
- Price had travelled down exactly the same distance as the height of the market pattern
- S&R: The 4H 20 EMA was at this level at the time and provided dynamic support.
This is exactly why I always keep my bias the same as the overall trend because the biggest moves of the day come in the direction of the trend. The sell I took was 520 pips. The buy that came from B. was 1700 pips. Take profit from this buy would have been easy as it hit TP1, so I would have closed a portion of my position and left the rest running.
Its frustrating because if I had kept my bias as a buy I definitely would have taken the buy at B. because I like being part of the retest of the neckline that is in the same direction of the overall trend (still bullish, even after yesterday's CPI).
But it was a weird day today for me after CPI, market was choppy - so I guess not too bad if I come out with nothing and live to trade another day.
Have a great weekend!
What could I have done differently:
Kept my bias as a buy.
TF = timeframe
TP = take profit
1H = 1 hour
4H = 4 hour
D = day
W = week
M = month
S&R = support and resistance
EMA = exponential moving average

Nas100 Short SetupExpecting H4 to change to bearish after taking the previous day’s low so anticipating the H4 making a LH here and dropping. Possibly seeing a move down during Asian session, although this is rare. Risking .5% of my account and targeting 3R.

Nasdaq Intraday Review – Wednesday 10 Jan 2024I trade Nasdaq intraday exclusively
Trading in GMT time zone
Sharing my post day review & analysis in case it can help you :)
Did my analysis around 5:20am GMT.
At time of analysis, the following was noted:
Buy fib was drawn early this morning from swing low at A to swing high at B1…and then later in the day to swing high at B2. Retracement levels written in purple for B2 fib.
Fib levels were relatively close together with less than 600 pips separating the 0.383 and 0.618 levels. This means that one can usually go in with your full lot size because the potential draw down can be handled.
Market was consolidating into a descending triangle market pattern on both the 1H TF and the 4H TF (with double tops inside). This market pattern usually breaks down.
Bears indeed managed to break the neckline of the double top (shown with orange lines) and market moved down the same distance as the height of the pattern. Here, price found dynamic support from 1H 20 EMA and moved back up to test neckline of the 1H / 4H double top.
I usually like to be part of the restest of the neckline which is in the same direction as the overall trend (bullish in this case). This morning however, I was expecting market to move down further but when I saw the reaction to the 1H EMA, I entered.
I entered half my usual position size as a buy at C. (half because I was really expecting market to move down at least to pivot point).
Confirmations:
- Market Pattern: Bears had broken the neckline of the double top formed on the 1H & 4H TF. Price had travelled the profit target distance and was about to test the neckline of the market pattern in the same direction as the overall trend. Price was moving up and had closed above the neckline at C. on the 15min TF. Price had also broken back into the descending triangle indicating that the break out down was a fake out.
- Fib: None – this is the reason I entered only half a position because the 0.382 retracement level was at the pivot point this morning so this little market pattern break out was a very shallow retracement.
- Candle sticks & trend: The candle at C. on the 15min TF closed green forming a higher high after a series of lower highs indicating that the temporary down trend was possibly over (fully confirmed by the next green 15min candle which closed above the temporary orange down trend line).
- S&R: 1H 20 EMA providing dynamic support
Mental stop was placed at think pink line, because if price did not retrace by the 0.618 fib level and closed below the previous D neckline then a sell would ensue. I would have entered another half position of price moved down.
Market moved up 750 pips from my position and I secured at entry.
I knew a real fight between bears and bulls would take place at the purple down trend line. This line is draw on the wicks of the D candles from the D Double top.
The move I wanted to secure today was the bulls breaking this trend line. So I didn’t take profit at peak B2.
Price came down and took me out at entry.
After judging price action just before & during market open I re-entered at D.
I am now secured at entry and holding in case bulls break through the purple trend line.
So I will be out at entry with nothing or if the bulls break through, I suspect there will be a big move up and KA-CHING!!
Fingers crossed! Hope you had a good trading day too!
What could I have done differently:
So I was trying to adjust my stop loss of my C. position and all of a sudden my trade closed and also my swing trade from Sunday evening.
My C. trade was close to entry anyway so I wasn’t too worried about that.
But my swing trade closing by accident caused serious PANIC IN THE DISCO!!!!!
I usually set my profit to show as pips in MT5 (it’s a strategy to help me deal with greed and fear). So the whole time I was seeing my swing trade profit in pips.
When it suddenly closed, I saw the massive monetary profit in my equity and it totally threw me off! I was like “should I just keep the profit?? It’s so much money!”….”Maybe this happened for a reason”….”This wasn’t my plan at all but maybe now that I have the money banked I should just keep it”.
Eventually, after I calmed down, I re-entered my "swing trade". So now my swing trade will be two trades that I will combine in my trading journal and view ultimately as one trade. It was never my plan to close that swing trade at that moment. I decided to stick to my plan and even if market draws down and I ultimately make a smaller profit from this swing trade, it’s more important that I stick to my plan and close my trades when I want to close them based on price action.
So take a moment to think about what you will do if a trade closes by accident….having thought it through before the time will assist you in those critical moments when it happens to you.
TF = timeframe
TP = take profit
1H = 1 hour
4H = 4 hour
D = day
W = week
M = month
S&R = support and resistance
EMA = exponential moving average
