NAS100 Trade Idea: Liquidity Sweep & Bullish Reversal Potential📊 NASDAQ 100 (NAS100) Trade Outlook 📈
The NASDAQ 100 is holding a strong bullish trend on the higher timeframes 🟢. However, we’re currently seeing a notable pullback into a key support zone ⚠️ — price has dipped beneath previous lows, tapping into what appears to be an institutional accumulation range 🏦.
This move is likely targeting the liquidity resting below those lows 💧, where sell stops are positioned. Price is also reacting off a significant bullish order block 🧱 — a confluence area that could produce a strong reversal.
🎯 What to look for next:
Wait for a bullish break in market structure 🔁 to confirm a potential entry. If that occurs, consider a long setup with your stop loss below the swing low 🛑 and a 1:2 risk-to-reward target 🎯.
🚫 This is for educational purposes only and not financial advice.
Nas100signal

Fibonacci Retrace Strategy NAS100 Trade Idea📈 NASDAQ 100 (NAS100) is holding a strong bullish trend 🚀. After a weekend gap-up 🕳️➡️📈, price retraced back into the gap zone—exactly what you'd expect in a healthy trending market.
🔍 I'm applying my Fibonacci Expansion + Retrace Strategy 🔢, watching closely for a pullback into equilibrium ⚖️ within the previous price swing. That’s where I’ll be waiting for a bullish market structure break 🔓📊 to confirm my long bias.
🧠 Patience is key here—let the setup come to you.
📌 As always, this is not financial advice!

Top in Place? NASDAQ100 Signals Exhaustion After Incredible Run📈 The crazy run since April
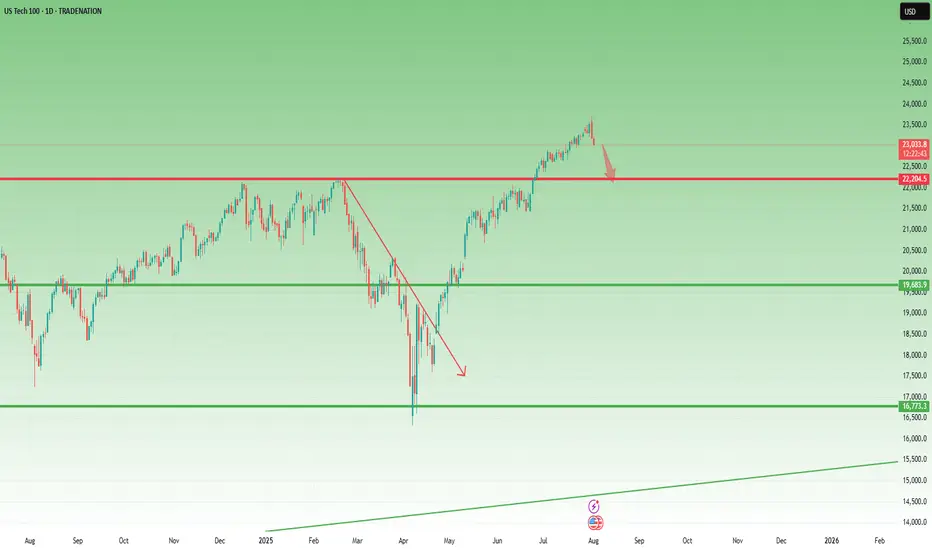
NASDAQ100 has had a spectacular run since early April, when the index dipped to 16,300 amid rising tensions caused by Trump’s tax war. From that low, we’ve seen a mind-blowing rally of over 7,000 points, which translates to a 40% gain in just 4 months.
Such a rise is not just impressive— it’s overextended , especially by historical standards. Markets don’t move in straight lines forever, and this one might be showing signs of fatigue.
🕯️ Bearish signal at the top
Fast forward to this week: yesterday, the index marked a new all-time high at 23,700, but closed the day with a strong bearish engulfing candle — one that wipes out the gains of the previous 4 trading sessions.
This is not a small technical detail. Such candles, when appearing after an extended rally, often signal exhaustion and a potential shift in momentum.
❗ Top in place?
In my opinion, there's a high probability that a top has been set, at least temporarily. We might be looking at the beginning of a healthy correction, or even something more meaningful, depending on follow-through in the next sessions.
📉 Where to next?
The first major support to watch is the 22,200 level.
I expect that zone to be tested soon — and honestly, considering how much the index has gone up, this shouldn’t surprise anyone. It’s nothing more than a minor pullback, all things considered.
🧠 Stay smart!
When markets go vertical, it pays to stay disciplined and realistic. Tops rarely announce themselves, but when signals like this appear, it’s wise to listen.
Disclosure: I am part of TradeNation's Influencer program and receive a monthly fee for using their TradingView charts in my analyses and educational articles.
NAS100 Bullish Setup: Clean Structure & Entry Zone Pending📊 NASDAQ 100 (NAS100) remains bullish, showing a clean, well-structured uptrend—higher highs and higher lows 🔼📈.
Price has now pulled back into my optimal entry zone 🎯. At this stage, I’m waiting for a bullish break in market structure before considering an entry 🟢🔓.
Patience is key—let the structure confirm first.
Not financial advice ❌💼

NASDAQ 100: AI Momentum and Resilient Earnings Drive New HighsThe NASDAQ 100 continues its strong uptrend 📈, recently breaking to new highs after a period of consolidation. The rally is broad-based but remains led by heavyweight tech names and AI-related stocks 🤖.
Key Fundamental Drivers:
AI & Tech Growth 🤖💡: The biggest catalyst is the ongoing boom in artificial intelligence and digital transformation. Companies in the index, especially the “Magnificent Seven” (like NVIDIA, Microsoft, Apple), are seeing robust earnings growth and strong investor demand for AI exposure. Global IT spending is projected to grow by over 9% in 2025, with AI spending up nearly 30% year-on-year.
Earnings Resilience 💪💰: Despite high interest rates and inflation, tech companies have adapted well, maintaining strong margins and growth. The sector is expected to remain a top performer through 2025.
Fed Policy & Rate Expectations 🏦🔮: Markets are increasingly pricing in a pause or even cuts in US interest rates later in 2025, which is bullish for growth stocks and tech-heavy indices like the NASDAQ 100.
Geopolitical & Macro Factors:
Reduced Uncertainty 🌏🕊️: The market has absorbed major geopolitical shocks (such as the Israel-Iran conflict and US-China trade tensions), and the resolution or de-escalation of these risks has reduced uncertainty, supporting risk assets.
US Election & Policy 🇺🇸🗳️: The outcome of the US election and expectations for stable or pro-business policies have also contributed to positive sentiment.
Global Supply Chains & Resilience 🌐🔗: While some risks remain (e.g., cyber threats, regulatory changes, and supply chain disruptions), the tech sector’s global reach and adaptability have helped it weather these challenges.
Why is it rallying now?
AI optimism and strong tech earnings are the main drivers 🤖💹.
Expectations of easier Fed policy and a resilient US economy are fueling risk appetite 🏦📈.
Geopolitical risks have eased or are being priced in, allowing investors to focus on growth 🌍🕊️.
Summary:
The NASDAQ 100’s rally is powered by AI-driven tech growth 🤖, resilient earnings 💪, and easing macro/geopolitical risks 🌏. The index remains a global leader as investors bet on the next wave of technology and digital innovation 🚀.

NAS100 Nasdaq Range-Bound: What Traders Should Watch Next US100I'm currently keeping a close eye on the Nasdaq 🧠📊, which is trading within a range-bound structure 📉📈. While we’re seeing some bullish momentum on the NAS100 4-hour chart today ⏱️📈, it’s nothing particularly strong or decisive just yet. I’m waiting for a clear break 🔓 either above or below this current range before considering any trading opportunities 🎯.
In this US100 chart 🖼️, I’ve highlighted key components such as price action, market structure, the prevailing trend, and other important elements of technical analysis 🧩📐.
⚠️ Please remember: this is a market analysis and reflects my personal opinion — not a trade recommendation. Always do your own due diligence 🕵️♂️ before making any trading decisions. This is not financial advice.

NAS100 Reading Market Structure: When to Trade and When to WaitI'm currently keeping a close eye on the NASDAQ 📉. Price has remained largely range-bound over the past few sessions and continues to show signs of pressure 🔻. While we've seen a short-term rally 🚀, it lacks the conviction and momentum typically seen in stronger trending environments 📊.
When comparing the current conditions to previous trend phases, the difference is clear. Structure is unclear, and there's no confirmation of sustained direction yet. As shown on the chart 📈, we previously saw strong bullish momentum followed by a sharp shift, suggesting indecision in the market 🤔.
In these situations, patience is key ⏳. It's just as important to know when not to trade as it is to know when to act 🎯. For now, I’m choosing to stay on the sidelines until a clearer trend develops.
Not financial advice ⚠️

Smart Friday Trades: NASDAQ Setup and Key Levels to Watch NAS100📊 NASDAQ US100 Analysis – Friday Setup
I'm currently watching the NASDAQ closely 👀. The NAS100 looks significantly overextended 📈, and with it being the end of the week, we often see price action push into the weekly high before pulling back into the weekly close 🔁.
This is a pattern I’ve seen play out many times during the New York session on Fridays 🗽📉.
💡 Here’s my suggestion:
Wait for today’s data release 📅 to finish. If price ranges and then breaks market structure to the downside, keep an eye out for a short entry on the retrace and retest of the range low.
🎯 Your targets and stop loss are outlined clearly in the video, so make sure to watch it through.
⚠️ Trade sensibly, manage your risk, and don't rush into anything.
I'd love to hear your thoughts in the comments 💬
Have an awesome day and I’ll see you in the next one! 🚀

Market Structure Breakdown on NASDAQ: What Traders Should Watch📉 NASDAQ (NAS100, US100) Analysis 🧠💼
I’m currently keeping a close eye on the NASDAQ (NAS100) — price action is telling a story worth watching.
📆 Last week, the index came under clear pressure, and now on the 4H timeframe, we’re seeing a defined bearish structure with consistent lower highs and lower lows 📉🔻. This recent expansion to the downside has led to a break in market structure (BOS), and price is now pulling back into equilibrium 🔄.
⏳ For now, it’s a waiting game. I’m watching to see if this pullback finds resistance at a premium level and rotates back to the downside, which would present a potential short setup 🎯📊.
🕒 On the 30-minute chart, I’m monitoring for a clear structural shift — a change in momentum that confirms bearish intent. Should the NASDAQ resume its downward move, it could trigger risk-off sentiment, bringing strength into the JPY pairs 💴🚨 as capital flows out of risk assets.
⚠️ Disclaimer:
This analysis is for educational purposes only and should not be considered financial advice. Always conduct your own research and consult with a licensed financial advisor before making any trading decisions. 📚💼

NAS100 Bullish Breakout SetupNAS100 Bullish Breakout Setup 🚀
🧠 Chart Analysis (H4 timeframe)
🔹 Ascending Channel:
Price has been trending inside a clear ascending channel (blue zone), supported by higher highs and higher lows.
🔹 Support & Resistance:
Support: Around 21,635.32 – tested multiple times (highlighted by 🔵 arrows).
Resistance: Around 22,265.19 – recent highs and psychological barrier.
🔹 Double Bottom Formation 👣:
Near support zone, a potential double bottom (bullish reversal pattern) is visible. The neckline has been challenged.
🔹 Breakout Confirmation 🟢:
Price has broken above the descending neckline of the double bottom and is hovering near 21,644, indicating potential bullish continuation if sustained.
🔹 Target 🎯:
Projected breakout target lies at 22,265.19, aligning with the previous resistance zone.
🔹 Volume & Momentum 📊:
While not shown, a breakout above the neckline generally needs strong volume confirmation to validate the move.
📌 Conclusion:
If price sustains above the 21,635 – 21,644 area and gains momentum, the path to 22,265 looks likely ✅. However, a false breakout could drag the price back into the channel.

NAS - ACTIVE PROFITABLE SET UP TRADETeam, tonight the US rate will announce.
I will wait for my set up to entry, if NOT I will not trade tonight
Please carefully review the chart
REMEMBER if it not hit your setup , DO NOT TRADE. simple as that
today we already hit our target for NAS, DAX AND DOW.

NAS100 Technical Analysis – Bearish Rejection at ResistanceNAS100 Technical Analysis – Bearish Rejection at Resistance 🚨
📅 Date: June 6, 2025
📈 Instrument: NAS100 (US Tech 100 Index)
🔍 Chart Overview:
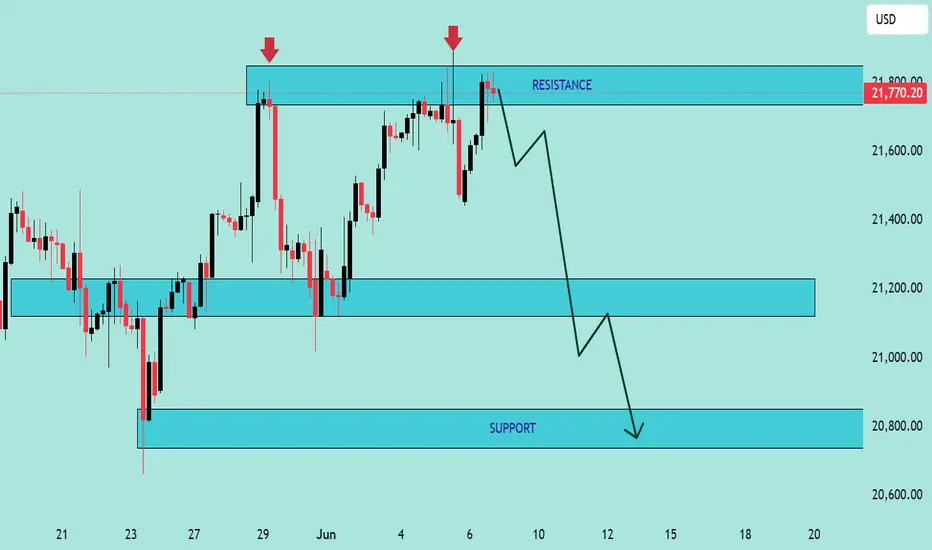
The price action shows a clear rejection from the 21,800 USD resistance zone, marked by two strong bearish wicks (indicated by red arrows 🔴). This level has proven to be a strong supply zone, as sellers repeatedly step in to push prices lower.
🔵 Key Zones:
🔺 Resistance Zone: 21,750 – 21,800 USD
✅ Multiple rejections and bearish pressure.
🔻 Support Zone 1: 21,100 – 21,200 USD
📍 Acts as a mid-range demand zone and a potential take-profit level for short positions.
📉 Support Zone 2 (Major): 20,700 – 20,850 USD
📦 High-probability bounce area due to historical demand.
🔄 Price Action Insight:
The chart outlines a bearish double rejection pattern at the resistance level.
The current candlestick setup suggests bearish momentum, with a potential drop toward the mid-support zone.
If the price breaks below the mid-support, it could cascade down toward the major support near 20,800 USD.
📌 Projected Move:
🔻 From current levels (~21,750), expect:
Pullback from resistance,
Target 1️⃣: 21,100 USD zone,
Target 2️⃣: 20,800 USD major support.
🚫 A clean break and close above 21,800 invalidates the bearish outlook and may trigger a bullish continuation.
✅ Conclusion:
The chart favors a short bias below the resistance zone. Patience is key—wait for confirmation (like a bearish engulfing or break of structure 📉) before entering positions.
📊 Always use risk management. Set stop-loss above resistance in case of reversal.
NASDAQ 100 Setup After Bearish Pullback. My Bullish Game Plan!🚀 NASDAQ US100 Update – Key Levels I'm Watching 💡📈
Looking at the NAS100 right now, we’ve seen a strong rally kick off after the weekend 📊🔥 — this comes on the back of an aggressive bearish pullback last week 📉.
📌 My bias is bullish, but with a condition: I want to see price retrace into the 10-minute fair value gap and hold above the previous low 🧠🔍.
If we get a clean pullback, followed by a continuation with higher highs and higher lows, I’ll be watching closely for the first bullish break after that next pullback — that’s where I’d look to position long 🐂📈.
🛑 Not financial advice.
👇 Drop a comment if you're watching these levels too!

NASDAQ US100 Overextended? Waiting for the Pullback🚨 NASDAQ #100# Analysis 🚨
I'm currently watching the NASDAQ (US100) 📊, and in my view, it's looking overextended. Price is now trading into previous daily highs 📈 without showing a meaningful retracement. Historically, when we look back at the chart, we rarely see such strong rallies without some form of pullback 🔄.
A healthy trend typically follows a natural rhythm — rally, retrace, rally or expand, pull back, expand again. In this case, that retracement is missing ❌, which raises caution flags for me 🚩.
🎥 In the video, I break down:
Price action & market structure 🧩
The current trend 📉📈
A potential long opportunity — but only if price pulls back into my point of interest (POI) 🧲 and we then get a bullish break in market structure (BoS) 🟢.
🔒 This is not financial advice. Always do your own research and trade responsibly!

Will NASDAQ Continue Its Climb? Here's my Trade Plan.📈 NASDAQ 100 (NAS100) Technical & Price Action Outlook 💡🚀
The NASDAQ has been in a strong bullish trend, driven by optimism around interest rates, tech earnings, and positive momentum. 📰💻 While price has pushed up aggressively, it’s now trading near key highs and buy-side liquidity zones—a spot where I’m anticipating a possible pullback. 🔁💰
I’m watching closely for a retracement into the 50% Fibonacci zone—my point of interest for a potential long setup. 🎯📐 However, I’ll only consider entering if price breaks structure bullish (BoS) after the pullback. 📊🧠
The index is still recovering from earlier 2025 losses, and resistance lies just ahead—so risk management is key. 🧘♂️⚠️
Not financial advice.

NASDAQ MEGA BOUNCE ZONEI want to see a super bounce from this demand zone tomorrow due to the recent reactions around this price level. Lots of interest being shown here. I am sized in pretty heftily on MNQ futures. In a $0 or HERO position. WIll be closing my laptop now...

NAS100 Testing Lows: Will a Bounce Offer a Sell Opportunity?NAS100 Technical & Fundamental Analysis 🧐
Overall Sentiment: The current market sentiment surrounding tech stocks and the broader indices like the NASDAQ 100 appears cautious, leaning bearish. Factors like persistent inflation concerns, uncertainty around the Federal Reserve's future interest rate path 🏦, and ongoing geopolitical tensions can weigh heavily on growth-sensitive assets like tech stocks. Keep an eye on upcoming economic data releases (CPI, PPI, FOMC minutes) as they could significantly sway sentiment.
1. Daily Timeframe (D1): The Bigger Picture 🗺️
The NAS100 is exhibiting clear bearish characteristics on the daily chart, forming lower highs and lower lows.
Price is currently approaching or testing a significant area of previous daily equal lows. This is a critical zone ⚠️. Why? Because significant buy-side liquidity often rests below such lows (in the form of stop-loss orders from long positions) and sell-side orders may trigger if these levels break decisively.
A strong break and close below these daily lows could signal a continuation of the major downtrend, potentially accelerating selling pressure. Conversely, this area could act as temporary support, prompting the pullback you're anticipating.
2. 4-Hour Timeframe (H4): The Setup Structure 🏗️
My H4 chart clearly illustrates the recent sharp decline. Price is currently testing the support zone highlighted (around 17,800 - 18,000), which corresponds to the 0.00% Fibonacci level (17,973.8) drawn from the recent swing high (~19,117.4).
This support zone aligns with the concept of hitting the daily lows/liquidity area.
Anticipated Scenario:
I am expecting a reaction (a bounce/pullback) from this current zone. The projected path suggests a retracement towards the 50% Fibonacci level (Equilibrium) at approximately 18,547.3. This level often acts as significant resistance after a strong impulse move. The 61.8% level (~18,682.6) is also a key area to watch just above it.
Point of Interest (POI):
The zone between the 50% and 61.8% Fib levels (roughly 18,550 - 18,700) is your key decision area for a potential short entry. 👍
3. 15-Minute Timeframe (M15):
Entry Confirmation Trigger 🔫
The M15 timeframe will be crucial if price reaches your H4 POI (around the 50% Fib level).
What to Look For: During the potential pullback towards ~18,550, the M15 will likely show a temporary bullish structure (higher highs and higher lows).
Confirmation Signal:
For your short setup, you'd want to see this M15 bullish structure fail upon reaching the H4 resistance zone. Look for:
A break of market structure (BOS) to the downside on M15 (price making a lower low after failing to make a higher high).
Formation of clear M15 lower highs and lower lows.
Bearish candlestick patterns (e.g., engulfing candles, pin bars/shooting stars) rejecting the H4 resistance/Fib level.
Potential divergence on indicators like RSI or MACD (though price action is primary).
Synthesized Outlook & Strategy:
The NAS100 is undeniably in a bearish phase across multiple timeframes. The current test of daily lows / H4 support (~17,973) is a critical juncture. A bounce from here seems plausible, aligning with your expectation of a pullback.
The Strategy:
Patience: Wait for price to potentially rally towards the H4 50%-61.8% Fibonacci retracement zone (~18,547 - ~18,682). 🧘♀️
Confirmation:
Monitor the M15 timeframe closely as price approaches this zone. Look for a clear shift in market structure from bullish (pullback) to bearish (resumption of trend). 📉
Entry: If bearish confirmation occurs (M15 BOS), consider a short entry.
Targets:
Initial targets could be the recent lows (~17,973), followed by the Fibonacci extension levels shown on your chart (e.g., -50% at ~17,400.4) or the area below the daily equal lows. 🎯
Risk Management: Crucially, define your stop-loss level (e.g., above the swing high formed during the M15 structure break or above the 61.8%/78.6% Fib level) to manage risk effectively. 🛡️
Fundamental Check:
cross-reference this technical setup with any major news releases or shifts in market sentiment that could invalidate the pattern. 📰

Trade the Structure: NAS100 Possible Retrace & Buy OpportunityThe NAS 100 recently broke its market structure after a twist in trade policy—with Donald Trump delaying tariffs by 90 days—which sparked a robust rally. On the 4‑hour chart, we're looking for a bullish setup where the initial surge might be followed by a pullback into a sideways accumulation zone. This consolidation is expected to form a "spring" pattern—a brief retest that could trap sellers—followed by a clear break of market structure that signals a renewed upward move. The entry is ideally on the breakout, backed by supportive volume, while risk management is maintained with a stop-loss positioned just below the range if/when price retraces into support. 🚀📈💰

Tactical US100 Trading: Converting 1W Trend into 30m Opportunity📈 The US100 index is currently exhibiting a bearish trend pattern on the weekly timeframe. We can observe a notable rally followed by a retracement into equilibrium when analyzed against the previous price wing range.
🔎 Currently, the index is positioned at a premium level, creating an environment where short sellers might be building positions in anticipation of further downward movement. However, market dynamics remain highly sensitive to external influences, particularly unexpected statements and social media announcements from influential figures like Donald Trump.
🌊 With such market unpredictability in play, focusing on shorter timeframes provides more actionable intelligence. Price action signals offer clearer guidance in this volatile environment.
⚡ Trade Opportunity: The 30-minute chart reveals a defined trading range worth monitoring. A definitive break above this range could present an opportunity to enter long positions, while a breakdown below support might signal a favorable short entry point.
🎯 This breakout strategy enables traders to respond to actual market movements rather than attempting to forecast the broader market direction—a particularly valuable approach given the current unpredictable market landscape.
⚠️ DISCLAIMER: This analysis is provided for informational purposes only and does not constitute financial advice. Trading carries significant risk of capital loss and may not be appropriate for all investors. Historical performance does not guarantee future outcomes. Always perform independent research and consider your personal financial circumstances before executing any trades. Market conditions are subject to rapid changes, and no trading methodology ensures profits. The information presented should be used as one of many inputs in your decision-making process.

"NAS100/US100" Index Market Money Heist Plan (Day / Scalping)🌟Hi! Hola! Ola! Bonjour! Hallo! Marhaba!🌟
Dear Money Makers & Robbers, 🤑💰✈️
Based on 🔥Thief Trading style technical and fundamental analysis🔥, here is our master plan to heist the "NAS100/US100" Index CFD Market. Please adhere to the strategy I've outlined in the chart, which emphasizes short entry. Our aim is the high-risk Green MA Zone. Risky level, oversold market, consolidation, trend reversal, trap at the level where traders and bullish robbers are stronger. 🏆💸"Take profit and treat yourself, traders. You deserve it!💪🏆🎉
Entry 📈 : "The heist is on! Wait for the MA breakout then make your move at (16400) - Bearish profits await!"
however I advise to Place sell stop orders above the Moving average (or) after the Support level Place sell limit orders within a 15 or 30 minute timeframe most NEAREST (or) SWING low or high level.
📌I strongly advise you to set an "alert (Alarm)" on your chart so you can see when the breakout entry occurs.
Stop Loss 🛑: "🔊 Yo, listen up! 🗣️ If you're lookin' to get in on a sell stop order, don't even think about settin' that stop loss till after the breakout 🚀. You feel me? Now, if you're smart, you'll place that stop loss where I told you to 📍, but if you're a rebel, you can put it wherever you like 🤪 - just don't say I didn't warn you ⚠️. You're playin' with fire 🔥, and it's your risk, not mine 👊."
📌Thief SL placed at the nearest/swing High or Low level Using the 4H timeframe (17300) Day/Scalping trade basis.
📌SL is based on your risk of the trade, lot size and how many multiple orders you have to take.
Target 🎯: 15300 (or) Escape Before the Target
"NAS100/US100" Index CFD Market Heist Plan (Scalping / Day Trade) is currently experiencing a Bearish trend.., driven by several key factors.👇👇👇
📰🗞️Get & Read the Fundamental, Macro, COT Report, Geopolitical and News Analysis, Sentimental Outlook, Intermarket Analysis, Index-Specific Analysis, Positioning and future trend targets... go ahead to check 👉👉👉🔗🔗
Detailed Explanation 📝
Fundamentals: Growth stalls 📉, valuations adjust—bearish shift 🐻.
Macro: Cooling economy 🌍, sticky inflation 🔥—downward pressure.
COT: Speculators flee 📉, hedgers dig in—bearish signal 🐻.
Index: Correction deepens 📉, support tests near—technical bear 🐻.
Intermarket: Yields/USD crush risk assets 💪—bearish tide.
Geopolitical: Trade wars ⚔️, regulation 🔍—negative catalysts pile up.
Sentiment: Fear takes hold 😟—bearish consensus builds.
Trends: Near/medium-term declines 📉, long-term hinges on recovery ⚖️.
Outlook: Moderately bearish 🌩️—tough sledding ahead.
⚠️Trading Alert : News Releases and Position Management 📰 🗞️ 🚫🚏
As a reminder, news releases can have a significant impact on market prices and volatility. To minimize potential losses and protect your running positions,
we recommend the following:
Avoid taking new trades during news releases
Use trailing stop-loss orders to protect your running positions and lock in profits
💖Supporting our robbery plan 💥Hit the Boost Button💥 will enable us to effortlessly make and steal money 💰💵. Boost the strength of our robbery team. Every day in this market make money with ease by using the Thief Trading Style.🏆💪🤝❤️🎉🚀
I'll see you soon with another heist plan, so stay tuned 🤑🐱👤🤗🤩

NAS100 Turn of the Month Strategy Meets Market Volatility!In this video, we dive into the Turn of the Month Strategy and explore how it could play out in the current market environment. Historically, mutual funds rebalance their portfolios at the end of the month, creating buying pressure that often leads to higher stock prices into the new month. Additionally, recurring financial inflows, such as monthly salary payments and pension contributions, tend to boost market demand during this period.
However, this month presents a unique challenge. The NASDAQ 100 has capitulated into the end of the month, driven by heightened volatility and uncertainty fueled by Donald Trump's rhetoric. With the market currently trading into a significant support zone and liquidity pool, we analyze whether the Turn of the Month effect can counteract the recent bearish momentum.
📊 Key Highlights in the Video:
Price Action Analysis: The NASDAQ 100 is deeply overextended, trading into a critical liquidity pool.
Trade Idea: A potential counter-trend rally could emerge as the market seeks to correct and rebalance.
Strategy: Look for a short-term rally into resistance, followed by a possible shorting opportunity as the market resumes its downward trend.
This video is perfect for traders looking to combine price action trading with seasonal strategies like the Turn of the Month effect. Will the market rally into the new month, or will bearish momentum prevail? Watch now to find out! 🚀

NASDAQ 100 (NAS100) Technical Outlook
NAS100 is currently in a corrective phase, trading at $18,900, with bearish momentum suggesting a potential move toward the $18,300 support level in the coming week. If this level holds, a rebound could push the index back up toward $20,300, creating a temporary recovery phase.
However, if the price struggles at $20,300 and fails to sustain bullish momentum, it would confirm the formation of a descending channel, reinforcing the broader downtrend. In this scenario, NAS100 could extend its decline toward $16,100, where the price may find support.
Key structural levels to watch:
Support Levels: $18,300 → $16,100 → $14,600 (Major support from 2021)
Resistance Levels: $20,300 → $16,000 (Resistance from 2023)
If the index reaches $16,100, this could serve as a critical level where a strong reaction may occur, as it aligns with historical price zones and previous sell-off extensions. The $14,600 support from 2021 remains a last defense level, potentially preventing deeper declines.
Traders should monitor volume and price action confirmations at key levels to assess whether the index is setting up for a reversal or further downside continuation.

NASDAQ Trade Plan: From 4-Hour Trend to 15-Minute Execution!NAS100 Strategy: Using Fibonacci and Market Structure for Precision!
📊 In this NASDAQ (NAS100) trade idea, I focus on a top-down approach starting with the 4-hour chart. If the 4-hour trend is bullish, I look for higher highs and higher lows. If bearish, I focus on lower highs and lower lows. 🔄 My key strategy is identifying pullbacks into equilibrium—around the 50% Fibonacci retracement level—within any price swing. This is my point of interest.
Once price moves into this area, I shift to the 15-minute chart to refine my entry. 🔍 Here, I wait for a break of structure during the pullback, aligning with the overall trend direction. This approach allows for precise execution while staying in sync with the larger trend. 🚀
⚠️ This is not financial advice. Always trade responsibly and manage your risk.
