Nas100 quick short opportunityTraders here is a quick sell opportunity on Nas100. We know price is in a strong downward momentum and bears do not want to give up their positions yet. We can expect price to fall a little more to the demand zone as price didn't completely reach the level. With this short position I will target 13200. It is important though to cut positions before 13200 as we approach the demand zone for safety.
Do also consider checking out my previous idea for you to have a clear understanding of why I am taking this short position.
Previous idea
Do not forget to like and follow for more ideas like this.
Nas100signal

NAS100 Daily Outlook | 22 - AprPrice printed huge changes yesterday with up to 300 pips profits. Today, an very keen to see what price has in stock for us.
I will update result later.
Kings.

🧅 waiting for confermation on NAS100 1:6 RR on NAS100
.
with 73 pips SL
.
waiting for third wave
.
pending buy position at previous OB
.
This is Not Financial Advice
.
🧅JUST AN OPINION OF THE ONION.🧅

NAS100 - Long Trade Idea 13800 TARGETNAS100, 15m Buy
Entry - 13660.50
Stop Loss - 13630.50 (30 pips)
Take Profit - 13810.50 (150 pips)

Nas100 remains vulnerable to the downside|New UpdateHey traders,
This is just a quick update on our Nas100 projection. Yesterday I mentioned of why I thought it would be relevant to look for short positions on Nas100. My bias still remains although there were no much movement Yesterday despite some whipsaws that we saw during New York session yesterday. As technical traders, we should always scrutinize and follow new market developments. When new developments unfold we should be swift to change our positioning.
As of now, the change in trend will only be determined how bulls react today. If they successful push price beyond the falling channel then it would signal a change of trend. As long as price is within this falling channel, sellers will continue to press and their focus will be the demand zone at 13000.
I know you friends would have different opinion. I think it is best to also make it clear that this is my opinion and it is mine alone. Hahahaha. I would respect your view and will never want to criticize it because what one sees in the market others would see it differently. Technically speaking, we all have different trading strategies, styles and market approach. That's why there's a winner and that's why there's a looser. We all can't win or loose at the same time. That's what makes trading fun. We trade what we see, we trade our plans.
In addition, my ideas should only be viewed as expression of thoughts and opinions and not investment advice.
If you find my ideas helpful, please do not hold back your appreciation with likes. To share your opinion just remember to be kind here and clearly state why your opinion should matter.
Thank you!

Nas100 New Entries + Exits (Best Reverse Strat Ever)The 1on1 video is currently out, if you would like it in order to understand how to play my analysis FULLY, please let me know privately.
All likes/comments and feedback are very much appreciated!
How to play my chart:
Buy at support, sell at resistance. When you open this chart you'll see a green entry and a red entry. When the candlestick hits the green entry, you place a buy. If however that support buy doesn't go into profit and goes negative -35 or -60 pips (depending if it was a fast break/or if the break landed on a minute 15 zone), if it breaks you would then exit your buy and immediately enter the sell. You would then ride that sell down to green TP1, or you could then repeat and play the buy/break there.
The same exact thing goes for resistance sell/break plays!

Nas100 Entries + Exits!The 1on1 video is currently out, if you would like it in order to understand how to play my analysis FULLY, please let me know privately.
All likes/comments and feedback are very much appreciated!
How to play my chart:
Buy at support, sell at resistance. When you open this chart you'll see a green entry and a red entry. When the candlestick hits the green entry, you place a buy. If however that support buy doesn't go into profit and goes negative -35 or -60 pips (depending if it was a fast break/or if the break landed on a minute 15 zone), if it breaks you would then exit your buy and immediately enter the sell. You would then ride that sell down to green TP1, or you could then repeat and play the buy/break there.
The same exact thing goes for resistance sell/break plays!

NAS100 Hrly long | Algorithm Trade NAS100 hrly long
buystop @ 14830
TP #1 @ 14954 77.78% wr
TP #2 @ 15054 56.67% wr
SL @ swing low 14574 12.22% hr
WR and HR determined from past trades on this pair, on this timeframe.
More trades like this on my profile and on Bifrost Trades.

Nas100 Buy opportunityHey traders, here is a quick analysis on Nas100. Price got a strong rejection at 13100 and bounced up and it broke above the descending channel that kept it in a sloppy downward momentum.
Stock futures were higher early Wednesday morning as investors continued to assess a surge in commodity prices and high inflation while the war in Ukraine continues.
Futures tied to the Dow Jones Industrial Average rose 365 points, or about 1.7%. S&P 500 futures climbed and Nasdaq 100 futures also each gained 2.7%.
Giant stock markets shows a sign of improvement. Might this be the end of the selling momentum for the stocks? Only time will tell.
In a short time, I predict Nas100 to rise with two targets in mind 13637.52 and 13809.23 if possible it might reach 14200.
Friends I will appreciate it if you show your support of this idea with likes. Also do take time to view my previous analyses by following the links below to gain insight of my predictions.
If you have any thoughts please do share in the comment section below.

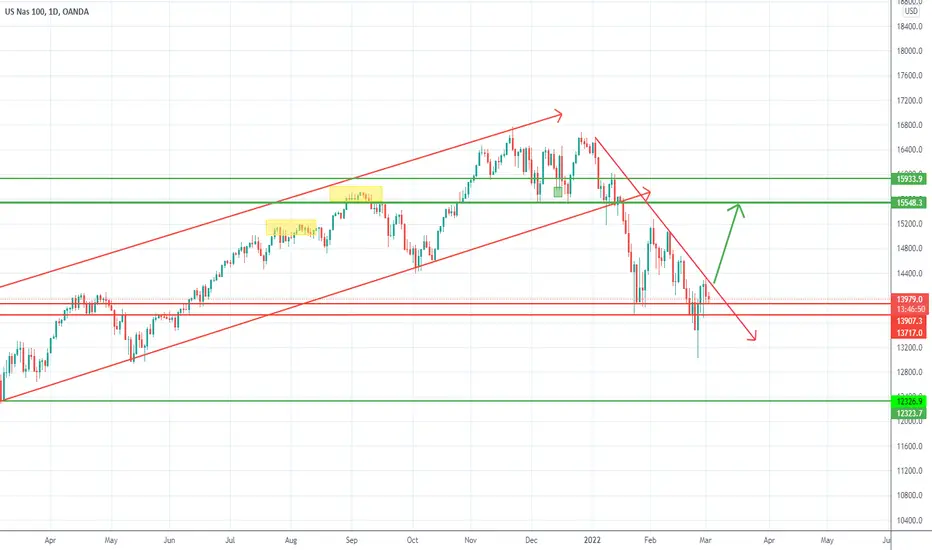
Nas100: Important levels to carefully watch and update!Hey traders,
Talking from my previous idea, I mentioned that Nas100 was really in a strong downtrend and the momentum made it challenging for the bulls to push price higher. With the Ukraine-Russia war which intensified we could only watch major U.S. stocks getting major blows in the past days. The market being driven by fear as investors continue to digest of what's to come, investors are finding refuge in safe haven assets and obviously withdrawing their funds to invest in assets they have certainty of producing value to their capitals.
If the tension between Russia and Ukraine continues to escalate, we can expect the worst in the stock market. We will carefully monitor talks and negotiations between these countries, any sign of improvement we might see the stock market turning to normality again which will in turn boost the Nasdaq100 index.
Nevertheless, I am carefully watching important levels where I think there would be major turning points for Nas100. Around 12900 and 12300 as marked on the chart. This is according to the technical aspect of the index. See the higher time-frame ascending channel that we been singing for months, from the time of the breakout Nas100 had been in a downward momentum to fulfill this channel. We been carefully watching for Nas100 to find footing on one of the lows. Whenever each low got violated, Nas100 continued to move down.
We should keep in mind that the index is more weighted on the fundamental and geopolitical events at this point in time. Whatever the market digest from this, we can expect the outcome. We do not want to rely only on technical analysis but also paying attention to the world events as well and assessing how investors are reacting to this.
Congratulations to everyone that took advantage of my previous idea and benefited from this. Make sure to follow for future update.
Previous Idea 💡
Outcome (+700 Pips move) ✅
Do not forget to like and comment if you have any suggestions or opinions on this idea. I will be happy to know your thoughts on this.

Nas100usd daily trade setup Nas100usd daily trade setup market change the trend now i expecting bearish trend wait for supply retest then we enter sell for long term

Nasdaq100- Was 13k the bottom for this correction?War or not war, Nas100 reversed strongly from 13k zone and increased 10% in just 3 days.
At this time the price is in a normal correction and if 13500-13700 holds, we can expect a new leg up to 15500.
That being said, bulls can look for opportunities to buy in that zone with a negation under 13k.
Best of luck!
Mihai Iacob
1:16 😂 1:16 RR on NAS100
.
if i lose it's a small lose , i can take that if you can't take that just go.
.
This is Not Financial Advice, JUST AN OPINION OF THE ONION.
.
JUST AN OPINION OF THE ONION.
.
JUST AN OPINION OF THE ONION.
.
JUST AN OPINION OF THE ONION.

1:13 on NAS1001:13 RR on NAS100
.
.
Black lines are where you can Take Profit
.
This is Not Financial Advice, JUST AN OPINION OF THE ONION.

NAS100 Buy AnalysisPrice has broke out of the trendline on 1H timeframe
Currently looking for long potential positions which confluence with the retest of the level the market broke out

Nas100: The light is getting brighter/watch this pattern Nas100 is creating a triangle formation. We only have to wait for this pattern to be completed and violated on either side to be able to predict the direction of the market. As we know, after an impulse follows a correction, that is how the market moves and will always move. What we see right now is just a correction and a strong move is yet to come. Here is what we should keep in mind, if we see a violation of this pattern anytime soon to the bottom of it then we can expect a strong move to the downside, probably a move that will send price at least to 12000.
If bulls succeed to reverse price and if they can be able to violate the pattern to the top then we will see a strong recovery on Nas100.
Additionally, as long as Russia and Ukraine tension continues to escalate, we can expect the worst for the stock markets which will dramatically put downward pressure to the index.
Maybe you have additional thought to add to this. Please make use of the comment section to share your opinion.
If you like this idea, please be kind to hit that like button❤️
I truly appreciate each an everyone of you for your continuous support❤️
Keep on Trading Smart☺️
Forexintelligence

Nasdaq Analysis 16.02.2022Hello Traders,
welcome to this free and educational analysis.
I am going to explain where I think this asset is going to go over the next few days and weeks and where I would look for trading opportunities.
If you have any questions or suggestions which asset I should analyse tomorrow, please leave a comment below.
I will personally reply to every single comment!
If you enjoyed this analysis, I would definitely appreciate it, if you smash that like button and maybe consider following my channel.
Thank you for watching and I will see you tomorrow!

NAS100 hrly short | Algo Trading NAS100 hrly short
shortstop @ 14476
TP #1 @ 14351.20 78.48% wr
TP #2 @ 14236.06 56.96% wr
SL @ swing high 14677 11.39% hr
WR and HR Determined from past trades on this pair.
More trades like this on my profile and on Bifrost Trades.

NAS100 hrly long | algo tradingNAS100 hrly long
buystop @ 14500
TP #1 @ 14591 87.50% wr
TP #2 @ 14756 65.63% wr
SL @ swing low 14030 9.38% hr
WR & HR determined from past trades on Nas100.
More trades like this on my profile and on Bifrosttrades

NAS100: Do not miss this buy opportunity!Traders as I mentioned previously, if bulls break above 14840.00 we can expect more buying pressure. Getting a boost from the giant stocks now turning green, we can only be confident that the Nas100 whales are back and higher price will be driven.
I am very eager to see what will happen at the nearest high at 15250, a break above this level bulls will continue to dominate until 16000. I will probably take partial of my profit at 15250 and lock in some positions.
If you caught this trade from my previous idea then congratulations.
Do not hold back your appreciation by liking this idea.

NAS100 | Algo trading** Nas100 hrly long**
buystop @ 14781
TP #1 @ 14863 86.67% wr
TP #2 @ 14983 63.33% wr
SL @ swing low 14486 10% hr

Nas100: Important levels to watchTraders, looking at the current market structures, I have marketed important levels that I will be waiting for Nas100 to take direction. Currently Nas100 is trading at around 14700.00 indecisively, a successful break above 14840.00 will attract buyers and we can expect price to be pushed to 15250.00. However, if it breaks below 14400.00 successfully, we can only expect price retesting the 14000.00.
Please support this idea with likes. Please share your opinion in the comment section below.

NAS100 Long AnalysisHey traders, here is the analysis for the NAS100. Let me know if you guys have any questions in the comment section. If you guys like my analysis please hit like. Thanks. NOTE - Please do your own analysis before taking the trade.
