US30 and NAS100 Possible buy zone!Hello traders, this is a complete multiple timeframe analysis of this pair. We see could find significant trading opportunities as per analysis upon price action confirmation we may take this trade. Smash the like button if you find value in this analysis and drop a comment if you have any questions or let me know which pair to cover in my next analysis.
Nas100signal

Nasdaq- New ATH this year? VANTAGE:NAS100 has experienced a remarkable year, witnessing a 60% surge in the technology index.
More notably, as the year draws to a close, it is hovering around the previous all-time high (ATH) zone.
Technically, following a false breakdown at the end of October, Nas100 displayed robust upward momentum.
Over the past three weeks, the index has been consolidating gains in the upper zone, awaiting a catalyst for a renewed upward push.
Dips within this consolidation phase are evidently being bought, and the anticipated Christmas rally is poised to propel the index to a new ATH.
I maintain a bullish outlook as long as 15,500 remains intact, and a target of 17,500 appears quite plausible within the context of the three-week consolidation and the mere 10% distance to the target.

US100 NASDAQ Technical Analysis And Trade Idea NAS100Lately, the NAS100 has displayed a strong bullish trend. This video extensively explores the trend, meticulously analyzing price movements and identifying possible trading prospects by thoroughly assessing both the weekly and daily timeframes. Anticipate a detailed assessment of price behaviors, market patterns, trend assessments, and key technical analysis components. It's crucial to emphasize that the content provided is purely for educational purposes and should not be interpreted as financial advice.

POSSIBLE TEMPORARY BEARISH ENTRY FOR NAS100PEPPERSTONE:NAS100 BLACKBULL:NAS100 VANTAGE:NAS100 OANDA:NAS100USD
Hello everyone, upon watching closely multiple timeframes where I combine a few types of chart analysis (support & resistance, candlestick patterns, breakout strategy, etc.) I'm thinking NAS100 will go bearish, at least temporarily, because ultimately the price movement in the charts tell us all, and my goal is always to read it right.
That chart I'm sharing with you is pretty self explanatory.
Make sure to comment your thoughts below and let me know any questions you might have if you have any.
My goal is to try and always be helpful, and while I sometimes fail (I'm a human not a robot) I do my best to always be better, and I never see failure as the final destination.
If you got to this point, happy profiting!

SMT divergence in NAS100As it is clear from the daily chart NAS100 has created a new higher high, while S&P and DowJones did not.
In such situation the possibility of a bearish trend is increasing and we can look for sell positions in incoming days

Nasdaq average returns (before and after) ThanksgivingBased on the observation that US equity markets tend to perform well heading into Thanksgiving, we decided to take a proper look at the figures. And it turns out, the Wednesday ahead of Thanksgiving tends to average the strongest positive returns of 0.54% with an 80.6% win rate.
The Nasdaq followed its seasonal tendency to rise on Monday, and closed at a 22-month high above 16k. Whilst Tuesday tends to be a down day, it has risen 52.8% of the time which explains the positive median return. But in a nutshell, the Nasdaq tends to rally into Thanksgiving and weaken the following Monday. And with RSI 2 and RSI 14 overbought alongside hype of strong Nvidia earnings, bulls may want to err on the side of caution next week - especially if we see a strong rally on Wednesday.

NASDAQ : H4 / D1 : big LOng !!!NASDAQ :
Market price : 15470
Buy1 : 15235
buy2 : 15000
Tp1 : 15800
Tp2 : 16400
Tp 3: 17600
Tp 4 :18400
Sl: 14550
But do not forget about capital management...

NAS100 needs a retracement downAs the news about WeWork bankruptcy came out and the Dollar index is reaching higher i expect a bearish retracement to 4H FVG.

NASDAQ100 - Short SignalNAS100
The NAS100 shares a strikingly similar outlook with the Dow Jones, also known as US30 for those acquainted with the terminology. In fact, the NAS trend appears even more pristine compared to US30. The lower lows (LL) and higher highs (LH) sequence exhibits greater consistency on NAS100, while US30 displays a minor fake-out, although still well-contained within our designated zone.
Choosing to align with either NAS100 or US30 is a decision not to be taken lightly. It hinges on a careful assessment of risk considerations, instrument pace, and prevailing market expectations, rather than simultaneously trading both indices.
NAS100, 3rd touch on Demand Zone, 2 Long entry setups1. Long entry near the Demand Zone.
2. After breakout of trend (Resistance) Line.

NAS100 Long Trading SignalNAS100 Long Trading Opportunity
1. The price closed above the Trend Magic Indicator line.
3. Vortex cross and indicates strong uptrend signal.
4. Retail trader data shows 55% of traders are net-short. Strong contrarian long signal.
SL - below the Trend Magic Indicator line or Vortex indicator change trend direction signal
TP1- 15490
TP2 - 15790
Keep It Simple and Always Trade With the Trend!
Please, Support Our Work with Like & Comment! Thank You!

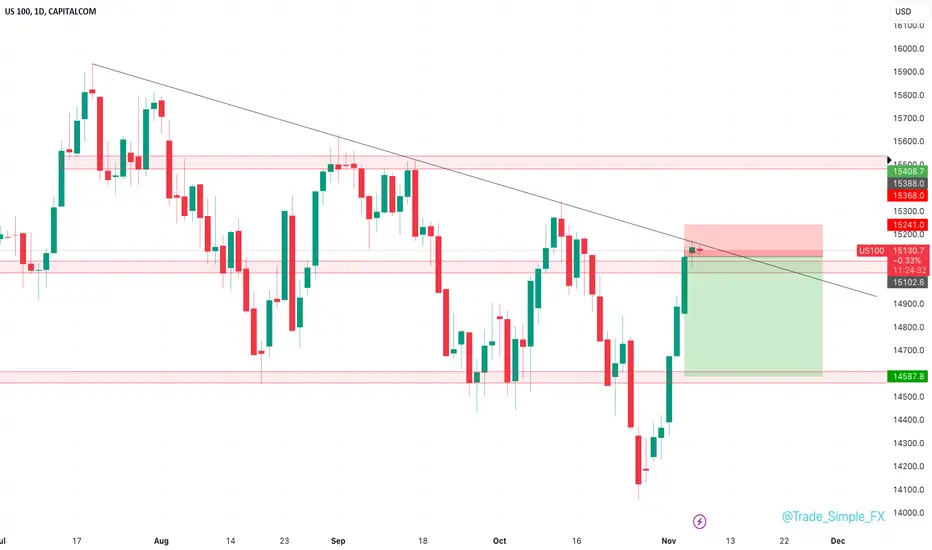
Nas100- New drop to 13500?In mid-September, I wrote that Nas100 could drop to 14500 support.
Indeed, this target was hit on 28 September and a correction followed from this support level.
Yesterday, all this up correction was negated by a strong red candle and a local high could be in place.
My bearish outlook for indices is unchanged and, in the Nasdaq case, I expect a new leg down to the 13500 zone.
Rallies should be sold in search of good risk:reward.

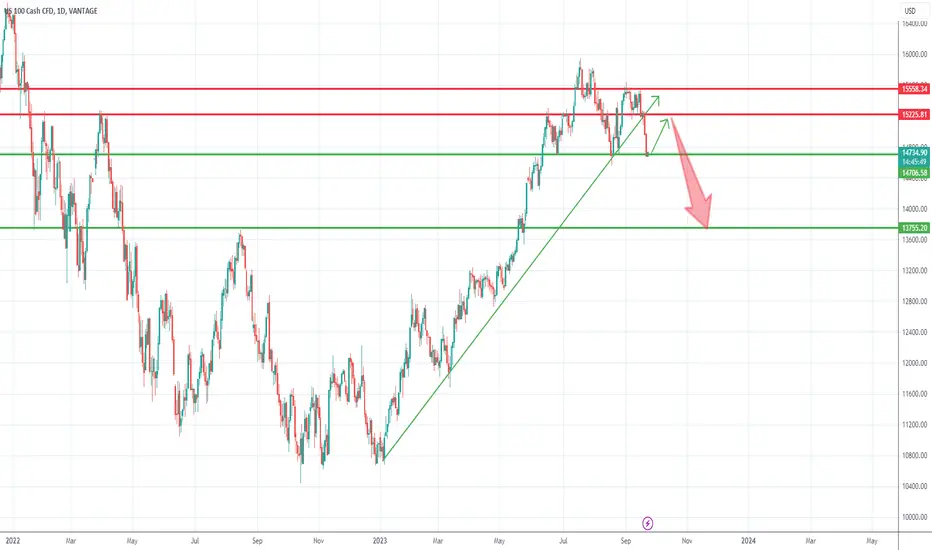
Nas100- Drop under 14k after correction?On 13 September I wrote that Nas100 could lose trend line support and, as long as the 15500 zone is intact as resistance, there is a high chance for the index to drop to 14700-14800 zone support.
As we can see from the chart, after a new test of the resistance zone on 15 September, the index started to drop again and, two days ago we had a strong break under the trend line and a dive directly to horizontal support.
At this moment, a correction is probable, but, in my opinion, this rise will be short-lived and should be used as an opportunity for short trades.
In conclusion, rallies above 15k should be sold and the medium-term target for such a trade could be in the 14k zone and slightly under.
NAS100 and US30 Top-down analysis Hello traders, this is a complete multiple timeframe analysis of this pair. We see could find significant trading opportunities as per analysis upon price action confirmation we may take this trade. Smash the like button if you find value in this analysis and drop a comment if you have any questions or let me know which pair to cover in my next analysis.

NAS100 and US30 Top-down analysis Hello traders, this is a complete multiple timeframe analysis of this pair. We see could find significant trading opportunities as per analysis upon price action confirmation we may take this trade. Smash the like button if you find value in this analysis and drop a comment if you have any questions or let me know which pair to cover in my next analysis.

NAS100 SHORT CALL!!!Hello traders I hope you guys are doing amazing here is my analysis for NAS100 what you guys think let me know in the comment section.

NASDAQ TECHNICAL ANALYSIS Good day, traders.
I anticipate additional Nasdaq selling till the 14716-area, after which I'll look for a positive momentum to ride into the 15000-area as a first take profit and 15688-area as a second take profit. No entrance without a bullish confirmation

NAS100 US100 Technical Analysis and Trade IdeaThe NASDAQ US100 has reached a significant resistance level and is presently exhibiting signs of being over extended. Within the video, we delve into a range of crucial elements related to technical analysis. These include evaluating the prevailing market trend, examining the structure of the market, analysing price action, and potentially identifying a trade prospect as we approach the conclusion of the video. It's important to note that the video provides a comprehensive and thorough explanation of all these factors. As a reminder, the content is intended for educational purposes and should not be interpreted as financial advice.

XAUUSD Top-down analysis Hello traders, this is a complete multiple timeframe analysis of this pair. We see could find significant trading opportunities as per analysis upon price action confirmation we may take this trade. Smash the like button if you find value in this analysis and drop a comment if you have any questions or let me know which pair to cover in my next analysis.

US100 NASDAQ Technical Analysis and Trade IdeaThe NAS100 has encountered a significant support level followed by a minor retracement. Although the prevailing trend is undeniably bearish, the pivotal question revolves around the depth of the potential pullback, which could serve as an entry point for us. Within the video, we comprehensively address multiple facets of technical analysis, encompassing the trend's dynamics, price action, market structure, and more. I want to emphasize that the video provides a thorough explanation of all these elements, however, should not be interpreted as financial advice.

NASDAQ RiskyRisk 0.5%
TP1 = 1:1 RR
Disclaimer:
The contents in this Idea are intended for information purpose only and do not constitute investment recommendation or advice. Nor are they used to promote any specific products or services. They serve as an integral part of a case study to demonstrate fundamental concepts in risk management under given market scenarios. A full version of the disclaimer is available in our profile description.

NAS100 30m Analysis. Signal!!!Hello Everyone. I want share my day trading signal about nas100.
We had on this pair strong bullish trend but after touch weekly resistance we see some strong sellers here.
Trend is strong bullish for long term but after touch to weekly support we had 5 touch which did not broke .
My entry point will be 15688 point with 6.0 reward and this 3 target is at the best point, if i will be right we will take this targets, then its possible to follow market but we need to be carefully with Liquidity swing because my entry point is interested and marketmakers can make some liquidity there.
Good luck!!!!

Nasdaq -> Please Look At The Odds!Hello Traders and Investors ,
my name is Philip and today I will provide a free and educational multi-timeframe technical analysis of Nas100 💪
After the Nasdaq perfectly retested the monthly 0.618 fibonacci retracement, previous monthly support and also broke above a clear bearish trendline, we had a solid rally of roughly 20%.
With the Nasdaq now retesting the next weekly resistance at the $15570 level I do expect a short term rejection again away from the resistance but then eventually the creation of new all time highs on the technology index.
Looking at the obvious rising channel on the daily timeframe you can see that on Friday the Nasdaq once again rejected support and there is in my opinion currently a 50% chance that we will still see a major correction but objectively looking at the index there is no sign of weakness yet.
Keep in mind: Don't get caught up in short term moves and always look at the long term picture; building wealth is a marathon and not a quick sprint📈
Thank you for watching and I will see you tomorrow!
My previous analysis of this asset:
