NAS100 Scale in pos.08.04.2024
Check my last Nas100 post. Scale in position.
Despite a slight upward movement followed by a significant drop, I'm still adhering to the overall bullish trend. We're currently at a low point where we're likely to witness bullish price action. NAS100 still has liquidity above, so I'm not anticipating bearish pressure, but time will tell.
scale in pos. on aggressive entry module
US NAS 100

NAS100 Long Set UpThursday, 04.04.2024
We took the previous weekly low and touched my 8 EMA.
On the daily timeframe, we have two strong daily wick rejections at my daily VWAP low, and we also observed important daily liquidity lows. Now, a small pullback is expected, followed by a long.
Aggressive entry module

NAS100 Technical Analysis and Trade IdeaIn the video, we explore a potential trading opportunity in the NAS100 index. Our analysis involves assessing the current trend, studying price fluctuations, evaluating market structure, and identifying a potential entry point under favourable conditions (if they occur), as explained in the video. Remember to integrate robust risk management principles into your trading strategy. As always, please note that this information is purely for educational purposes and should not be interpreted as financial advice.

NAS100/NASDAQHello Fellow traders, this idea on SKILLING:US100 is being distributed to my community, I'm sharing it here for your comments, if this is valid.
This is only my view, im looking for another Buy limit on this pair $nas100.
This is not a financial advice,
Once we hit another 2 highs, I will update again this idea.
Follow for more.

NAS100 Technical Analysis and Trade Idea #US100 #NASDAQNAS100 has traded bullish and is currently over extended. In the video we look at the trend, market structure, price action and we discuss two potential trade opportunities on both the 1D and 4H time frames. Not financial advice, manage risk well.

NAS100 incoming Rally!It's been a minute but here is a quick Freebie for y'all! Enjoy! We have been destroying CME_MINI:NQ1! lately on all of our funded accounts.
Quick Scalp Trade:
Entry@ 18273.75
Take Profit #1 @ 18341.00
Stop Loss @ 18266.50
Larger Swing Trade:
Entry@ 18273.75
Take Profit #2 @ 18672
Stop Loss @ 18104.25

Please God, Just One More Bubble. What Crying 2000's Are CallingChastened by the tech bust, venture capitalists and entrepreneurs have spent the last couple of years taking startups back to basics. No longer could they expect to turn an idea scribbled on a napkin into an instant company and cash out in a couple of years. To get funding and go public, companies had to have solid technology and business models, experienced management, reasonable valuations -- and, above all, profits. This reassuring regime made it easy to laugh at a bumper sticker sighted around the Valley last year: "Please God, just one more bubble."
Now, it looks less like a joke than a warning. Too many tech investors, from Wall Street to Sand Hill Road, seem to be ignoring why they crashed after the 1990s hit a dead end. Venture capitalists are pouring money into look-alike startups in nascent sectors such as social networking. Even after a recent swoon, stocks of some dot-coms, such as eBay Inc. (EBAY ), look pricey. And not only are more money-losing companies going public, initial valuations can be distinctly frothy. Google Inc.'s imminent offering, for instance, could value the search engine phenom at $36 billion. Says Bill Burnham, managing partner of the VC firm Softbank Capital Partners: "Some people expect the good old days will be back and they can party like it's 1999."
Indeed, the rise in shaky initial public offerings may be the most worrisome indicator that not all investors have learned their lesson. Some 44% of the companies going public so far this year were losing money, compared with only 30% last year, according to the investment bank Renaissance Capital. "They've lowered the bar," says Renaissance analyst Paul Bard. Why? "The VCs are pushing their companies to go out," says Jef Graham, CEO of networking startup Peribit Networks Inc., which has held off going public for now. "Bankers are like sharks smelling blood in the water."
That was a part of Bloomberg publication , dated on August 25, 2004.
It's gone 20 years or so..
- Something changed?
- Nope. Nasdaq-100 is near the same 'red lines'.

Nasdaq Intraday Review - Monday 11 Feb 2024 I trade Nasdaq exclusively
Trading in GMT time zone
Sharing my post day review and analysis in case it can help you!
Did my analysis at +- 5:20am
During analysis noted the following:
Large DT formed on the 4H (marked with black lines)
Sellers fib (drawn from swing high at D. to swing low at E.) indcated that price retraced to Sellers 0,382 fib level + pivot (at C.) and price now moving down
Price consolidating above a very strong D support level (marked in grey zone highlight), with D EMA in the area - would need strong bearish push to break this support zone
2 x long wick candles on 4H TF touching this support zone, indicating that there is buying power at this zone.
Would like to see a nice DB with neckline break before entering a buy
Entered a buy at A. - Confirmations:
Market Patterns: Break of the neckline of a DB formed on the 1H TF
S&R / EMA: DB formed at strong Day support zone with D EMA in the area, providing dynamic support
Fib: DB formed just above the W 0,382 fib level
Trend: Entering a buy means trading in the same direction as the overall bullish trend - The trend is your friend
Candlesticks: 2 x 4H long wick candles rejecting the strong Day support zone
Mental stop place halfway down the height of the market pattern.
Market moved down with momentum and I closed this position at stop loss
Re-entered a buy at B. based on similar confirmations.
The two long wick candles on the 1H TF (one in red and one just at B.) indicated to me that bulls were stepping in at the D support zone.
Ultimately, market came down again and I closed this position also in a loss.
Total pips loss for the day was 1900, because in the second entry I wanted to make sure that bulls would not step in again.
After this loss, I decided to stay out for the rest of the day!
What could I have done differently?
I think that seeing that market retraced to seller's 0,382 fib + moving down, should have been a strong indication to me that a sell was in play, possible till Seller’s TP1.
I should have waited for the extra confirmation of a neckline re-test before entering.
Hope you had a better day than me!
TF = timeframe
TP = take profit
1H = 1 hour
4H = 4 hour
D = day
W = week
M = month
S&R = support & resistance
EMA = Exponential moving average
DT = Double Top
DB = Double Bottom

Nasdaq Intraday Review - Thursday 7 Mar 2024I trade Nasdaq intraday exclusively
Trading in GMT time zone
Sharing my post day review and analysis in case it can help you!
Did my analysis at +- 5:20am GMT
From my previous post you will know that I had a buy position at D. running.
As the morning progressed, market came down and the long wick at E. took out my D. position because I had secured at entry.
Waiting to see price action, I entered a buy at C. - Confirmations:
Fib: DB formed on the 1H TF (not marked on the graph but clear to see on the 1H TF at E.) at the 4H 0,618 fib level + Week 0,382 fib level
Market pattern: DB formed on 1H TF and neckline broken
Candle sticks: Long wick bullish candle on 1H TF (at E.) + strong bullish momentum candle to break the neckline
S&R + EMAs: DB formed at strong Day support level + D EMA providing dynamic support roughly in this area too
Trend line: None specifically but position is in the same direction as the overall trend (bullish in this case) - the trend is your friend
SL: Placed roughly halfway into the height of the market pattern, marked by the thick purple line
Tp's were determine using the fib drawn on the 4H TF (swing low = A. and swing high at the time was B. - se A. and B. on 1H TF and ignore on 4H TF on graph)
TP1 - 18240
TP 2 – 18360
Market moved well in my favor, ultimately creating a DB on the 4H TF (marked in black lines) with a neckline break and so interesting that the profit target (i.e. the same distance as the height of the market pattern) lined up perfectly with TP 1
On the 1H TF, price broke through the temporary down trend blue line at F and then a small red candle to re-test, before moving up again.
Took partial profit at TP1 and Finally closed my full position right up close to TP2 when a double top formed on the 15min TF.
Ultimately market moved 3586 pips from my C. position and I closed out at 3300 pips.
It was a goooooooooooood day! :)
What could I have done differently?
Entered a much MUCH bigger position! Haha!
Hope you caught this buy!
Good luck for NFP trading - think I will stay out today.
TF = timeframe
TP = take profit
1H = 1 hour
4H = 4 hour
D = day
W = week
M = month
S&R = support & resistance
EMA = Exponential moving average
DT = Double Top
DB = Double Bottom

Shorting Nasdaq for short termLooks like we are in wave c of correction wave
17900 is what I'm looking for target.
Good luck mates, have a nice ride

NAS100USD Will Go Up From Support! Buy!
Here is our detailed technical review for NAS100USD.
Time Frame: 12h
Current Trend: Bullish
Sentiment: Oversold (based on 7-period RSI)
Forecast: Bullish
The market is approaching a key horizontal level 17959.5.
Considering the today's price action, probabilities will be high to see a movement to 18481.5.
P.S
The term oversold refers to a condition where an asset has traded lower in price and has the potential for a price bounce.
Overbought refers to market scenarios where the instrument is traded considerably higher than its fair value. Overvaluation is caused by market sentiments when there is positive news.
Like and subscribe and comment my ideas if you enjoy them!

NAS100 Trade IdeaThe US100 index has retraced, entering a bullish 1D order block. Analysis of the prevailing trend on this timeframe indicates a clear bullish trajectory. I am eyeing a potential buy entry opportunity within at 61.8% Fibonacci retracement levels. Employing a risk management strategy, stops will be placed below the preceding low, while targeting the previous high and potentially beyond with the implementation of a trailing stop. However, it's imperative to note that trading carries inherent risks, and past performance is not indicative of future results. Therefore, traders should conduct thorough research and exercise caution before making any financial decisions.

Nasdaq Intraday Review - Wednesday 6 March 2024I trade Nasdaq intraday exclusively
Trading in GMT time zone
Sharing my post day review and analysis in case it can help you!
Did my analysis at +- 5:20am
On 5 March I entered buy positions at C.
Refer to that post for confirmations
Market moved up, breaking the 1H neckline and retesting the neckline at E.
Bulls pushed through all obstacles (i.e. various EMA's and pivot point)
Ultimately though, bears stepped in on sellers 0,618 fib level (at D.) and pushed down heavily
Bulls were unable to close above the 4H EMA - meaning that the 4H EMA will be a strong resistance on 7 March.
A large double top formed with neckline and profit target (height of the market pattern) marked in black lines
Bears broke the neckline down, with a neckline retest at F. and market pushed down further.
Ultimately market moved 2594 pips from my entry and I closed half my position in the region of F. (1344 pips)
Reason for closing at F. = bearish market pattern with neckline break
The remaining half of my position will be left running and hope that NFP will buy tomorrow, otherwise I will be taken out at entry.
I suspect that market may be weird today as we approach NFP tomorrow.
What could I have done differently?
No very happy with the pips I grabbed. I feel I should have closed out more pips since market moved so high.
Looking at the 30min chart, there is a clear DT (at D.) and I should have taken profit at break of this neckline
This would have meant I would have secured 630 pips more
Bulls were so strong throughout the day and I was hoping that buyers would step in again at the 1H EMA.
But a double top on the 30min TF at a seller's 0.618 fib level cannot be ignored!
Happy Trading! :)
TF = timeframe
TP = take profit
1H = 1 hour
4H = 4 hour
D = day
W = week
M = month
S&R = support & resistance
EMA = Exponential moving average
DT = Double Top
DB = Double Bottom


Why I technically feel, Tesla is ready to build 30X againKeep It Simple and Trade With the Trend.
As a trader, you have probably heard the old adage that it is best to "trade with the trend." The trend, say all the pundits, is your friend. This is sage advice as long as you know and can accept that the trend can end. And then the trend is not your friend. There are multiple ways to spot trends, direction, and momentum.
So how can we determine the direction of the trend?
Let's take a look on the KISS rule, which says, "Keep it (as much as possible) simple, stupid!" Here is a method of determining the trend, and a simple method of anticipating the end of the trend.
Before we've started, it should be mentioned the importance of time frames in determining the trend. Usually, when we are analyzing long-term investments, the long-term time frame (one-week or larger) dominates the shorter time frames. However, for intraday purposes, the shorter time frame could be of greater value. Trades can be divided into three classes of trading styles or segments: the intra-day, the swing, and the position trade.
Large commercial traders, such as those companies setting up production in a foreign country, might be interested in the fate of the currency over a long period of such as months or years. But for speculators, a weekly chart can be accepted as the "long-term".
Averages Moving in Pairs
With a weekly chart as the initial reference, we can then go about determining the long-term trend for a speculative trader. To do this, we will resort to two very useful tools that will help us determine the stage of the trend. These two tools are the simple moving average and the exponential moving average.
Going further and keeping in mind all the mentioned above rules, lets build the trend.
Darlings, well graphed Tesla stocks trend is still the same as in 2019, where it started 30x gain.
Anybody tried to get all the path at those times? There's a chance you'll miss it again!

Nasdaq Intraday Review - Tuesday 5 March 2024I trade Nasdaq intraday exclusively
Trading in GMT time zone
Sharing my post day review and analysis in case it can help you!
Did my analysis at +- 5:20am
During analysis noted the following:
So following on from Monday's analysis, I had identified the yellow highlighted area as my "Zone 2" area of interest
This was a strong area of confluence because:
It was the 4H 0,618 fib level (drawn from swing low at A to swing high at B)
+ Day 0,382 fib level
+ 4H EMA (position during the morning roughly marked in green)
I entered a pretty big buy at C. and set my stop loss really low at the orange thick line.
Ultimately I watched my position tank and took a big loss.
This scenario has caught me out many times before.
I know that before entering at a fib level, one should wait for price action to confirm the reversal.
If you look at the price action at C. level, there is clearly no price action indicating a reversal.
But if you trade Nasdaq and you know this index well, you will know that Nasdaq very often does not give price action confirmation on the bigger timeframes (15min and above)
You see it all the time how Nasdaq will dip down touch an area and the spike back up, leaving a loooooong wick candle of a hundreds of pips.
Some of my most profitable trades have been entering at these levels without price action confirmation. But like yesterday, it can also bite me in the behind.
I still haven't figured this out yet. Maybe there is confirmation on a lower timeframe?
If you know what I mean and have an antidote, please let me know! ;)
My next area of interest was the green highlighted zone. This represented an area of confluence because:
The D EMA was at this level
This was also the Week 0,50 fib level
This time I did wait for price action confirmation :) And in typical Nasdaq style, it only gave it to me way above my area i.e. 600 pips above where I would've wanted to enter (see what I mean).
So I entered at D. - Confirmations:
Market Pattern - a DB had formed on the 15min TF with a break of the neckline
Candlesticks - neckline break with strong momentum candle
Fib - W 0,50 fib level and market moving up
S&R - Dynamic support from the D EMA
Market moved up and I have secured my positions at entry, so trading risk free today.
I hope market moves well today. Lots of news so could be choppy!
What could I have done differently?
Still trying to figure it out, but on the surface, I don’t think I could have done anything different other than cutting my losses sooner.
As said, this strategy often pays off for me.
All the best!
TF = timeframe
TP = take profit
1H = 1 hour
4H = 4 hour
D = day
W = week
M = month
S&R = support & resistance
EMA = Exponential moving average
DT = Double Top
DB = Double Bottom

NASDAQ Hits Record Highs:A Short-Term Correction on the Horizon?Last week witnessed the Nasdaq soaring to new heights, surging to an all-time high of 18,346 during the European session. However, amidst this bullish fervor, indications of a possible retracement loom on the horizon.
As the Nasdaq index ventures into overbought territory, as evidenced by the Relative Strength Index (RSI), investors are cautiously eyeing a potential reversal. With the RSI signaling overbought conditions, market sentiment suggests a corrective move, with the 18,000 level emerging as a plausible target for price adjustment before contemplating further bullish momentum.
In the realm of economic events, this week's agenda is marked by significant announcements. Today, investors eagerly await the release of the Sentix Investor Confidence data for March, which could offer insights into market sentiment and future investment outlooks.
Looking ahead, all eyes turn to Federal Reserve Chairman Jerome Powell's semi-annual monetary policy report and congressional testimony scheduled for Wednesday and Thursday. Powell's remarks are anticipated to provide clarity on the Fed's stance regarding interest rates and monetary policy measures, potentially influencing market sentiment and investor behavior.
Simultaneously, Thursday brings forth the highly anticipated monetary policy decisions from the European Central Bank (ECB). The ECB's announcement will shed light on its policy outlook and potential measures to address economic challenges, offering valuable cues for market participants.
In light of these developments, investors are preparing for a short setup, anticipating a temporary correction in the Nasdaq's upward trajectory. While record highs have been achieved, prudent risk management strategies are in place to navigate potential market fluctuations and capitalize on emerging opportunities.

Nasdaq Intraday Review - Monday 4 March 2024I trade Nasdaq intraday exclusively
Trading in GMT time zone
Sharing my post day review and analysis in case it can help you!
Did my analysis at +- 5:20am (just before 1am EST)
Looking exclusively for a buy because "the trend is your friend"
During analysis noted the following:
Price consolidating in a triangle on 1H (marked by blue circle)
I feel the market will retrace today
Two interest zones identified
Zone 1:
Area of confluence because -
Pivot point
4H 0,382 fib level (fib drawn from swing low at A to swing high at B)
Market pattern - Just past profit target if a double top forms; market tends to reverse at or near profit target to re-test the neckline. I like being part of a re-test that is the same as the overall trend (bullish in this case)
Zone 2:
Area of confluence because -
4H 0,618 fib level
D 0,382 fib level
4H EMA (was in this region at time of analysis and throughout the day)
I set buy limits at each zone as follows:
A smallish buy position at Zone 1, because for me the confirmations are not soo strong and it really depends on price action so I will judge the market sentiment based on candles to see if I add more
A large buy position at Zone 2, because these are strong confirmations and price should at least bounce from here.
Ultimately a DT did form and break the neckline down. But market was very slow and none of my zones of interest were triggered.
In the evening, I cancelled my buy order in Zone 1 because I felt market was very slow and I wouldn’t get the reaction that I wanted in this area.
Clearly, investors are waiting for the inflationary data this week.
What could I have done differently?
Nothing
Hope you had a good trading day! :)
TF = timeframe
TP = take profit
1H = 1 hour
4H = 4 hour
D = day
W = week
M = month
S&R = support & resistance
EMA = Exponential moving average
DT = Double Top
DB = Double Bottom

NAS100 LONG waiting for the pull back and rejection with signs of continuation rather than trying to short in a very bullish market. It is very over extended and is due for a pull back

NAS100 LONG (UPDATE)This is an update on my previous post of NAS100 longs. So NAS didn't give us the retracement we were looking for but we could easily still identify areas where we could take good entries off of. The initial move that bought NAS past the 18000 level was quick but gave us some hints as too where price could retrace to. If we look at where volume was present it falls on a key level (17800), which from previous price action has shown to be a well respected level. That along with some rejection off of that area would give us enough confirmation to enter and target fib extensions at price level 18300. Sometimes when price doesn't play out how we want it to we have to react of what it is giving us and that is a very important skill that any trader should practice.

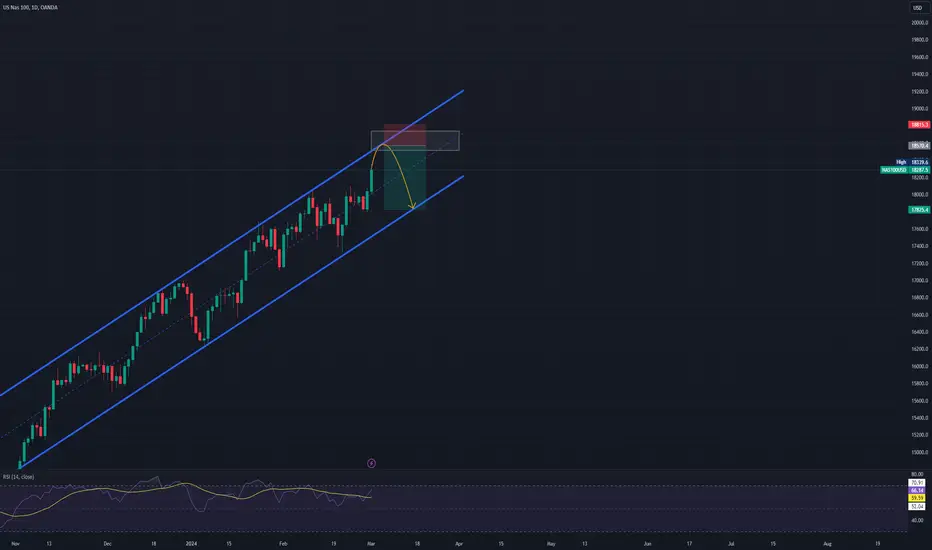
Strong Bullish Trend Continues for US NAS 100The US NAS 100 has shown strong upside potential in a channel-like pattern on the daily chart. We expect it to smoothly rise towards the top of the channel and after reaching the channel roof, experience a slight downtrend towards the bottom of the channel. 📈📉

Nasdaq Intraday Review - Friday 1 March 2024I trade Nasdaq intraday exclusively
Trading in GMT time zone
Sharing my post day review and analysis in case it can help you!
Did my analysis at +- 6:30am GMT (1:30 EST)
During analysis noted the following:
The February month candle closed as a green momentum candle, indicating a very bullish market, despite being at all-time highs and despite the worries around inflation / Feb rate cuts
On the D TF, a beautiful DT had formed in the past few days, broken the neckline down and then price completed the pattern perfectly by moving down the same distance as the height of the market pattern
The area at the pumpkin was an area of confluence because:
It was the profit target of the DT (same distance as the height of the DT)
It was the D 0,382 fib level, as well as coinciding with the W 0,382 fib level
Generally, after reaching the profit target of a market pattern, price will reverse to test the neckline
I like to be part of a re-test that is in the same direction as the overall trend (in this case bullish)
From the pumpkin, price re-tested the neckline and with the help of inflation data news on 29 Feb (PCE and initial jobless claims), price broke through the neckline and continued upwards
Meaning that the bullish trend CONTINUES!!
Interesting to see how price came back down to test the temporary downtrend line marked in red. It was a deep retest of 830 pips by bears (pushing down till A.), but on 1H TF, you can see how bulls pushed back up and managed to close the candle at A. above the temp downtrend line
So looking exclusively for a buy - the trend is your friend!
At time of my analysis, price has reached TP1 (roughly at the pink horizontal line) of the move yesterday
This means that market may retrace at this point, so I need to wait patiently for a convincing break of this area before buying, or alternatively, wait for the retracement before jumping in.
Yellow highlighted area = area of good confluence:
4H EMA was in this zone at time of analysis
4H 0.618 fib level - a strong fib level (Fib drawn from swing low at A. to swing high at B.)
Daily pivot point
I set my Buy Limits in this zone for a big position size, due to strong confirmations
Entered a buy at C. - Confirmations:
Market seemed to have convincingly broken above the TP1 level (on 30min TF) and seemed to want to move directly to TP2
I don’t like buying at the very peak of price, so I entered a very small buy
Ultimately price reversed and this position was in draw down
I closed at entry as soon as price moved back up
I was waiting for price to reach my yellow buy zone, but it never did.
Price dipped to touch the 4H 0,50 fib level, and a DB appeared on the 15 min TF
This indicated that price was ready to move up and would not reach my buy zone
I entered a buy at D - Confirmations:
Fib - price had touched the 4H 0,50 level and moved up
Trend - entering a buy meant I was trading in the same direction as overall trend
Market Pattern - DB formed on 15min TF at 4H 0,382 fib level
Candle sticks - The red 1H candle at D. closed with a long wick touching the 0.50 fib level and closing above the 0,382 fib level
I entered at half my total planned buy position in case market still moved down into my yellow buy zone and at the moment of entering a buy at D., I cancelled half of my buy limits as I had entered these positions higher at D.
Ultimately market moved up 3000 pips and I took partial profit at TP 1 and closed above TP2.
What could I have done differently?
I am happy with my D position
I should not have entered my position at C as there was not enough confirmations - I was lucky to be able to close at entry
Hope you had a great trading day!
TF = timeframe
TP = take profit
1H = 1 hour
4H = 4 hour
D = day
W = week
M = month
S&R = support & resistance
EMA = Exponential moving average
DT = Double Top
DB = Double Bottom
