US NAS 100


S&P 500 INTRADAY LEVELS FOR 27/02/2024BUY ABOVE - 5088
SL - 5081
TARGETS - 5100,5110,5120
SELL BELOW - 5070
SL - 5081
TARGETS - 5057,5047,5039
NO TRADE ZONE - 5070 to 5088
Previous Day High - 5100
Previous Day Low - 5070
Based on price action major support & resistance's are here, the red lines acts as resistances, the green lines acts as supports. If the price breaks the support/resistance, it will move to the next support/resistance line. White lines indicates previous day high & low, high acts as a resistance & low acts as a support for next day.
Trendlines are also significant to price action. If the price is above/below the trendlines, can expect an UP/DOWN with aggressive move.
Please NOTE: this levels are for intraday trading only.
Disclaimer - All information on this page is for educational purposes only,
we are not SEBI Registered, Please consult a SEBI registered financial advisor for your financial matters before investing And taking any decision. We are not responsible for any profit/loss you made.
Request your support and engagement by liking and commenting & follow to provide encouragement
HAPPY TRADING 👍

NAS100 FOR THE UPCOMING WEEKResistance
18097.01
18092.92
Fib .50 level
17998.84
Support
17919.08
17900.67
Point of interest
18220.75
17777.96
Waiting to see if NAS100 breaks either daily high or low.
After break and closure of the high or low an entry is going to be
initiated using the fib level to determine point of exit.

nasdaq (us100)
Hello friends
Unfortunately, I can't upload a video for you since yesterday
I will post it as a picture
We are currently in the range of the trading range, after the successive rises, the price is tired and resting, and we can be a seller in the ceilings and a buyer in the floors. specified to move
Do not log in without getting confirmation and be careful not to fall into the trap of unsuccessful failures

TQQQ Technical Analysis - Breakout and Key LevelsTechnical Breakout:
On November 13, 2023, NASDAQ:TQQQ experienced a significant structural shift with the breach of the $40 resistance level. The subsequent bull run in the tech sector propelled NASDAQ:TQQQ to a peak of $61.22 on February 12, 2024.
Fibonacci Retracement:
After reaching the peak of $61.22 on February 12, 2024, NASDAQ:TQQQ made an attempt to pull back, targeting the 0.618 Fibonacci level at $53.18. However, the retracement was not sustained, and NASDAQ:TQQQ returned to the previous high of $61.22 on February 23rd.
Current Situation:
As we await the market open on Monday, NASDAQ:TQQQ stands at a crucial juncture following the recent retest of $61.22.
RSI Divergence:
Since January 24th, we've observed RSI divergence, indicating a discrepancy between the price action and the strength of the trend. This could be a crucial signal, suggesting a potential shift in momentum that traders should closely monitor.
Upcoming Events :
This week brings important economic indicators:
Monday: Japan Inflation Rate
Tuesday: GfK Consumer Confidence and USA Durable Goods Orders
Wednesday: USA GDP
Thursday: USA PCE and Personal Spending
Friday: ISM Manufacturing
Market Expectations:
Anticipations are focused on the USA GDP, expected to perform worse than forecasted . This could influence market sentiment and potentially impact NASDAQ:TQQQ 's performance.
Forecast:
Given the current technical setup, RSI divergence and the upcoming economic events, there is a likelihood that NASDAQ:TQQQ could move towards the 0.5 Fibonacci level of $50.69 by Friday, March 1st. Traders should closely monitor developments and be prepared for potential volatility.
Disclaimer: This analysis is for informational purposes only and does not constitute financial advice. Traders should conduct their own research and consider risk factors before making any investment decisions.

CAN US100 MAKE A NEW ALL TIME HIGH ?Hello traders .
i think for nasdaq the market is still bullish ,
if the price manages to give a bullish reaction on the area it is likely that it going to give a trend continuation
for bears out there if you wanna sell look for shorts on round numbers / Psycological levels but don't hold for long its agaisnt the trend i think its going to keep going and maybe start possibly reversing on 20.000.
just a personal prediction of mine . according to the relative strenght index the market is making higher high but they are getting weaker and weaker i am thinking at the price 20000 by then the buyers will be tired and we might see a possible correction.

Nasdaq Shorts RevisedNasdaq created another leg to the upside throughout Asian & London. However, from hereon I’m expecting a decline on D1 & W1.
I’ll be taking entries if we get a close below 18000.00 on H1 at the retest.
Targets Visible.

NAS100USD Will Fall! Short!
Here is our detailed technical review for NAS100USD.
Time Frame: 8h
Current Trend: Bearish
Sentiment: Overbought (based on 7-period RSI)
Forecast: Bearish
The price is testing a key resistance 17724.5.
Taking into consideration the current market trend & overbought RSI, chances will be high to see a bearish movement to the downside at least to 17470.1 level.
P.S
Please, note that an oversold/overbought condition can last for a long time, and therefore being oversold/overbought doesn't mean a price rally will come soon, or at all.
Like and subscribe and comment my ideas if you enjoy them!

Nasdaq 100 Head and ShoulderHaving studied Nas100 for sometime now, I've noticed that it has a bullish turning movement of a head and shoulder. Expecting the market to correct/pull back into 4H demand before continuing to break all time highs. Expecting move from now until early next week, latest Wednesday.

Nasdaq Long Idea!Hello traders!
Based on my analysis Nasdaq looks bullish and could go to the next supply.
Good luck!


NAS100
simple trading - follow the trend
A very bullish market always needs a pullback. What a great Head and Shoulders pattern for a reversal to the downside. NAS100 has officially broken below all bullish trend lines on the Daily. NAS100 is looking to create more sell pressure. With NAS100 being at the top of its weekly trend, look for a correction. Massive sell if NAS100 cannot remain above the 4hr support zone.
BULLS :
Buy at 17588 4hr support,
If candles remain above this area and create bullish momentum, look for a target at 17661. A new higher lower should be a confirmation for continuation to the upside.
BEARS :
Wait for a retest to 17661 with bearish candles, Do NOT sell now but wait for a retest
*Previous sell opportunity:
17730
17665
This week's trading:
Look for NAS100 to consolidate and respect market support and resistance areas. Once the market has made a decision, then we trade!

NAS100USD Will Go Lower From Resistance! Sell!
Take a look at our analysis for NAS100USD.
Time Frame: 12h
Current Trend: Bearish
Sentiment: Overbought (based on 7-period RSI)
Forecast: Bearish
The market is approaching a significant resistance area 17940.7.
Due to the fact that we see a positive bearish reaction from the underlined area, I strongly believe that sellers will manage to push the price all the way down to 17589.5 level.
P.S
Please, note that an oversold/overbought condition can last for a long time, and therefore being oversold/overbought doesn't mean a price rally will come soon, or at all.
Like and subscribe and comment my ideas if you enjoy them!

Last Buy trade for me on Nasdaq.I will target 18000 for this trade and may enter a short trade afterwards. Will wait and see confirmation on 15M chart

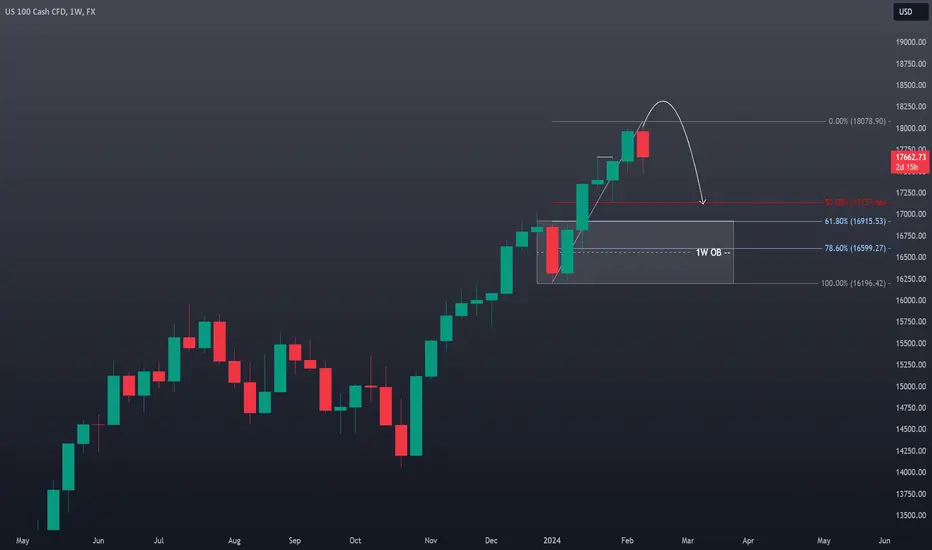
NAS100 Technical Analysis and Trade Idea - Full ExplanationMarket Observations: The #NAS100 has maintained a bullish trajectory. However, price action on the monthly timeframe suggest the #US100 is overextended. Additionally, the weekly chart reveals a double top pattern, hinting at a potential retracement down to the 50-61.8% Fibonacci levels. This area could provide the liquidity needed for major market players to fill long orders.
Trade Strategy: Consider an intraday/swing trade short entry following a potential stop run above the current range. Target an initial profit level around the previous lows near 17250, with a secondary target at 17000 (slightly above the 61.8% Fibonacci level on a 1W chart). Implement a well-placed stop-loss order to manage risk effectively.
Disclaimer: This analysis is based on my observations and does not constitute financial advice. Conduct your own independent research and carefully assess your risk tolerance before making investment decisions.

NAS100 Technical Analysis and Trade Idea
Market Observations: The #NAS100 has maintained a bullish trajectory. However, price action on the monthly timeframe suggest the #US100 is overextended. Additionally, the weekly chart reveals a double top pattern, hinting at a potential retracement down to the 50-61.8% Fibonacci levels. This area could provide the liquidity needed for major market players to fill long orders.
Trade Strategy: Consider an intraday/swing trade short entry following a potential stop run above the current range. Target an initial profit level around the previous lows near 17250, with a secondary target at 17000 (slightly above the 61.8% Fibonacci level on a 1W chart). Implement a well-placed stop-loss order to manage risk effectively.
Disclaimer: This analysis is based on my observations and does not constitute financial advice. Conduct your own independent research and carefully assess your risk tolerance before making investment decisions.
GVA STOCK PRICE GOT REJECTED AT SUPPORT LEVEL WILL PRICE SURGE?Granite Construction Inc. has its 5 week declining stock price rejected with bullish engulf candle at the support level (44). Will this rejection cause the price to begin another bullish run?
N.B!
- GVA price might not follow drawn lines . Actual price movement may likely differ from the forecast.
- Let emotions and sentiments work for you
- ALWAYS Use Proper Risk Management In Your Trades
#gva
#nyse
#s&p500

Nasdaq (us100)
Hello
Let's have a new update of Nasdaq
Well, we see that we are strongly bullish. Be careful, friends, do not enter into sales transactions
Only sell as a quick scalp
With this bullish intensity, targets of 19,000 and 20,000 will be available
Do not enter into any transaction without confirmation

Nasdaq Intraday Review - Thursday 8 Feb 2024I trade Nasdaq intraday exclusively
Trading in GMT time zone
Sharing my post day review and analysis in case it can help you!
Looking exclusively for buys - the trend is your friend! :)
Did my analysis at +- 5:20am
During analysis noted the following:
Bulls rallied over 2000 pips yesterday and overnight, had managed to keep price at this level.
Market has consolidated in a triangle / rising wedge pattern (I felt it was more a rising wedge pattern based on the bodies of the candles)
Rising wedge patterns tend to break down, but can break either way
Pivot point and fib levels are far down from where price currently is, +- 800 pips. So I need to be careful buying because if the market does retrace, it is a big draw down that I will have to handle.
Initial jobless claims will be released today - I feel that due to the sensitivity of the Fed / interest rate debate, this may cause volatility at time of release.
Pivot point zone looks of interest to me as a potential buy zone because it is close to the 1H 0.382 fib level, creating an area of confluence.
This fib drawn from swing low at A. to swing high at B.
To make matters a bit more exciting, I am not able to be at my trading screens today. This means I need to set my buy limits and hope for the best.
I set my buy limit for 50% of my usual position size at C. - Confirmations:
Fib - This represented the 0.382 fib level
S&R - pivot point
I set a second buy limit at D. for 50% of my usual position size - Confirmations:
Fib - This represented the 0.618 fib level
Trendline - blue uptrend line, intersecting this area
S&R - 4H 20 EMA was roughly at this level
Unfortunately, price never reached my buy zones.
When I returned to my screens and did my analysis, I noted that the entry for today would have been quite clear.
If I was trading properly today, I would have entered at E. because price made a nice double bottom just above my zone, by the 1H EMA.
I would have entered on the break of the neckline, which also meant that price had broken back above the 1H EMA
There was also a nice inverted hammer candle on the 1H TF, followed by a green momentum candle at E. further supporting the buy entry.
Market moved up from here +- 700 pips.
What could I have done differently?
Nothing, as I wasn’t able to be at my desk today! :(
Hope you had a good trading day!
TF = timeframe
TP = take profit
1H = 1 hour
4H = 4 hour
D = day
W = week
M = month
S&R = support & resistance
EMA = Exponential moving average


Nasdaq Intraday Review – Wednesday 7 Feb 2024I trade Nasdaq intraday exclusively
Trading in GMT time zone
Sharing my post day review and analysis in case it can help you!
Did my analysis at +- 5:20am
During analysis noted the following:
The 4H EMA has acted as a strong support for 2 x 4H candles (marked at A.)
The D neckline (you see it better on the line chart) that was previously broken down and re-tested by market, is resistance turned support & is acting as a strong support
Trend is clearly uptrend - nearly seen from D line chart
Looking exclusively for a buy - The trend is your friend
Entered a sell (even though I just said I was looking for buys ;) ) at B -
Confirmations:
- Market Patterns - Market had broken the 4H neckline marked in pink, travelled down the same distance as the height of the pattern i.e. reach profit target and was now returning to test the neckline. The early morning bulls had pushed past the neckline but met bear resistance at C. It looked as if bears had won the battle as price was pushed below 1H + 30min EMA + pivot point at E. So even though I was looking for a buy, I believed market would sell as neckline failed the bull re-test
- Candlesticks - Strong bear momentum candles between E. and B. on 15min through to 1 H TF
- Fib - Point C. was at the seller's 0.618 fib retracement level and market was moving aggressively down
- S&R - Pivot point had failed as support and 30min + 1H EMA was acting as resistance
- Trendline - This was against the trend but I looked to me like a trend change in progress
The 4H EMA + the red support line of the "D Neckline " was too strong for bears to break down and ultimately market moved up from here.
I closed at my mental stop, which was the thick pink line, taking a loss of 445 pips.
Usually I would have been discouraged that my first entry for the day did not work out. Usually, self-doubt creeps in and I become very insecure and hesitant.
Today, I was determined not to let that happen and keep my mental state as level as possible.
Watching price action carefully and needing to be convinced that market had indeed properly broken through the neckline, I entered a buy at D. -
Confirmations:
- Market Pattern - My initial reason for selling is not turned around so, price seemed to have convincingly broken through the neckline, meaning that the down trend was over and an uptrend would begin
- Fib - Point B. was at the buyers 0.50 fib level, representing a strong fib level
- Candlesticks - I opened a buy after a very long wick green hammer candle closed on the 15min TF. This represented market testing the pivot point one last time with a big rejection.
- S&R - The 30min + 1H EMAs + pivot had turned into support
- Trend - Trading with the overall trend which usually tends to be my most profitable trades. Also the orange temporary down trend had been broken
Usually when self-doubt creeps in, I tend to open very small positions in an attempt not to increase my losses for the day. But this time I opened at my full position size.
As market moved up, I closed partial profits to cover my losses for the day and still have a runner open which I will close as per what the candles are saying.
Market has moved 1886 pips from my position, I am trading risk free (stop loss at entry) with my losses covered for the day.
So I am a happy chappy!
Ultimately I closed my position at 17739, when a double top started forming on the 30 min.
What could I have done differently?
I had analysed in the morning that the 4H EMA and the red slanted support line were very strong, but I choose to ignore that when I entered my sell as price was right at this level.
I should have waited to see how price would react to these strong elements before jumping in.
Hope you caught this nice buy!
TF = timeframe
TP = take profit
1H = 1 hour
4H = 4 hour
D = day
W = week
M = month
S&R = support & resistance
EMA = Exponential moving average

NAS100 Technical AnalysisThe #NAS100 has been on an upward trend, but a potential triple top pattern is forming on the chart. If the #DXY retraces further and rebounds from support, the #US100 could spike above the current high, potentially taking out buy-side stop-loss orders before pulling back down to the 61.8% Fibonacci level. Remember, trading the #NASDAQ involves significant risk. This analysis is just my opinion and shouldn't be considered financial advice.
